Copyright
©The Author(s) 2024.
World J Gastrointest Oncol. Jun 15, 2024; 16(6): 2842-2861
Published online Jun 15, 2024. doi: 10.4251/wjgo.v16.i6.2842
Published online Jun 15, 2024. doi: 10.4251/wjgo.v16.i6.2842
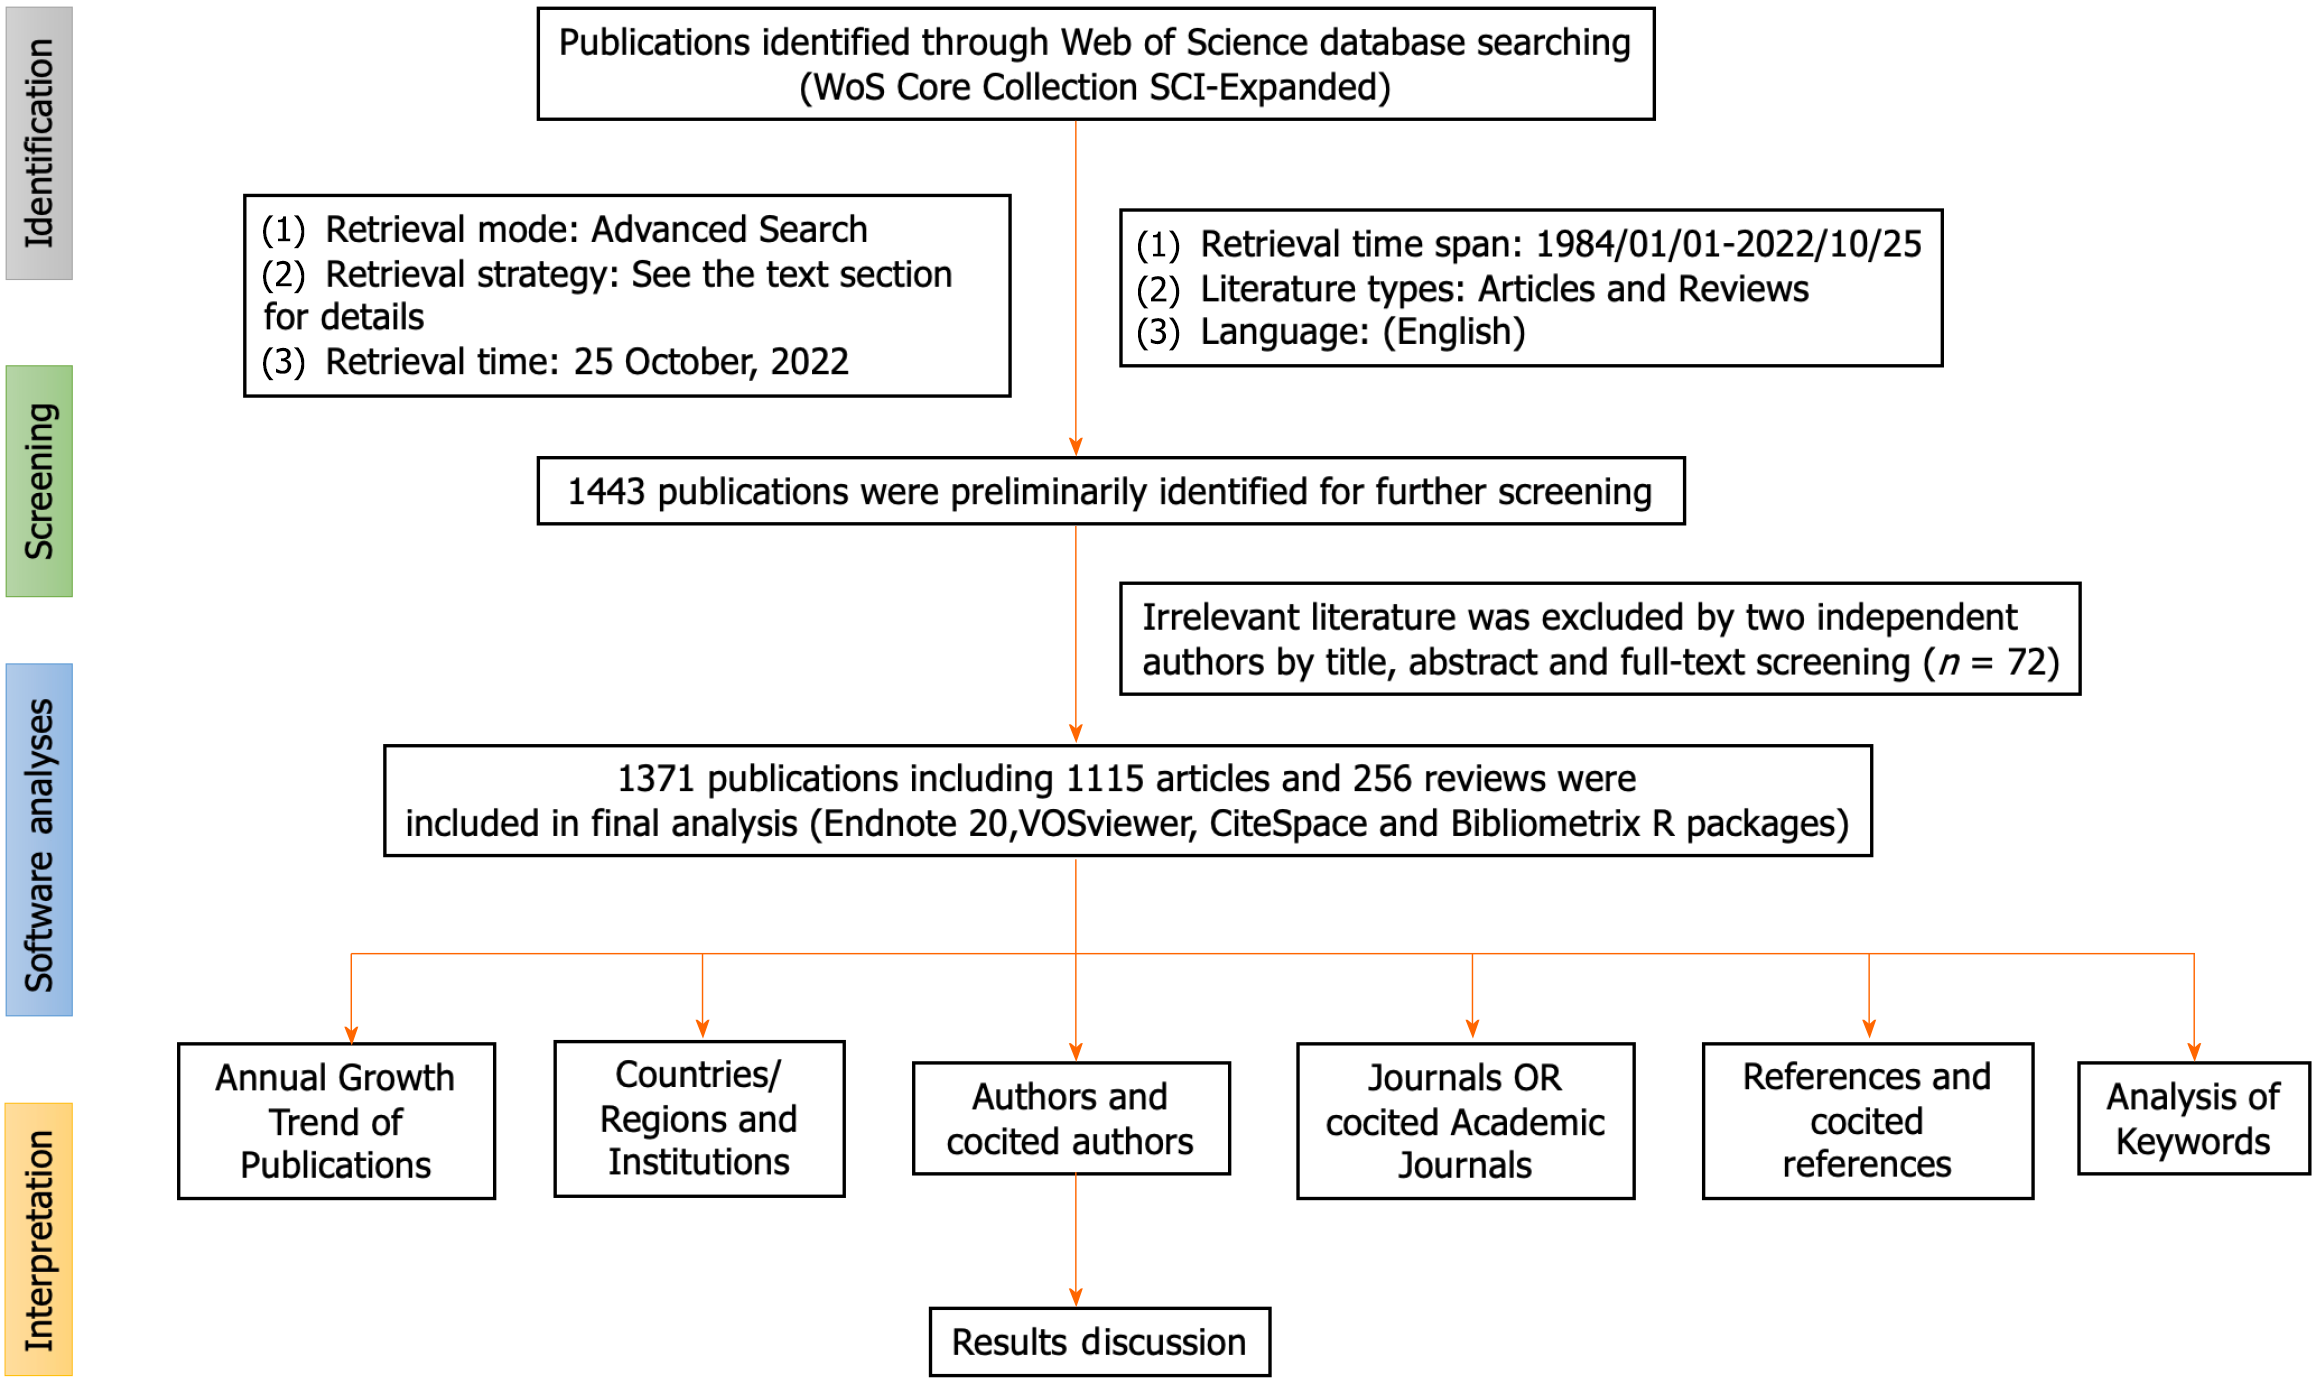
Figure 1 Flow chart of the scientometric study.
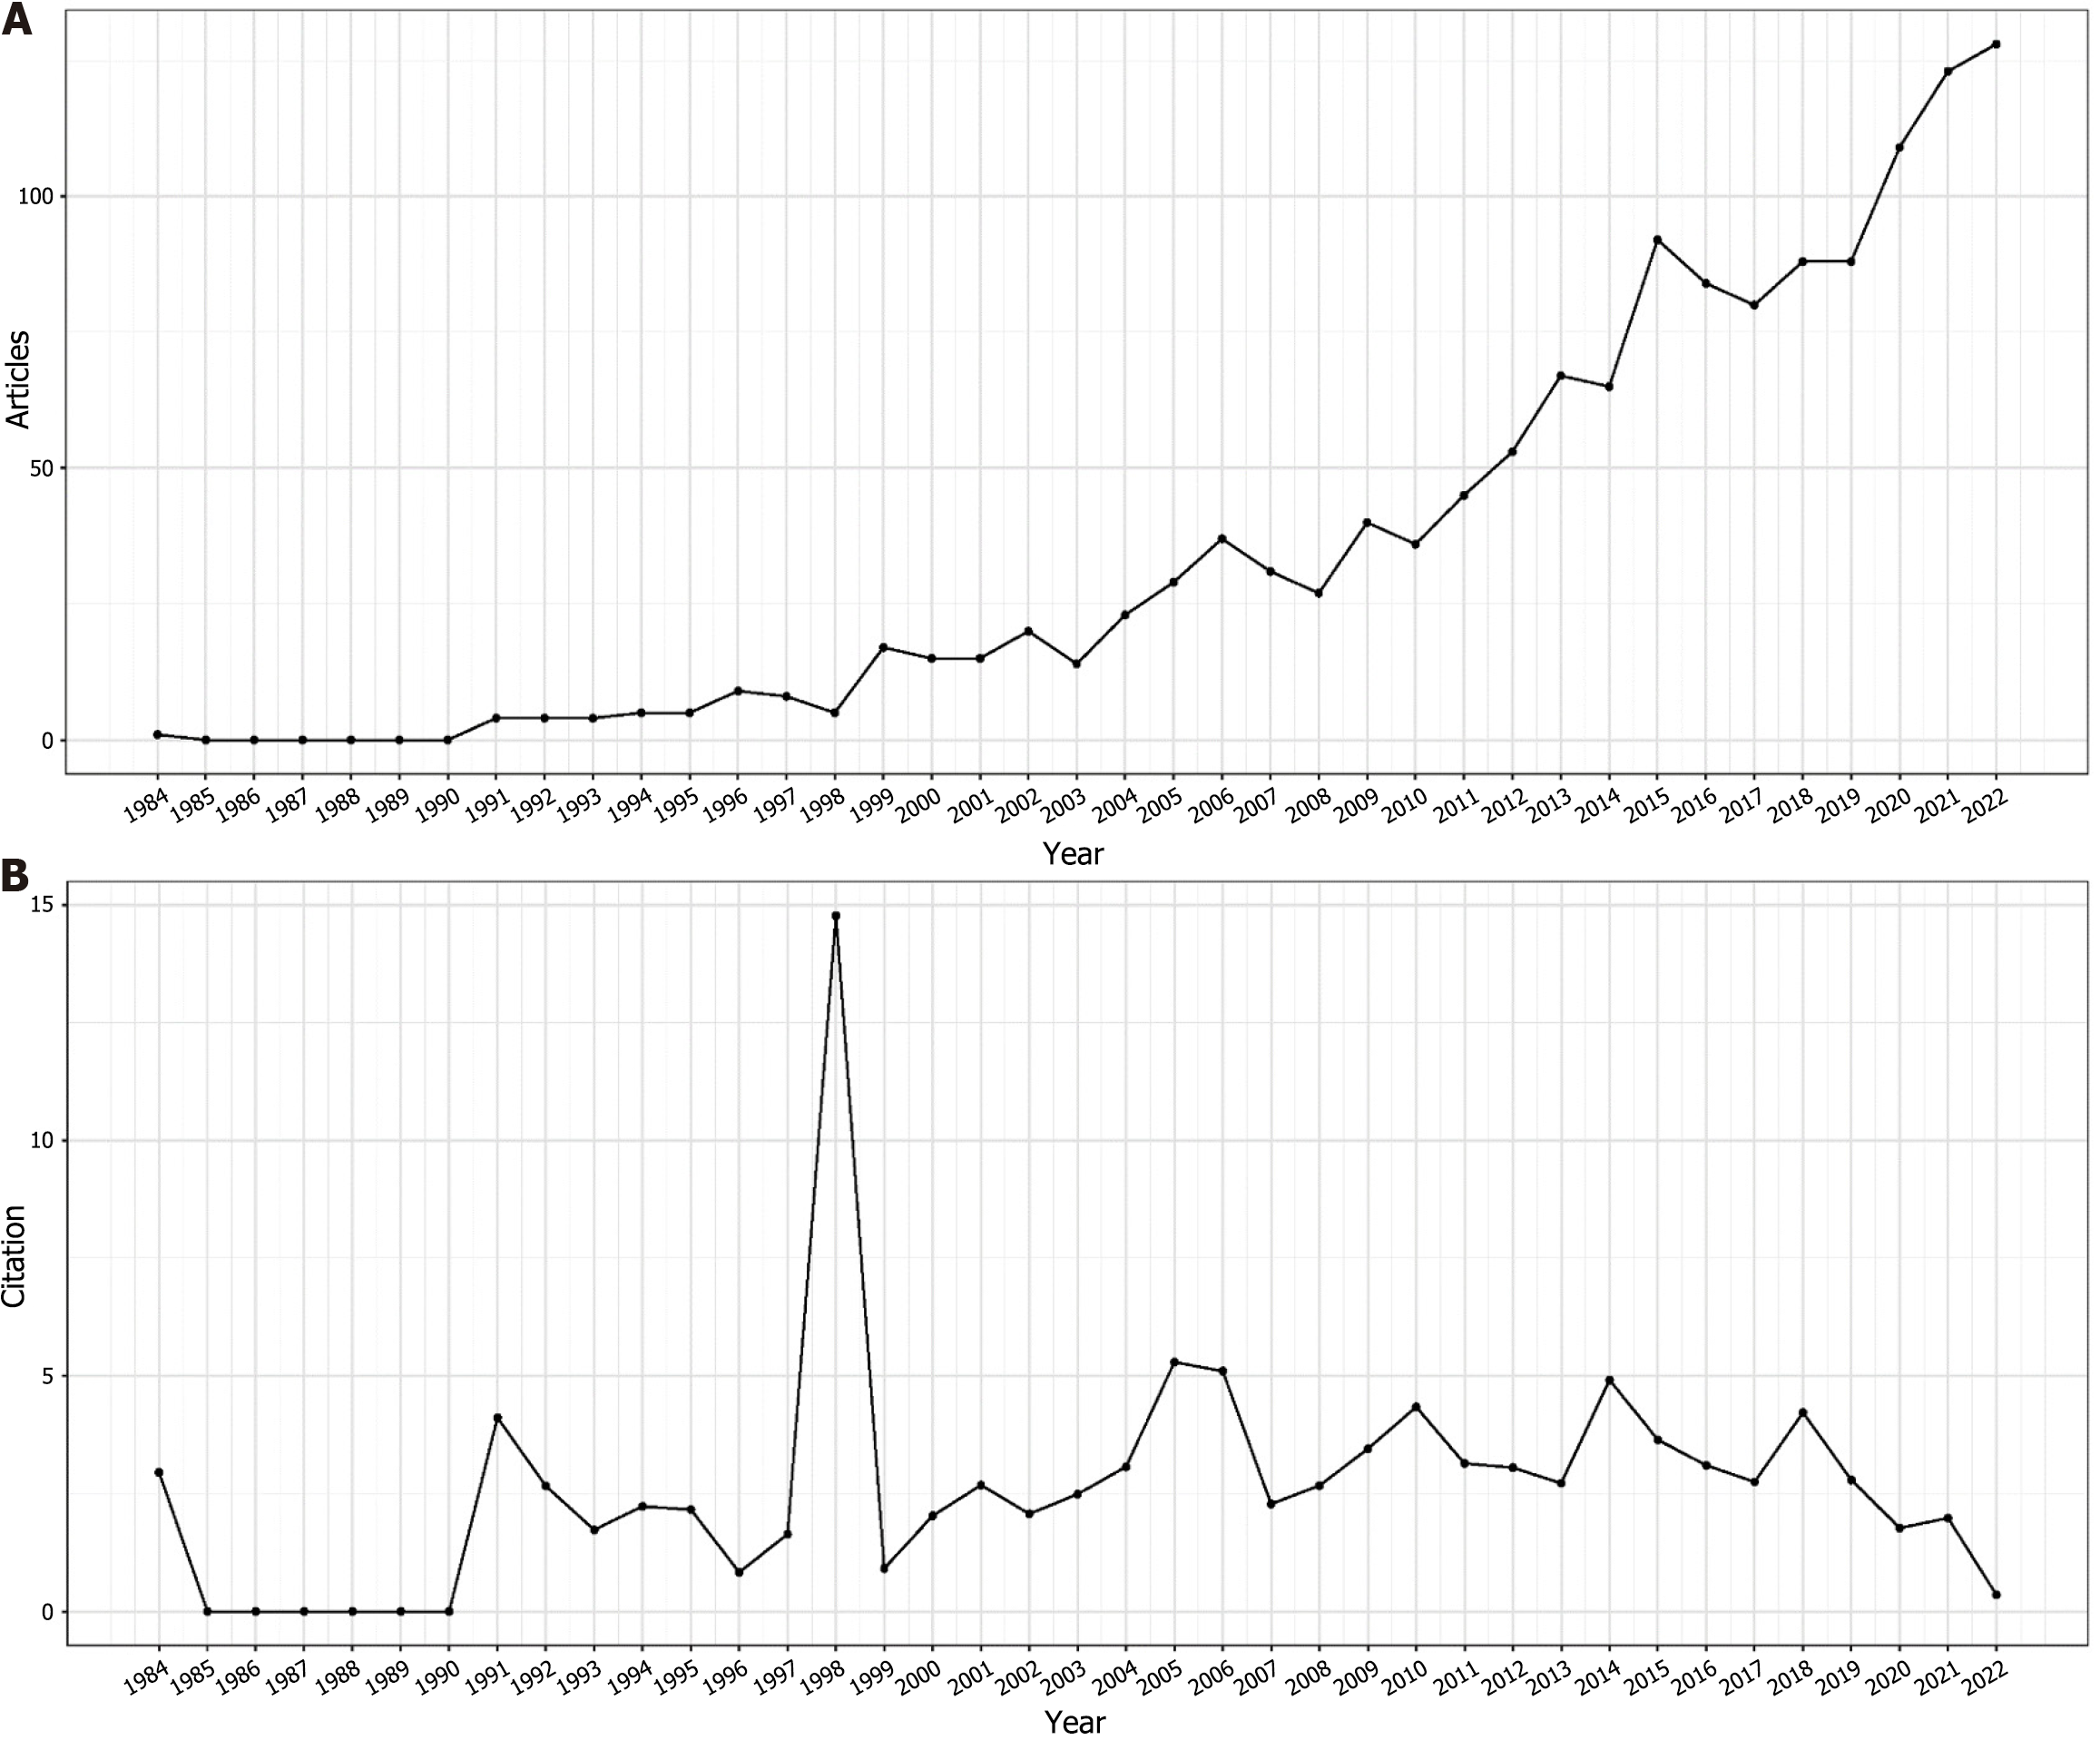
Figure 2 Trends in the publication of gastrointestinal neoplasms risk assessment studies from 1984 to 2022.
A: Annual scientific production of gastrointestinal neoplasm risk assessment research from 1984 to 2022; B: Average number of citations per year for publications on gastrointestinal neoplasm risk assessment from 1984 to 2022.
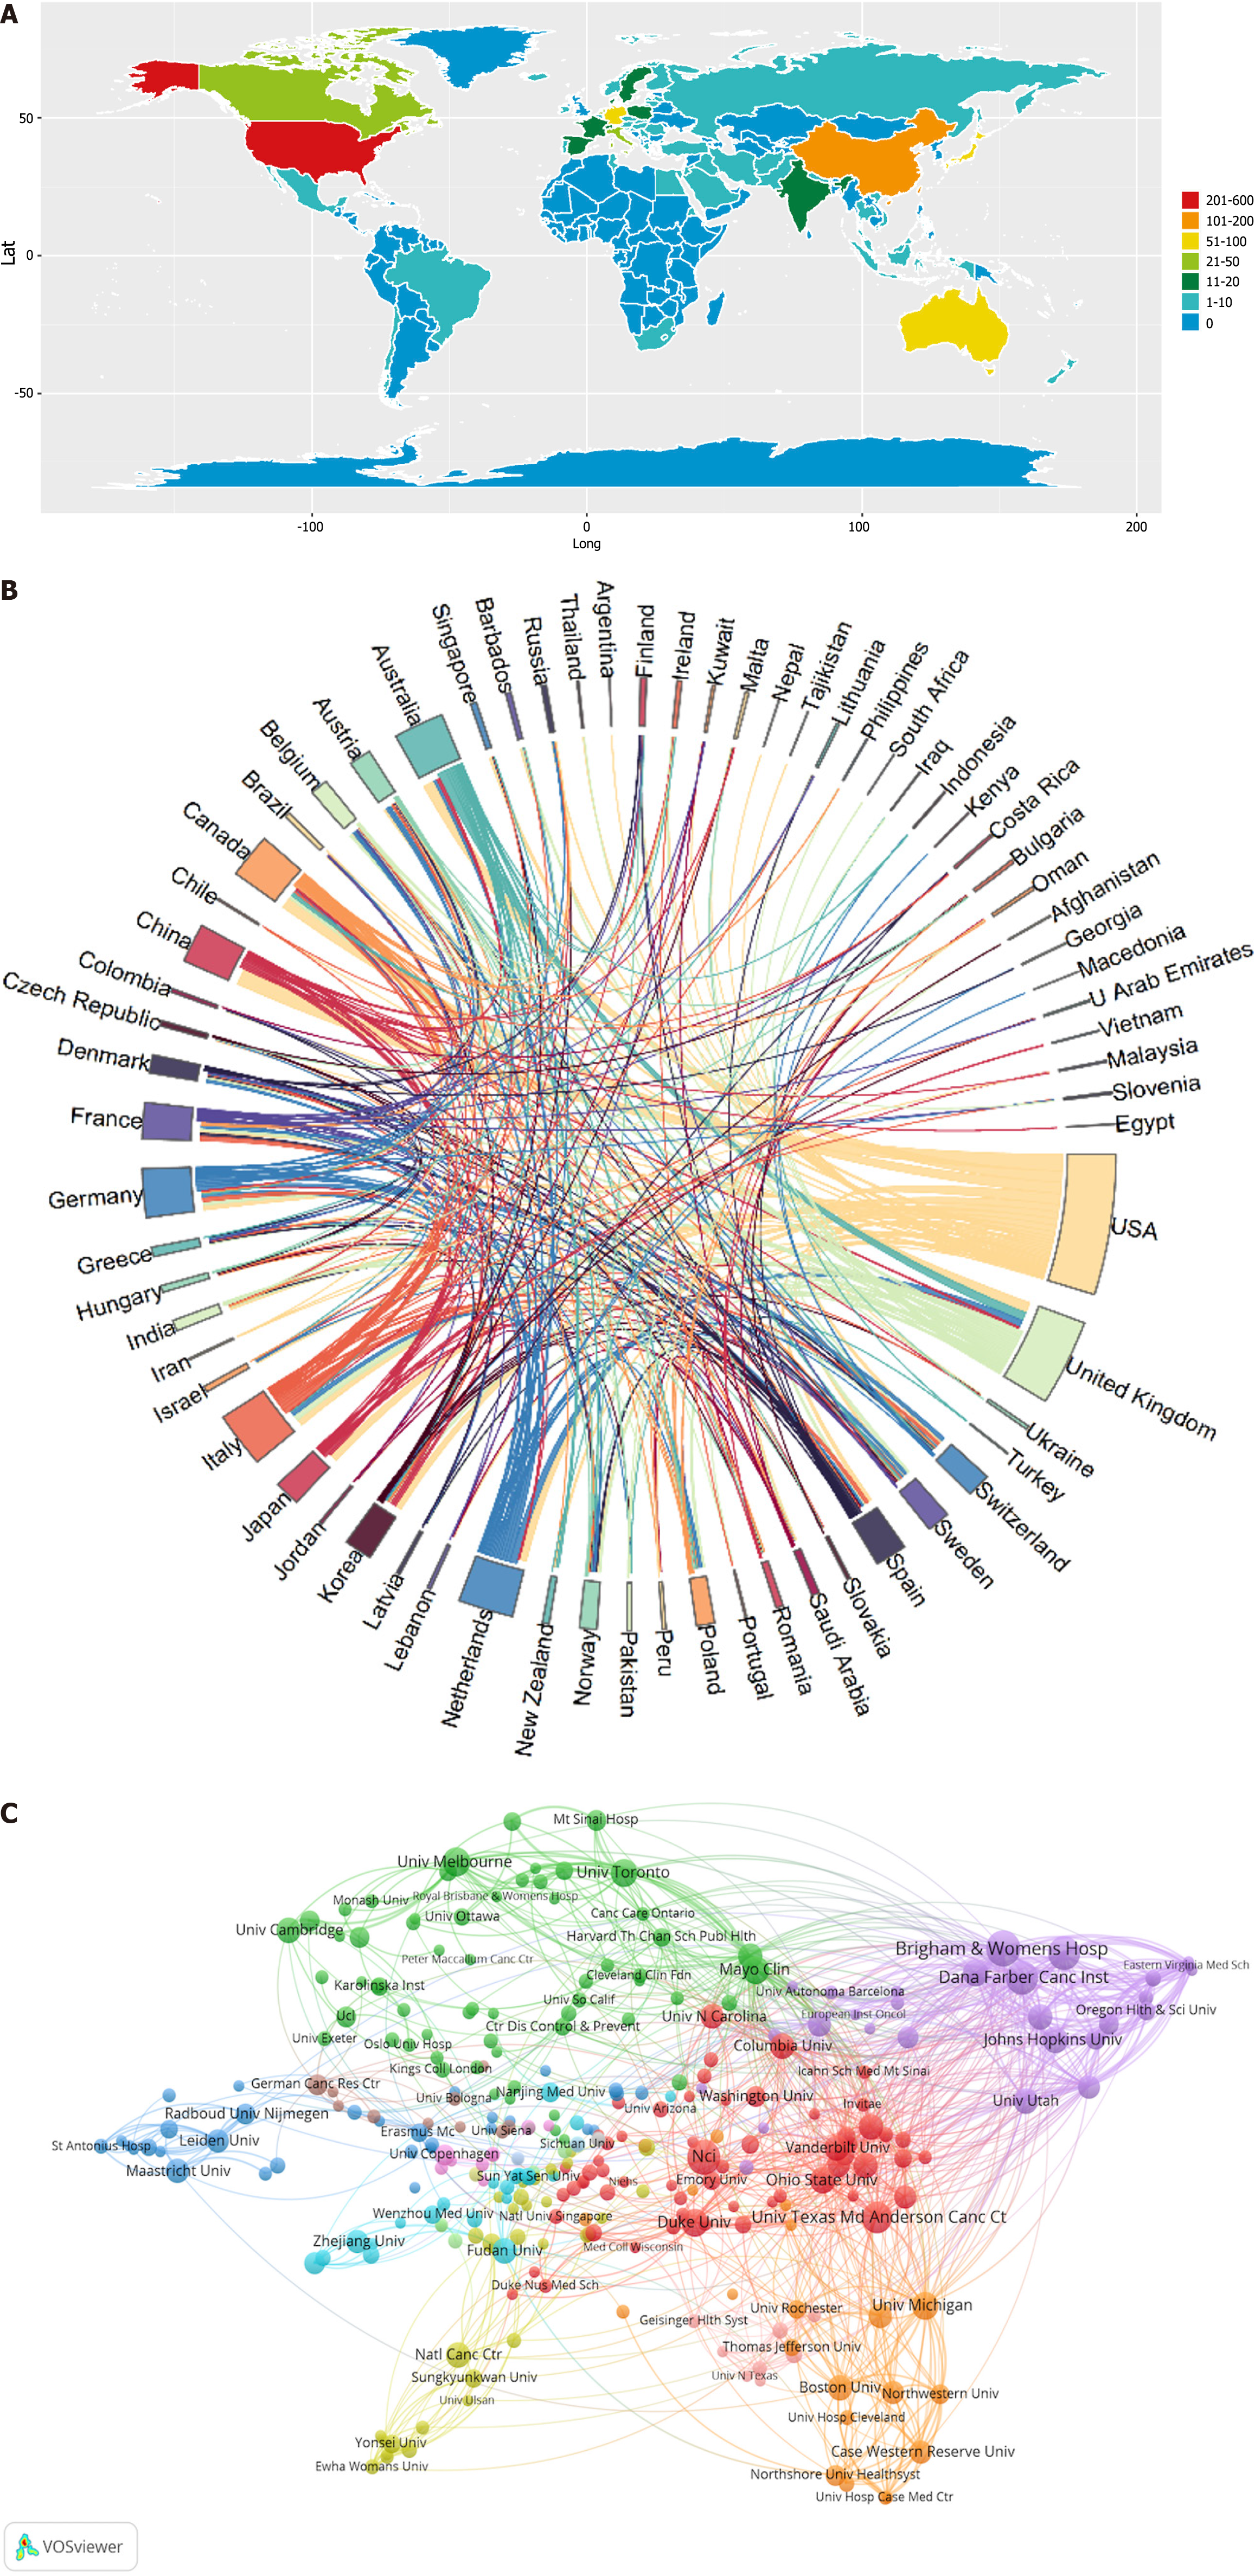
Figure 3 Distribution and cooperation of regions and institutions.
A: World map displaying the global distribution of the current research themes; B: Distribution and international cooperation of countries/regions involved in the current research field; C: Visualization map of the institutional collaboration network generated by VOSviewer software.
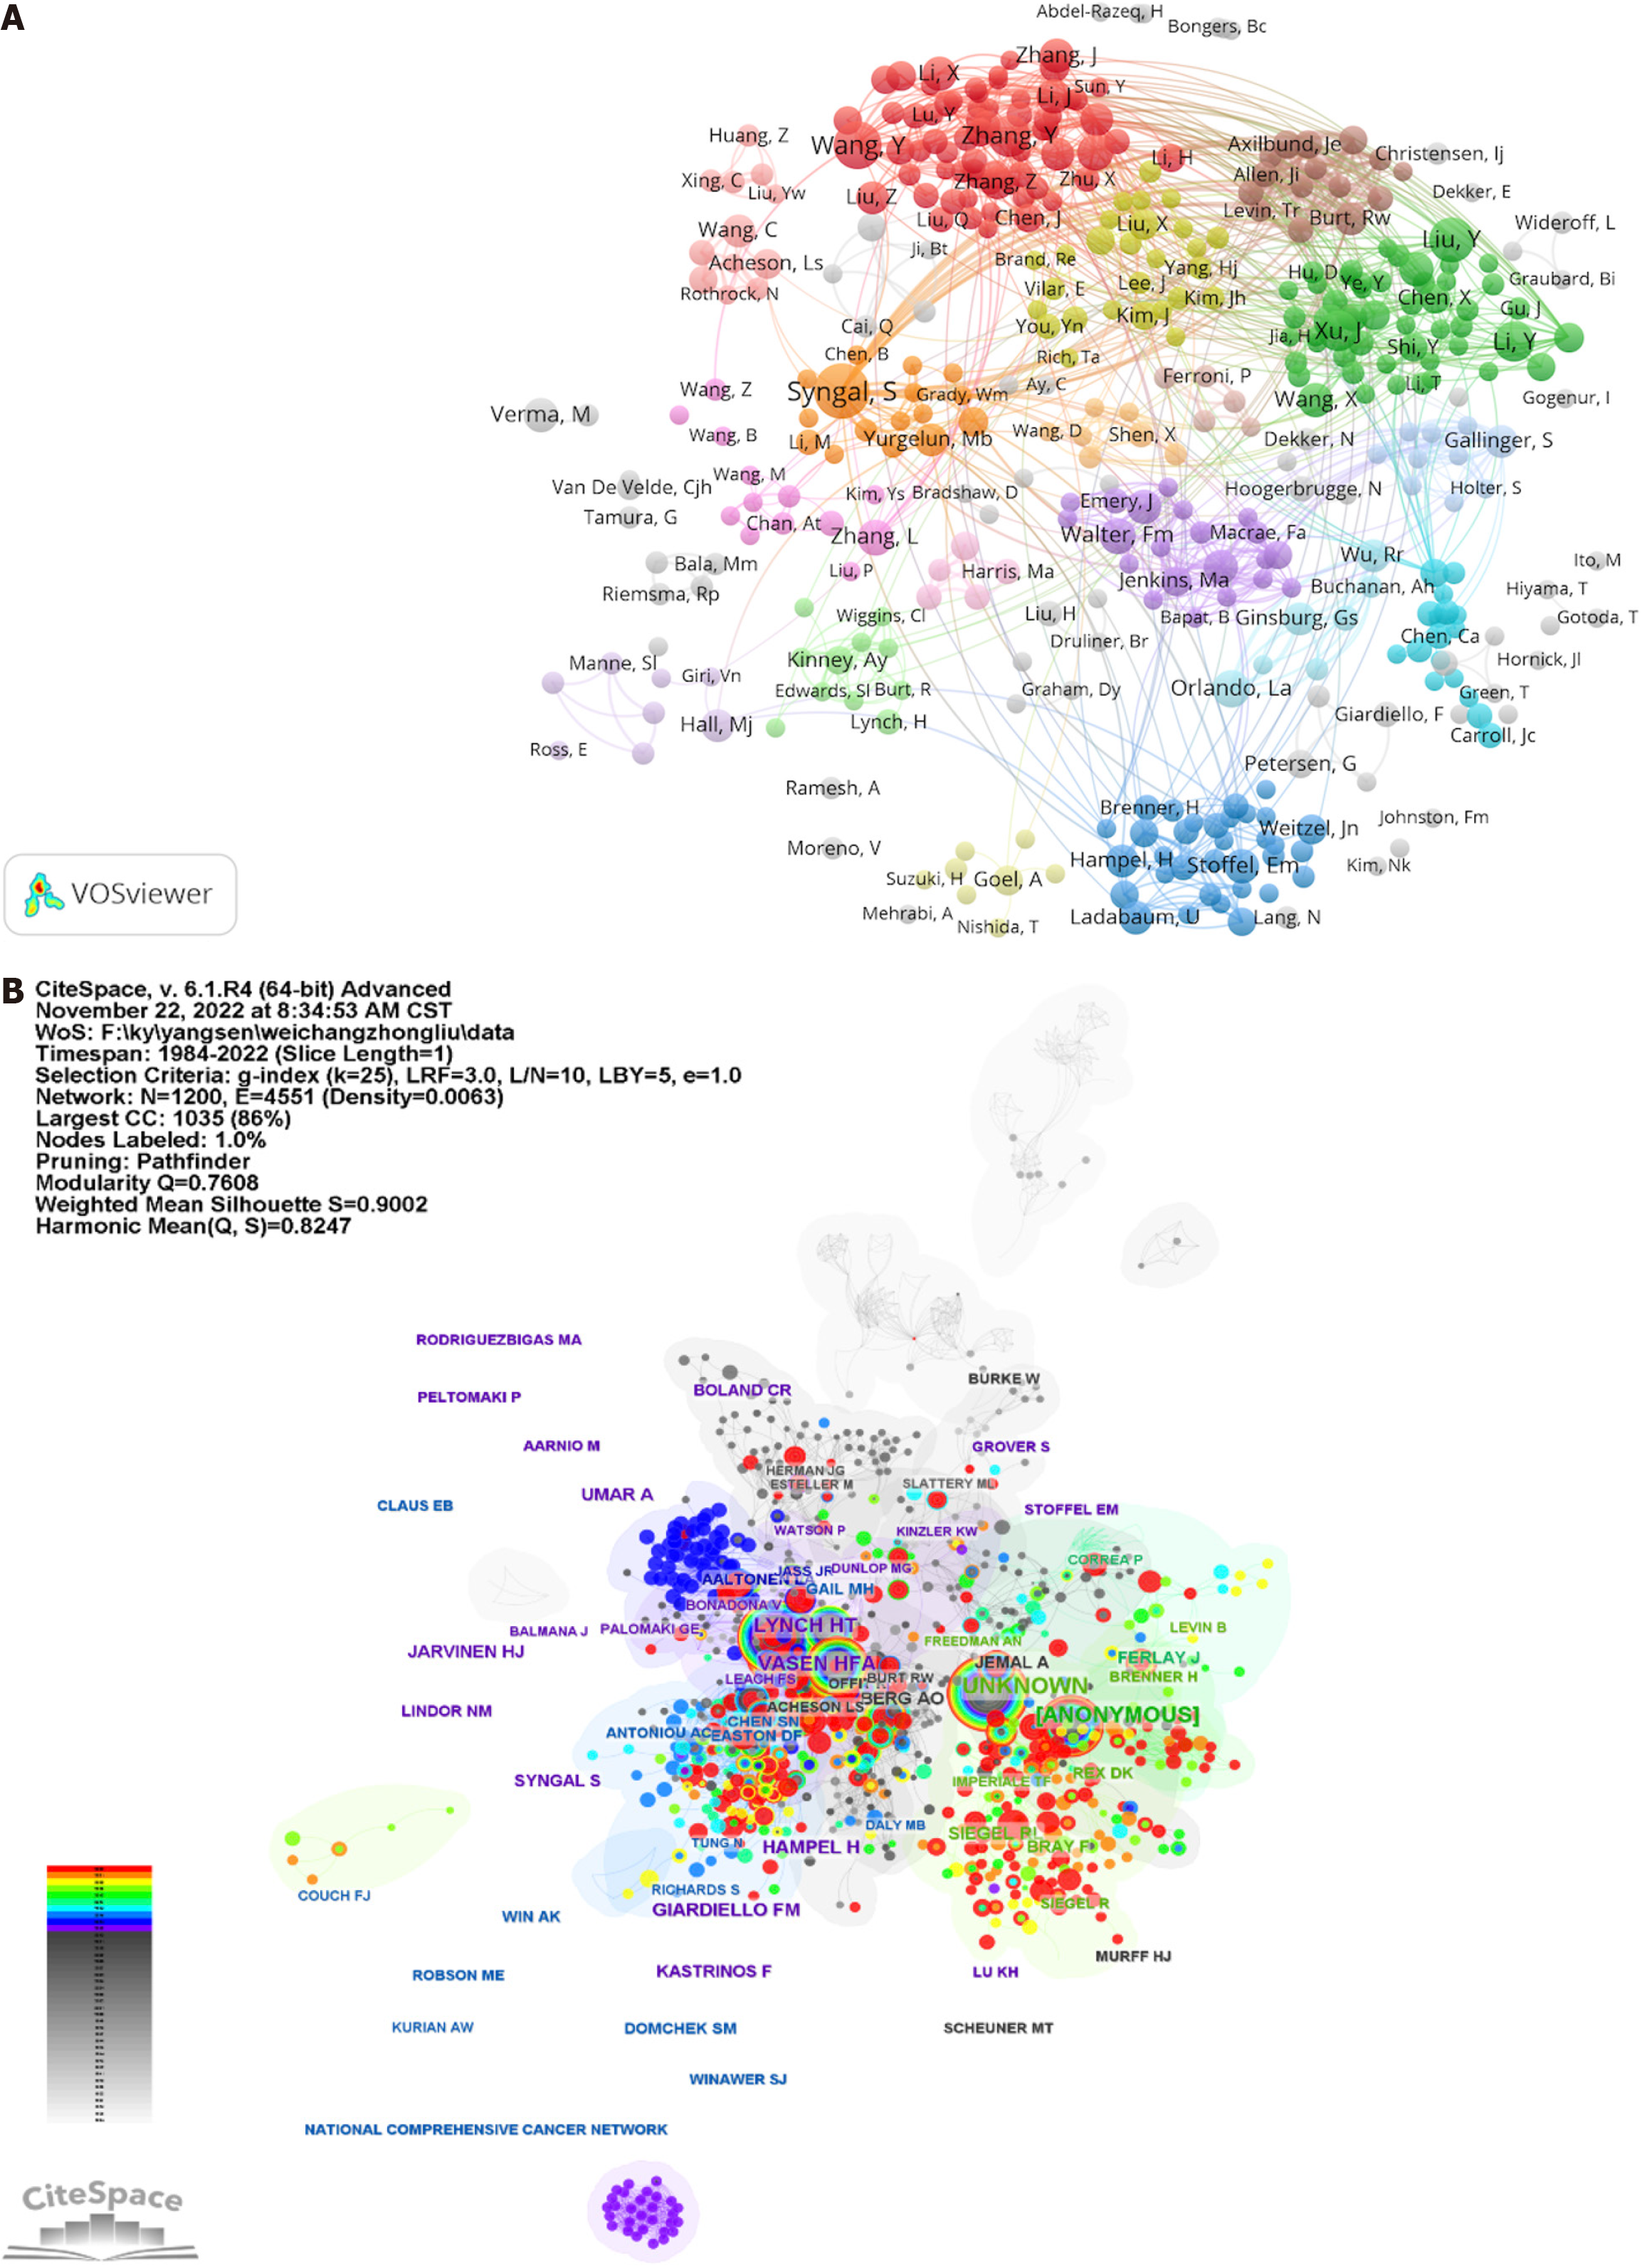
Figure 4 The linking of authors' bibliographies.
A: The visualization map of the authors' collaboration network was generated using VOSviewer software (frequency ≥ 3); B: Visualization map of cocitation analyses of authors conducted on CiteSpace.
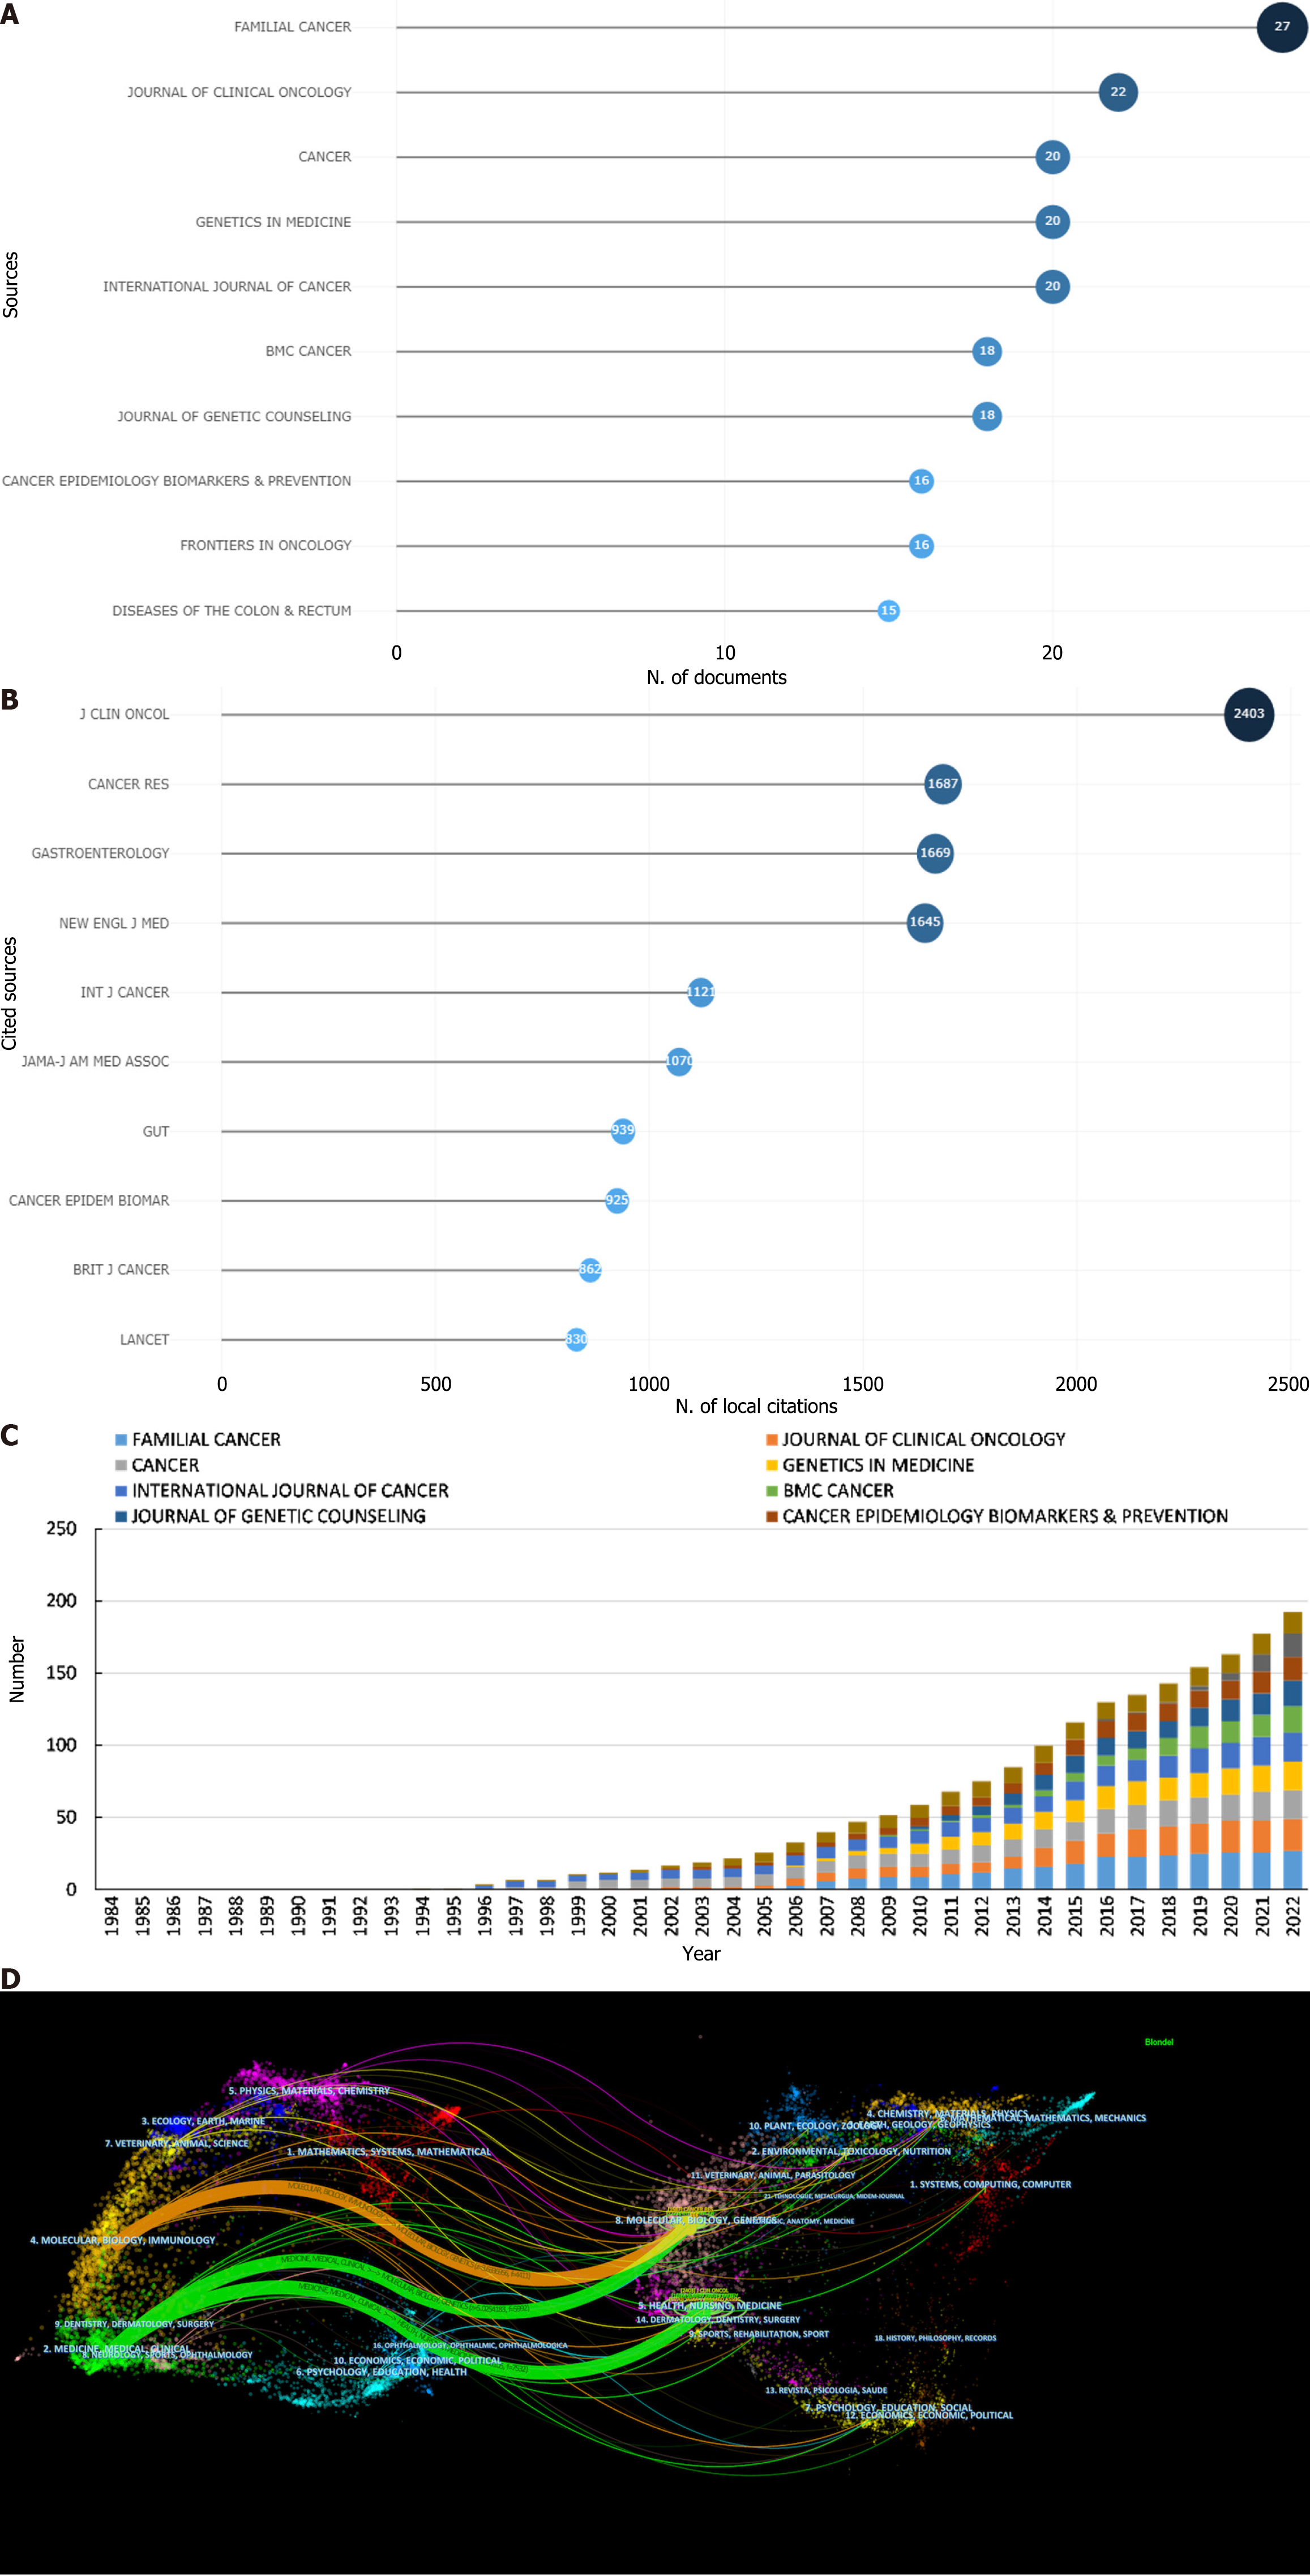
Figure 5 Distribution of journals.
A: Top 10 journals related to the research on the risk assessment of gastrointestinal neoplasms; B: Top 10 cocited journals related to the research on the risk assessment of gastrointestinal neoplasms; C: The changing trend of the cumulative publication quantity in the top 10 journals generated by Bibliometix software from 1984 to 2022; D: Dual-map coverage of journals related to the risk assessment of gastrointestinal neoplasms.
- Citation: Fu QQ, Ma L, Niu XM, Zhao HX, Ge XH, Jin H, Yu DH, Yang S. Trends and hotspots in gastrointestinal neoplasms risk assessment: A bibliometric analysis from 1984 to 2022. World J Gastrointest Oncol 2024; 16(6): 2842-2861
- URL: https://www.wjgnet.com/1948-5204/full/v16/i6/2842.htm
- DOI: https://dx.doi.org/10.4251/wjgo.v16.i6.2842


