Copyright
©The Author(s) 2024.
World J Gastrointest Oncol. Jun 15, 2024; 16(6): 2816-2825
Published online Jun 15, 2024. doi: 10.4251/wjgo.v16.i6.2816
Published online Jun 15, 2024. doi: 10.4251/wjgo.v16.i6.2816
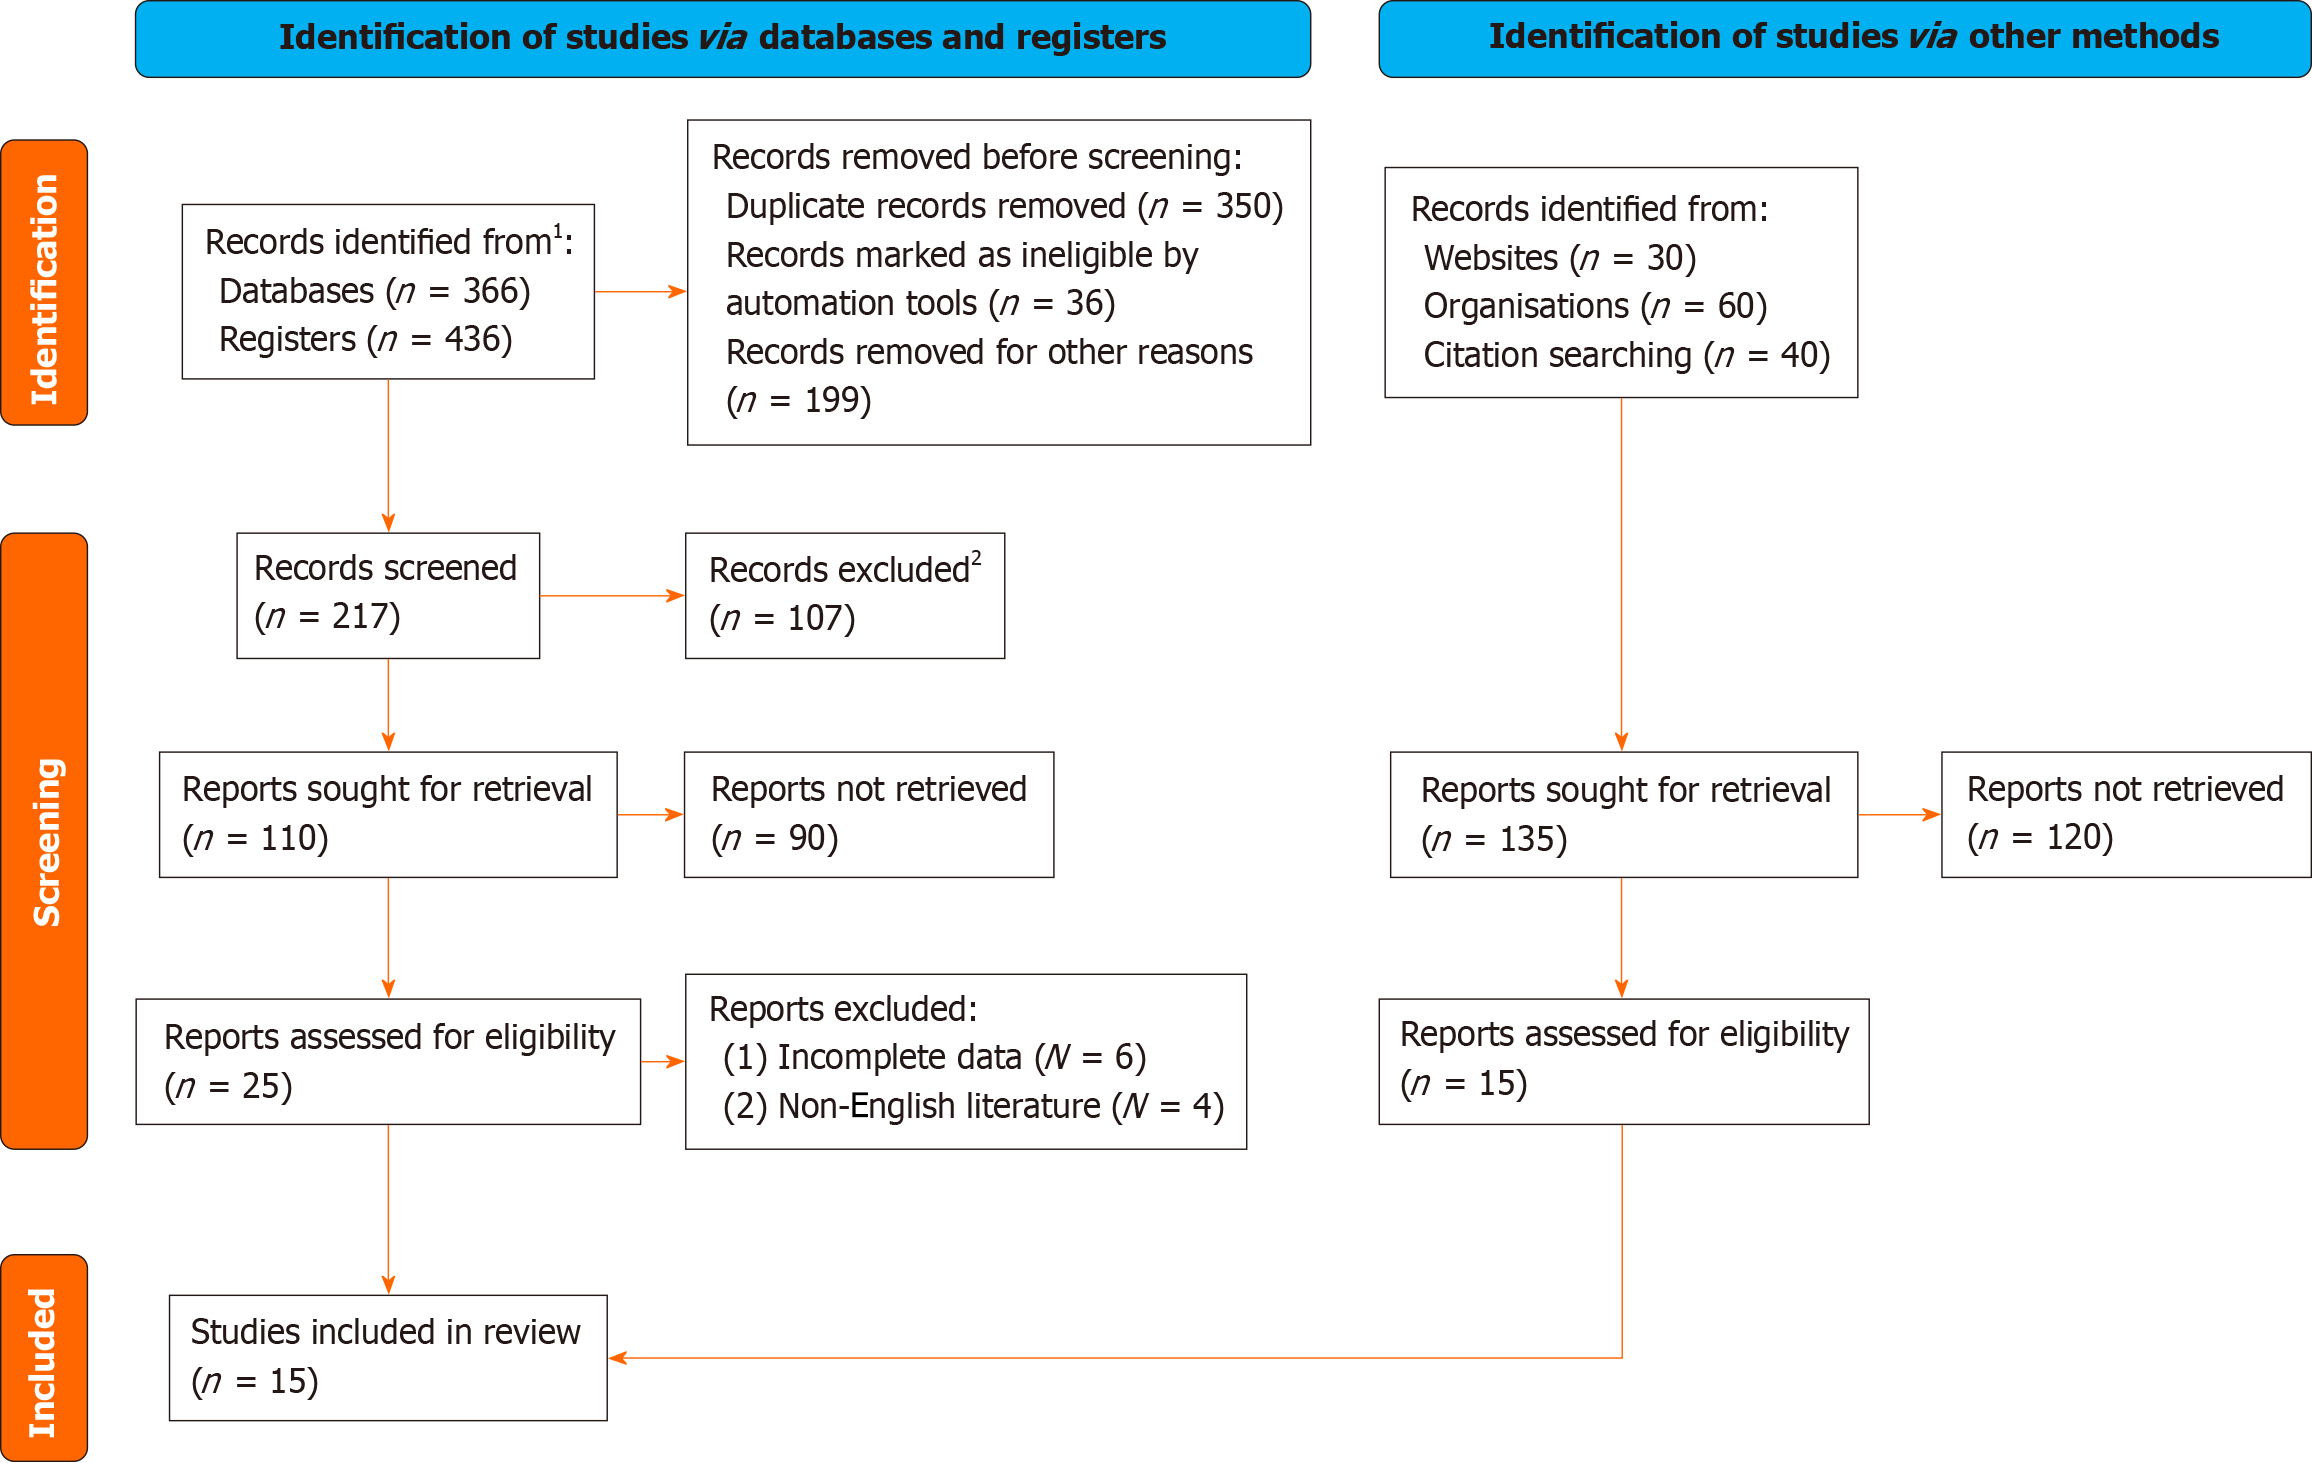
Figure 1 Flow chart of the literature screening.
1Consider, if feasible to do so, reporting the number of records identified from each database or register searched (rather than the total number across all databases/registers). 2If automation tools were used, indicate how many records were excluded by a human and how many were excluded by automation tools.
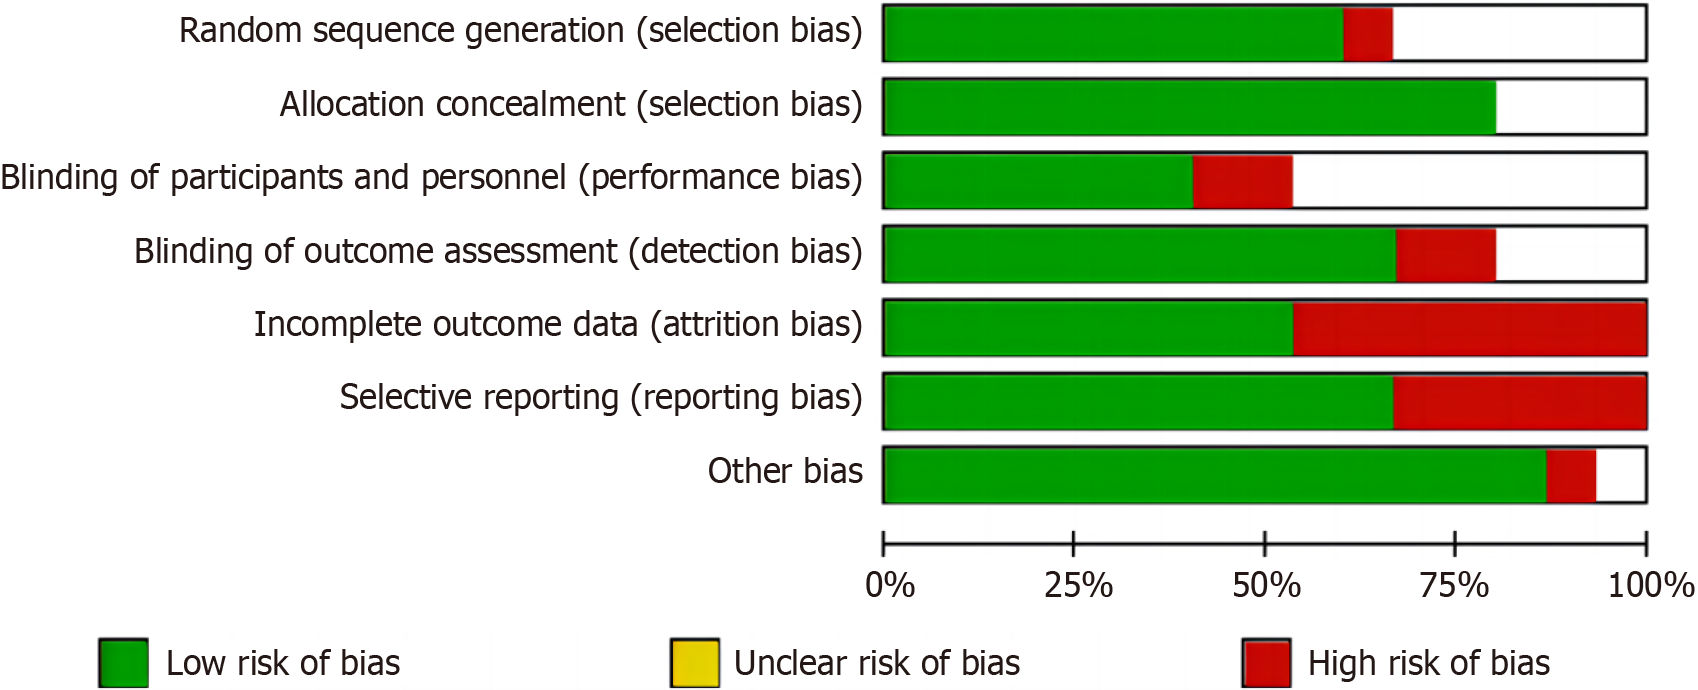
Figure 2
Risk of bias graph of literature quality evaluation chart.
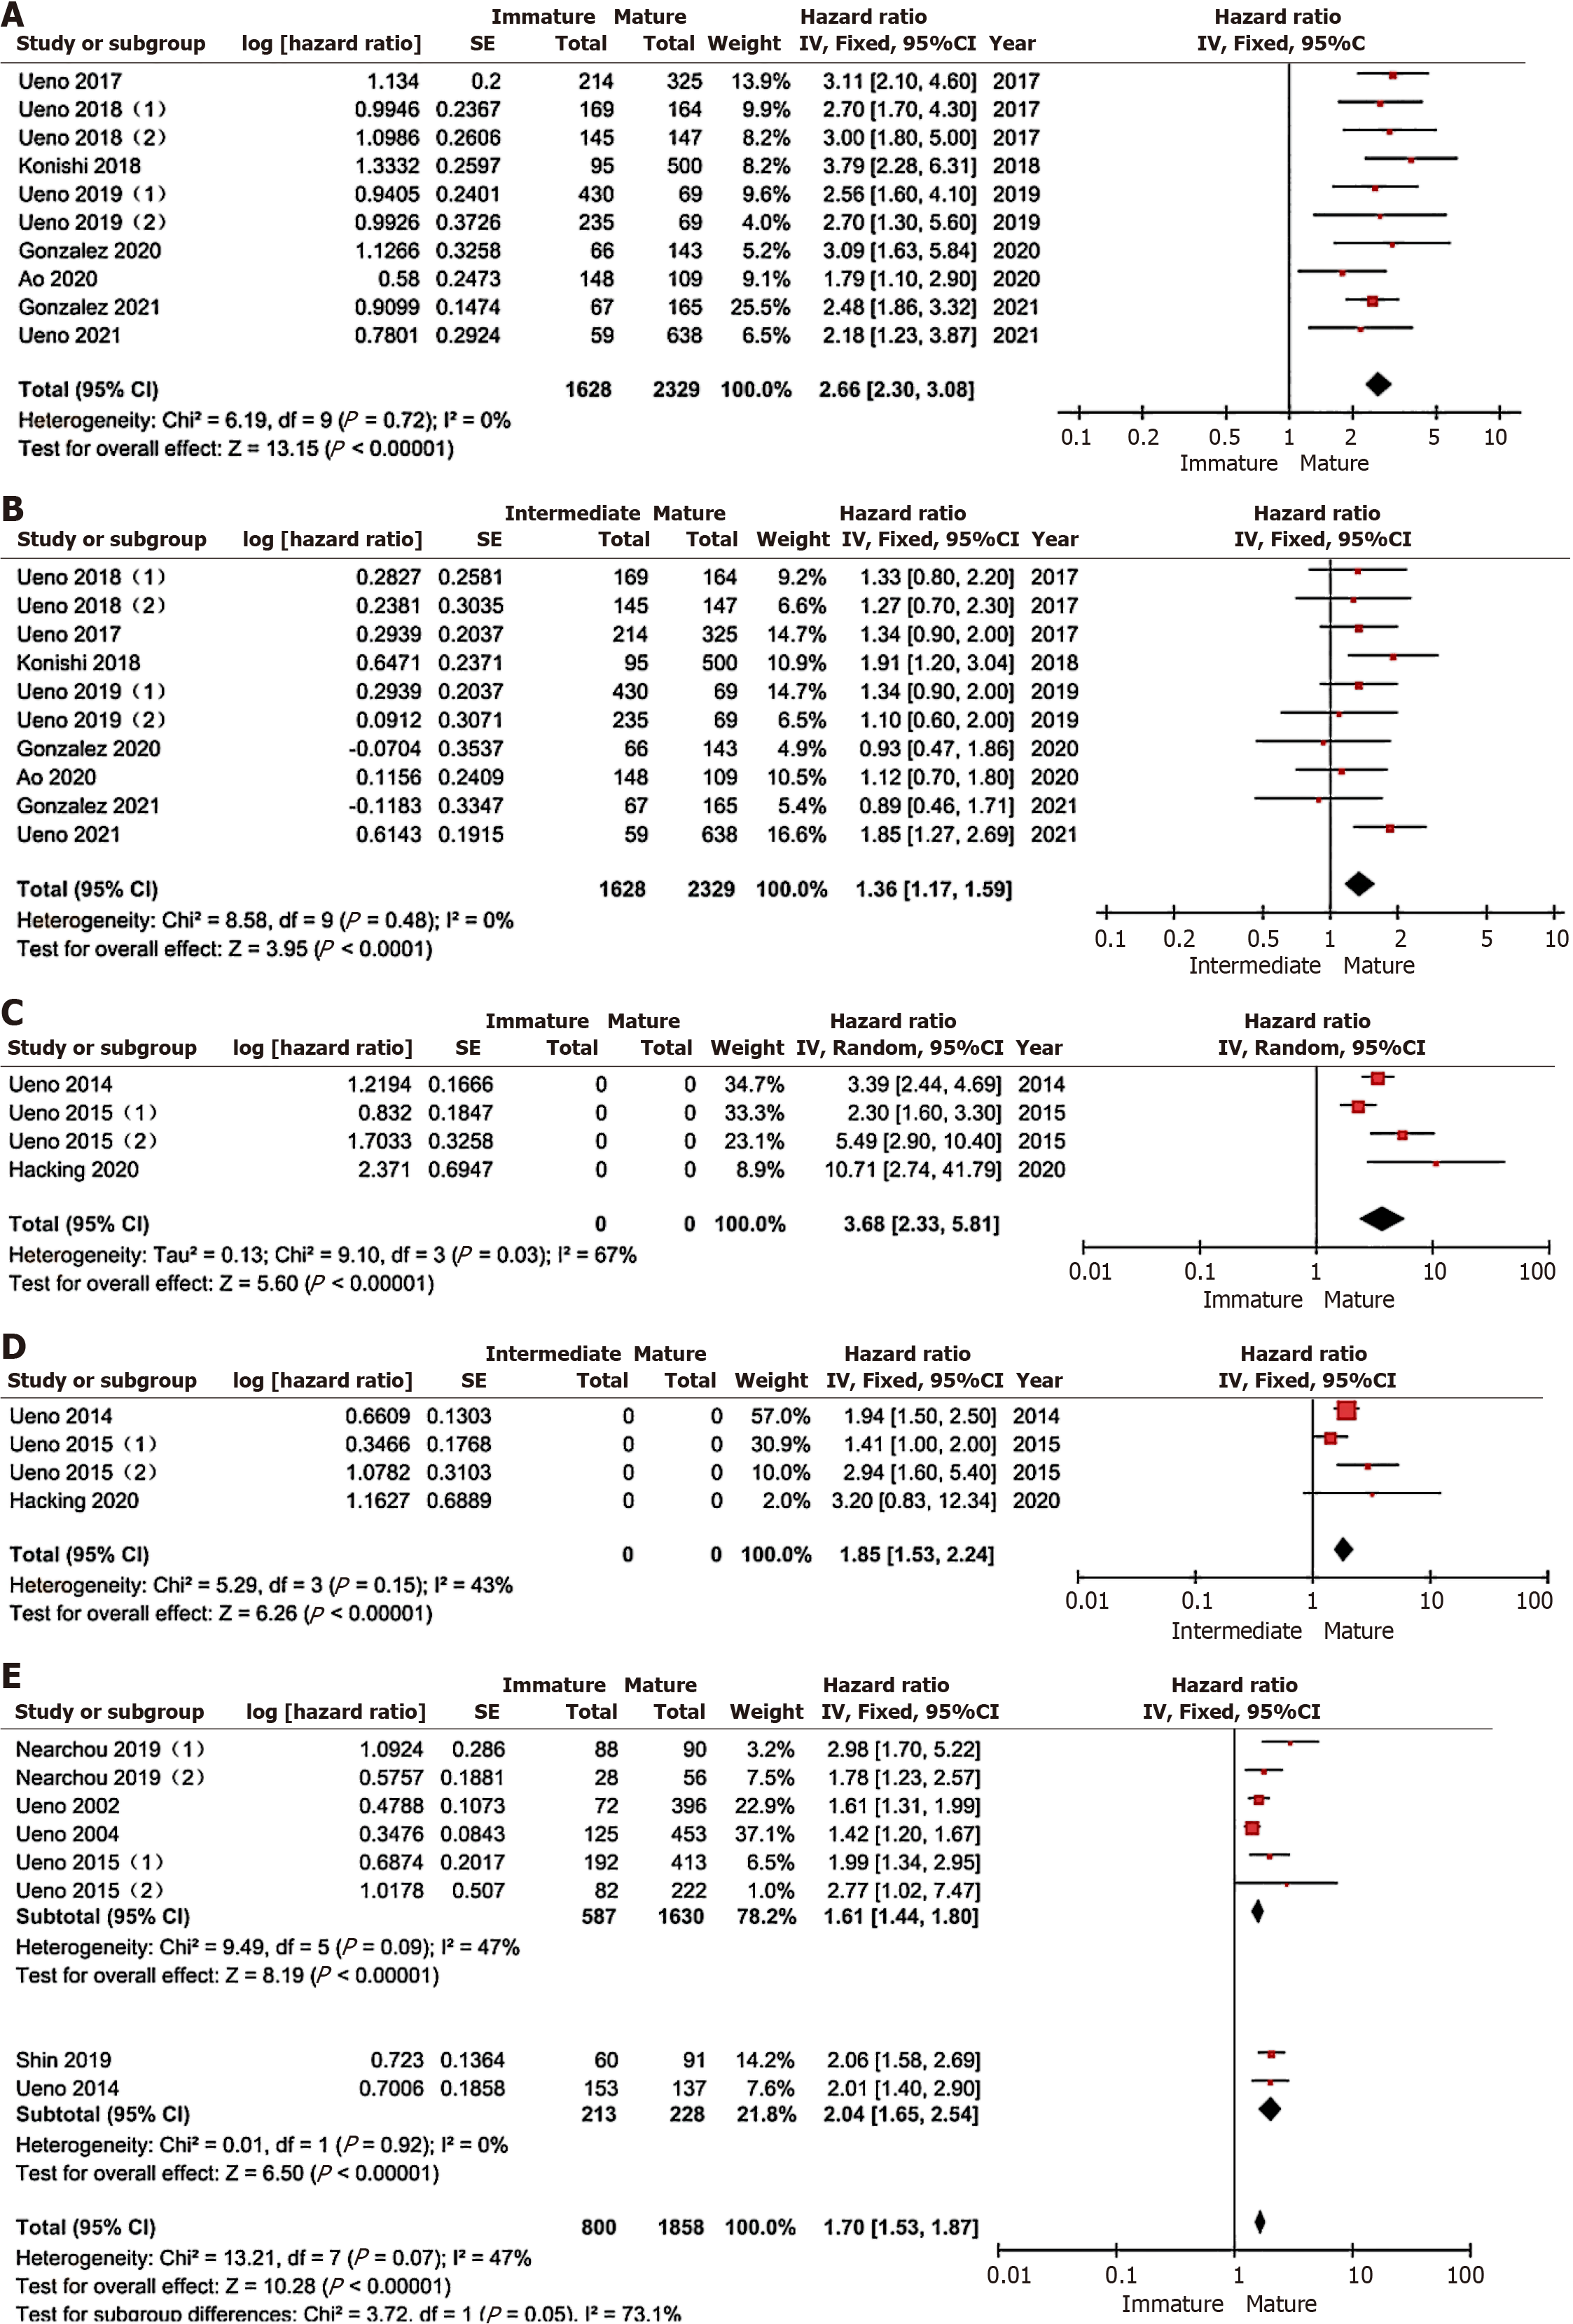
Figure 3 Results of meta-analysis between patients with immature interstitial tumor and those with maure tumor.
A: Results of meta-analysis comparing relapse-free survival rate between patients with immature interstitial tumor and those with mature tumor; B: Results of meta-analysis comparing relapse-free survival rate between the intermediate tumor stromal group and the mature tumor group; C: Results of meta-analysis comparing disease-free survival rate between patients with immature tumor stroma and those with mature tumor; D: Results of meta-analysis comparing disease-free survival rate between patients with intermediate tumor stromal type and mature tumor group; E: Results of meta-analysis comparing the overall survival rate of patients with immature and mature tumors.
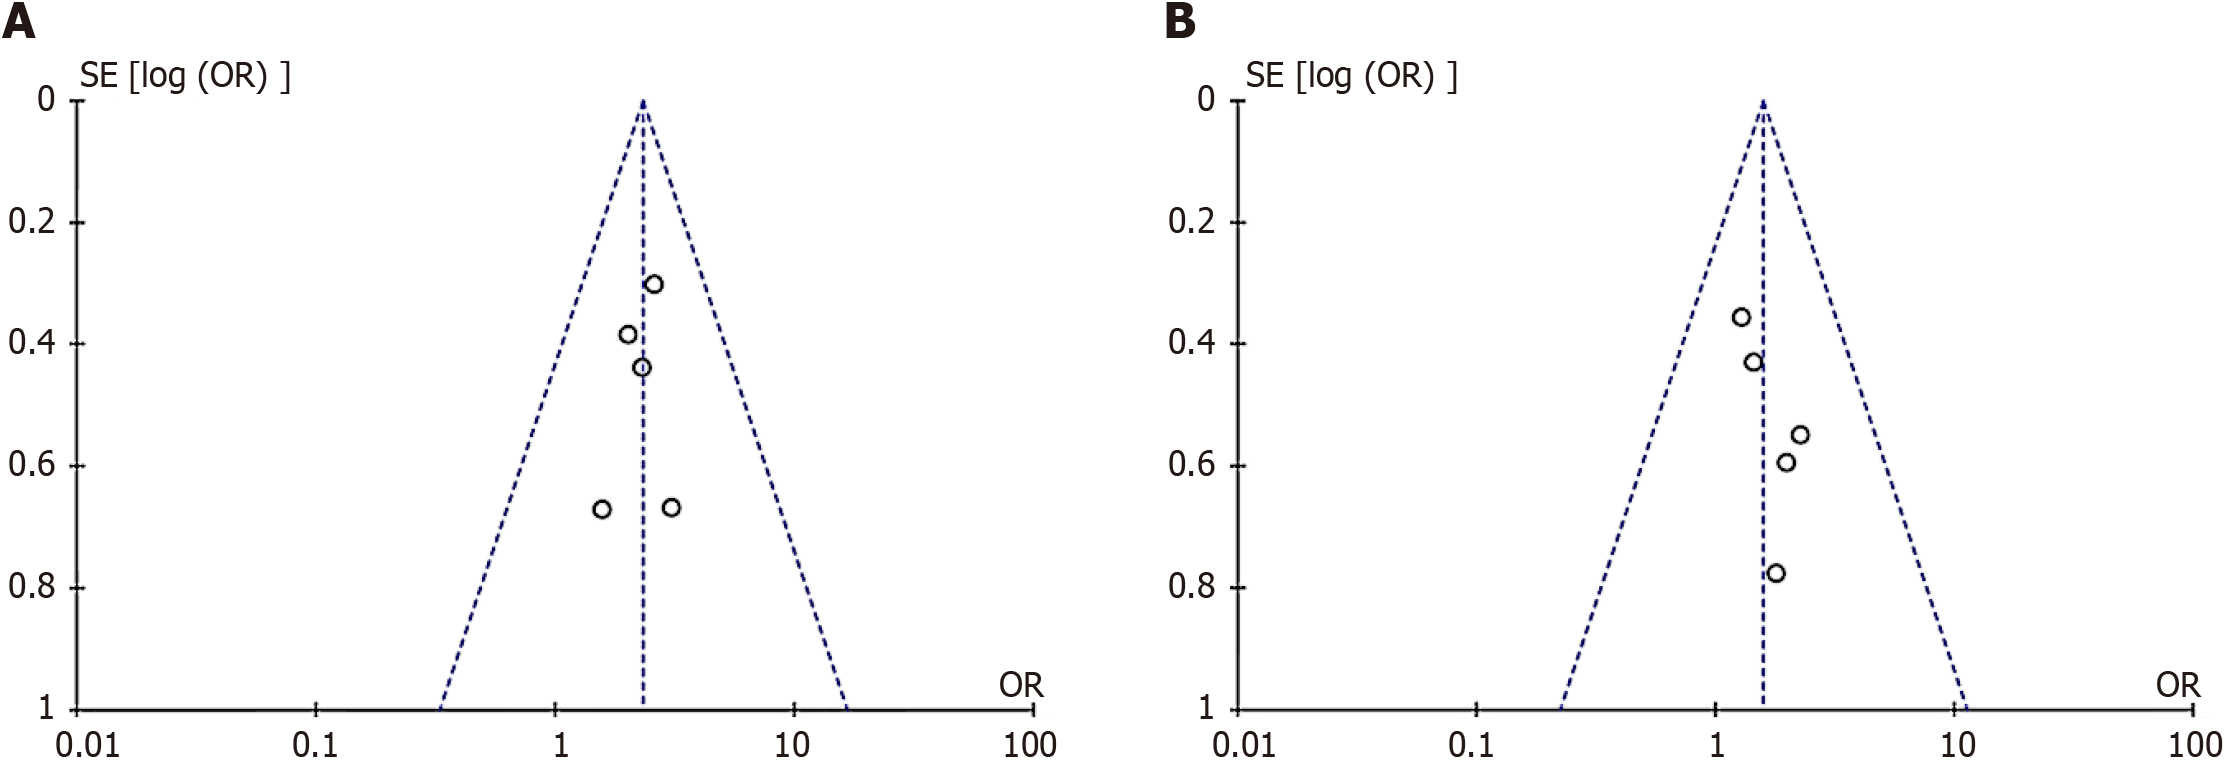
Figure 4 Funnel plot of literature publication bias.
A: Funnel plot of publication bias in disease-free survival rate; B: Funnel plot of publication bias in overall survival rate.
- Citation: Liu ZJ, Zhang XW, Liu QQ, Wang SZ. Correlation analysis of interstitial maturity and prognosis of colorectal cancer: Meta-analysis. World J Gastrointest Oncol 2024; 16(6): 2816-2825
- URL: https://www.wjgnet.com/1948-5204/full/v16/i6/2816.htm
- DOI: https://dx.doi.org/10.4251/wjgo.v16.i6.2816


