Copyright
©The Author(s) 2024.
World J Gastrointest Oncol. Jun 15, 2024; 16(6): 2683-2696
Published online Jun 15, 2024. doi: 10.4251/wjgo.v16.i6.2683
Published online Jun 15, 2024. doi: 10.4251/wjgo.v16.i6.2683
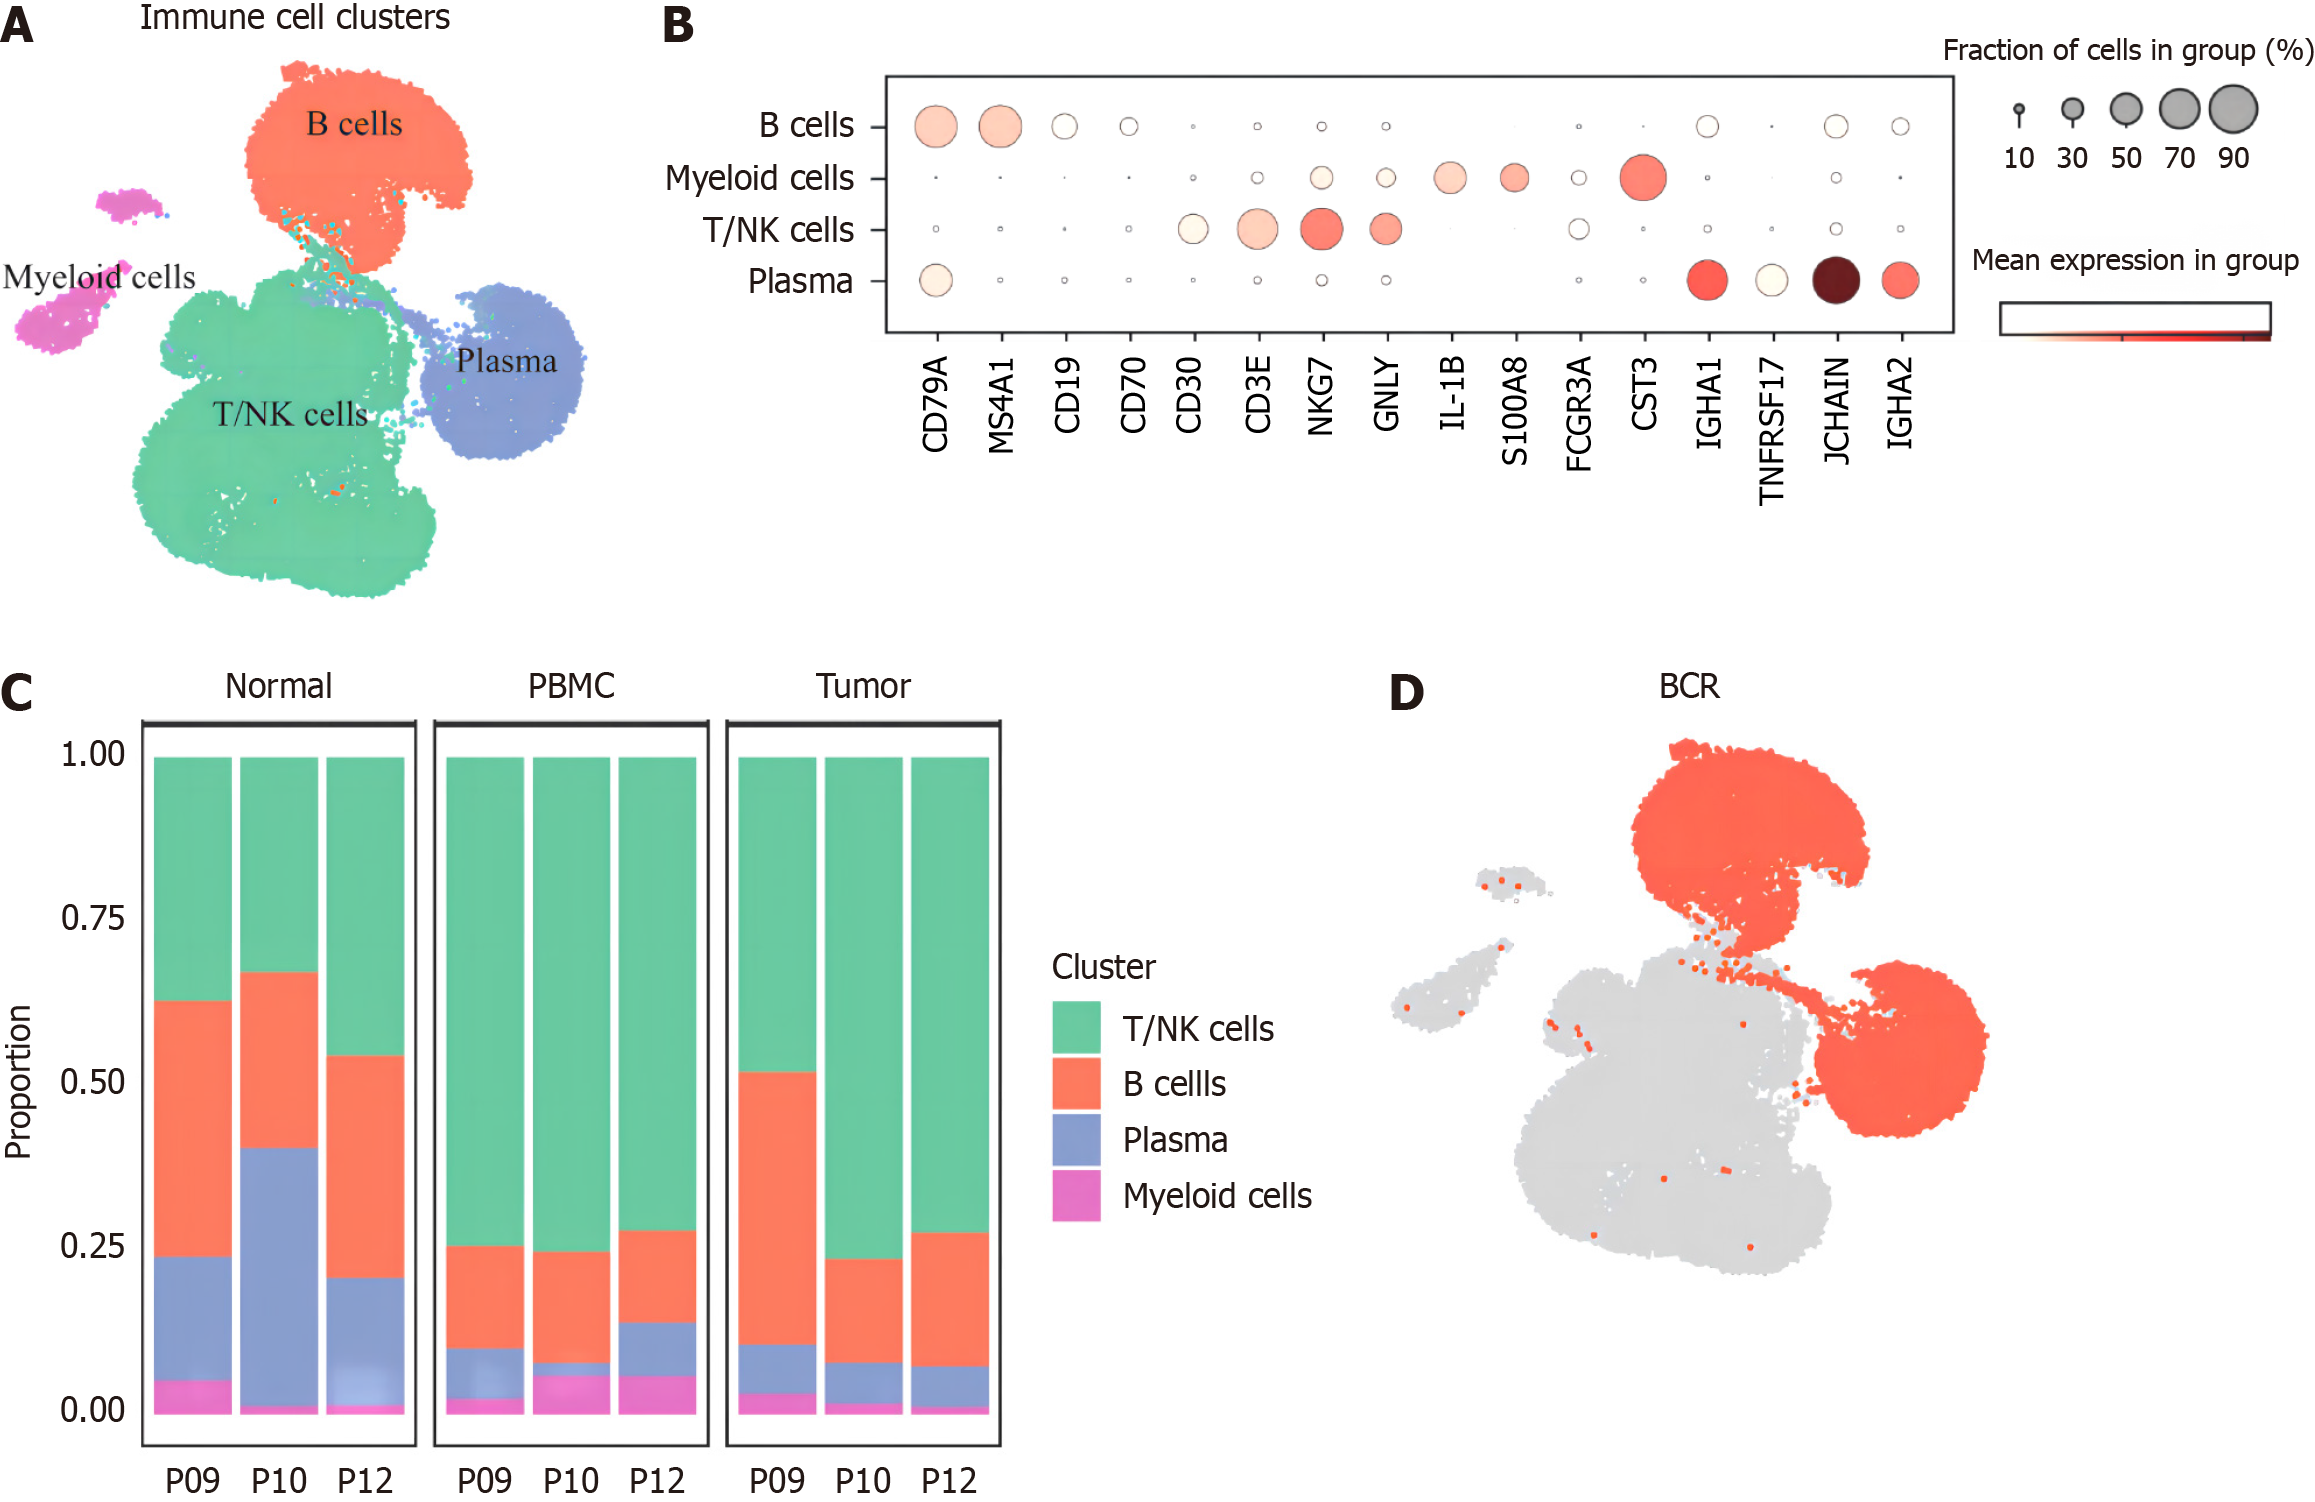
Figure 1 Transcriptome map of main immune cells.
A: Distribution of main immune cell clusters; B: Marker genes' expression of main clusters; C: Cluster proportion among patients and samples; D: Total collected 88 04 B cells for paired B cell anti receptor library. BCR: B cell anti receptor library.
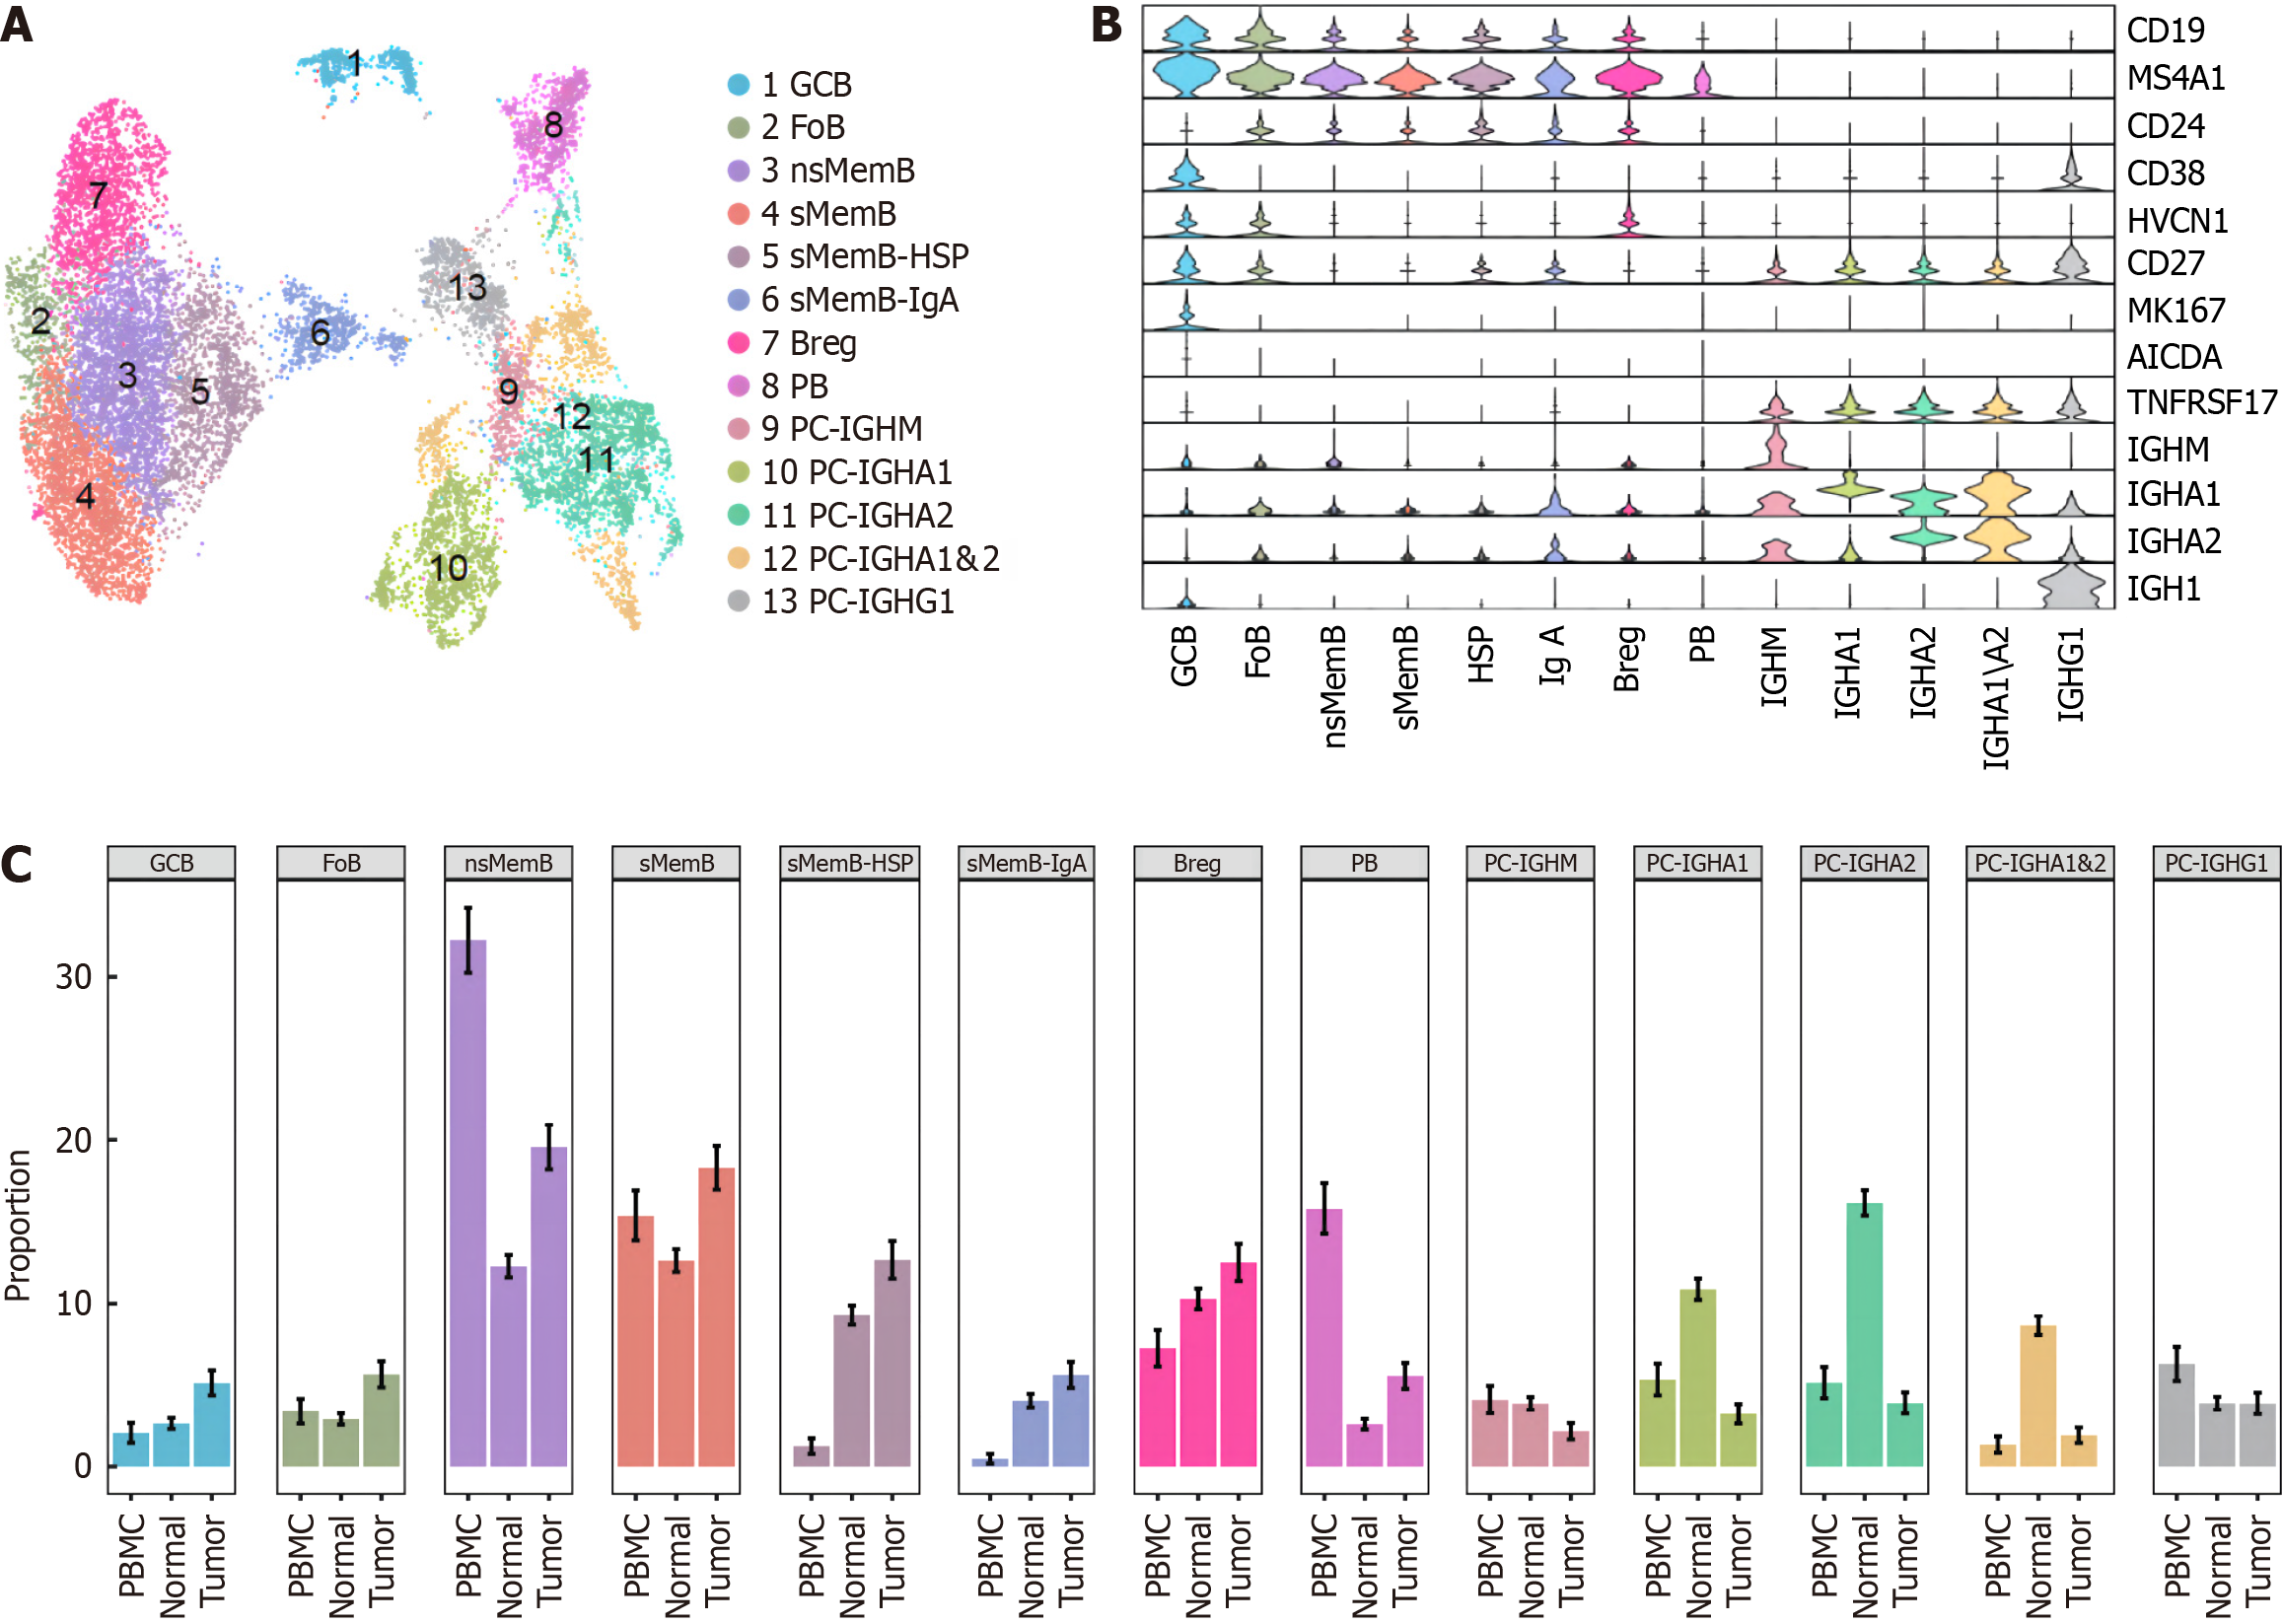
Figure 2 Atlas of B cell subclusters in colorectal cancer.
A: Distribution of 13 B cell subclusters; B: Marker genes' expression of subgroups; C: Proportion of B cell subclusters among peripheral blood mononuclear cells, normal and tumor samples.
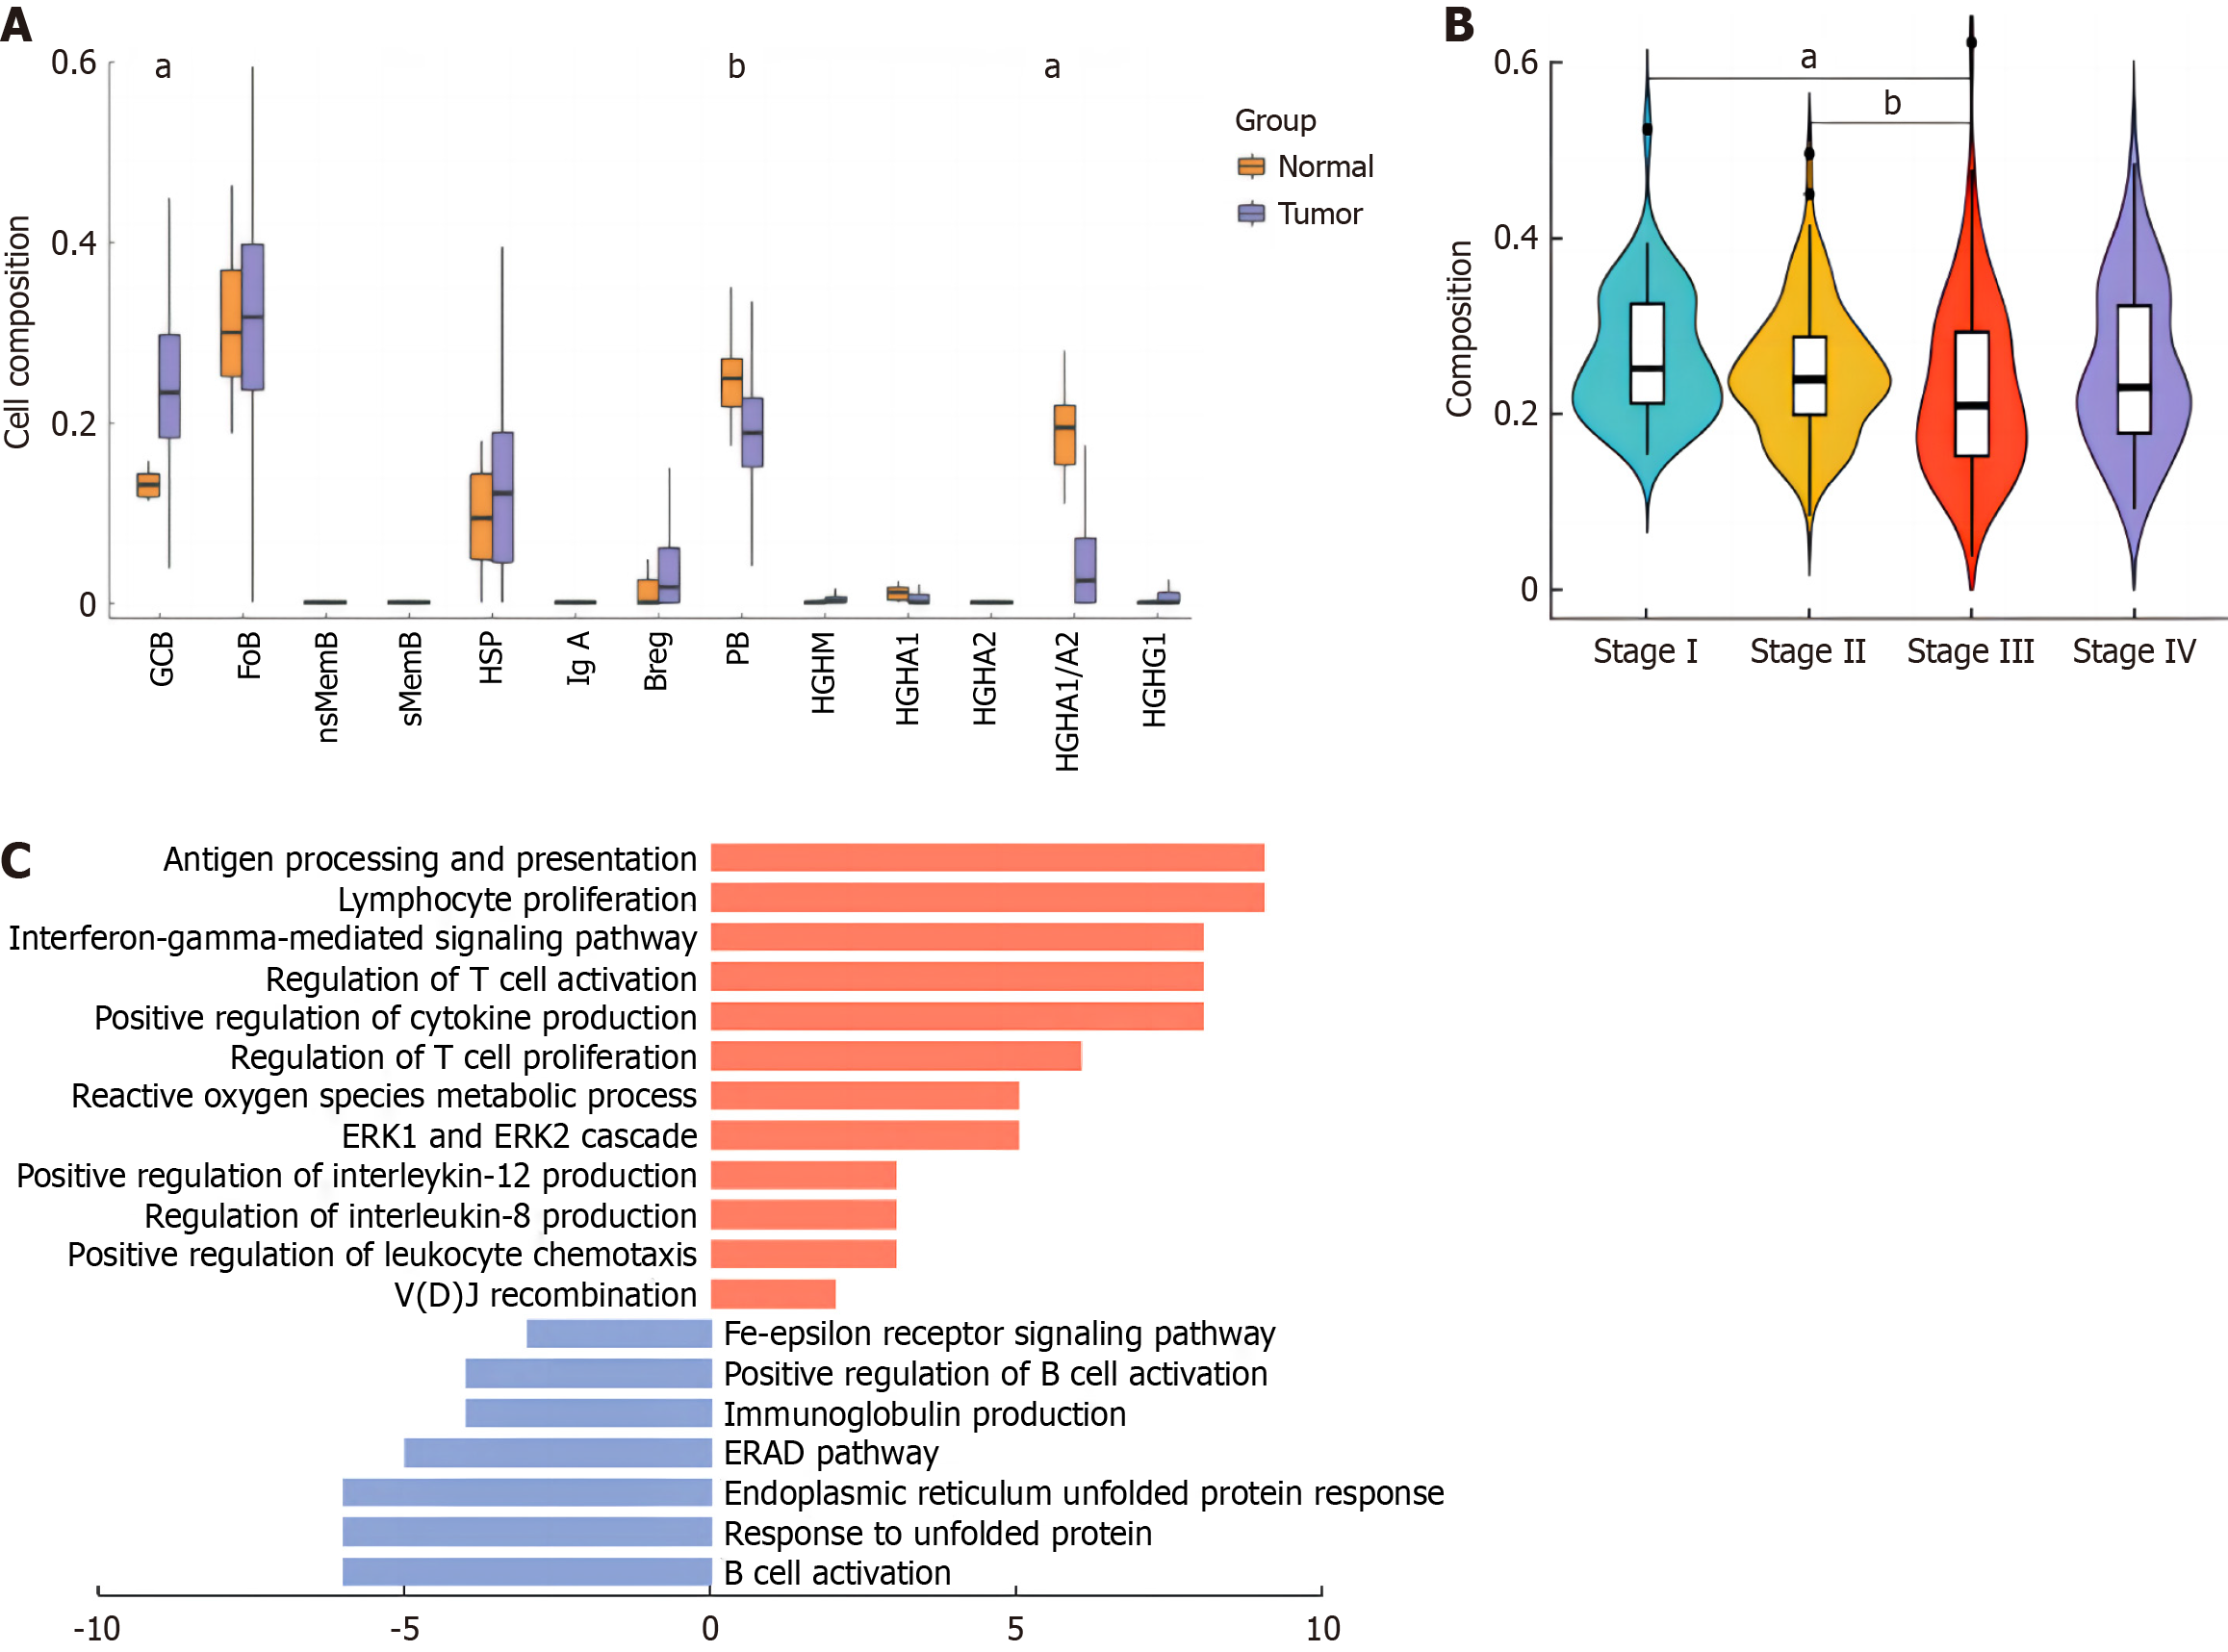
Figure 3 Composition of B cell subsets in tumor and normal tissues by The Cancer Genome Atlas colon cancer data profiling.
A: Composition scores of B cell subsets in tumor vs normal tissues of The Cancer Genome Atlas-colon cancer data; B: Germinal center B cell (GCB) composition scores among progressing stages; C: Pathway enrichment analysis of GCB cluster. aP < 0.01; bP < 0.05.
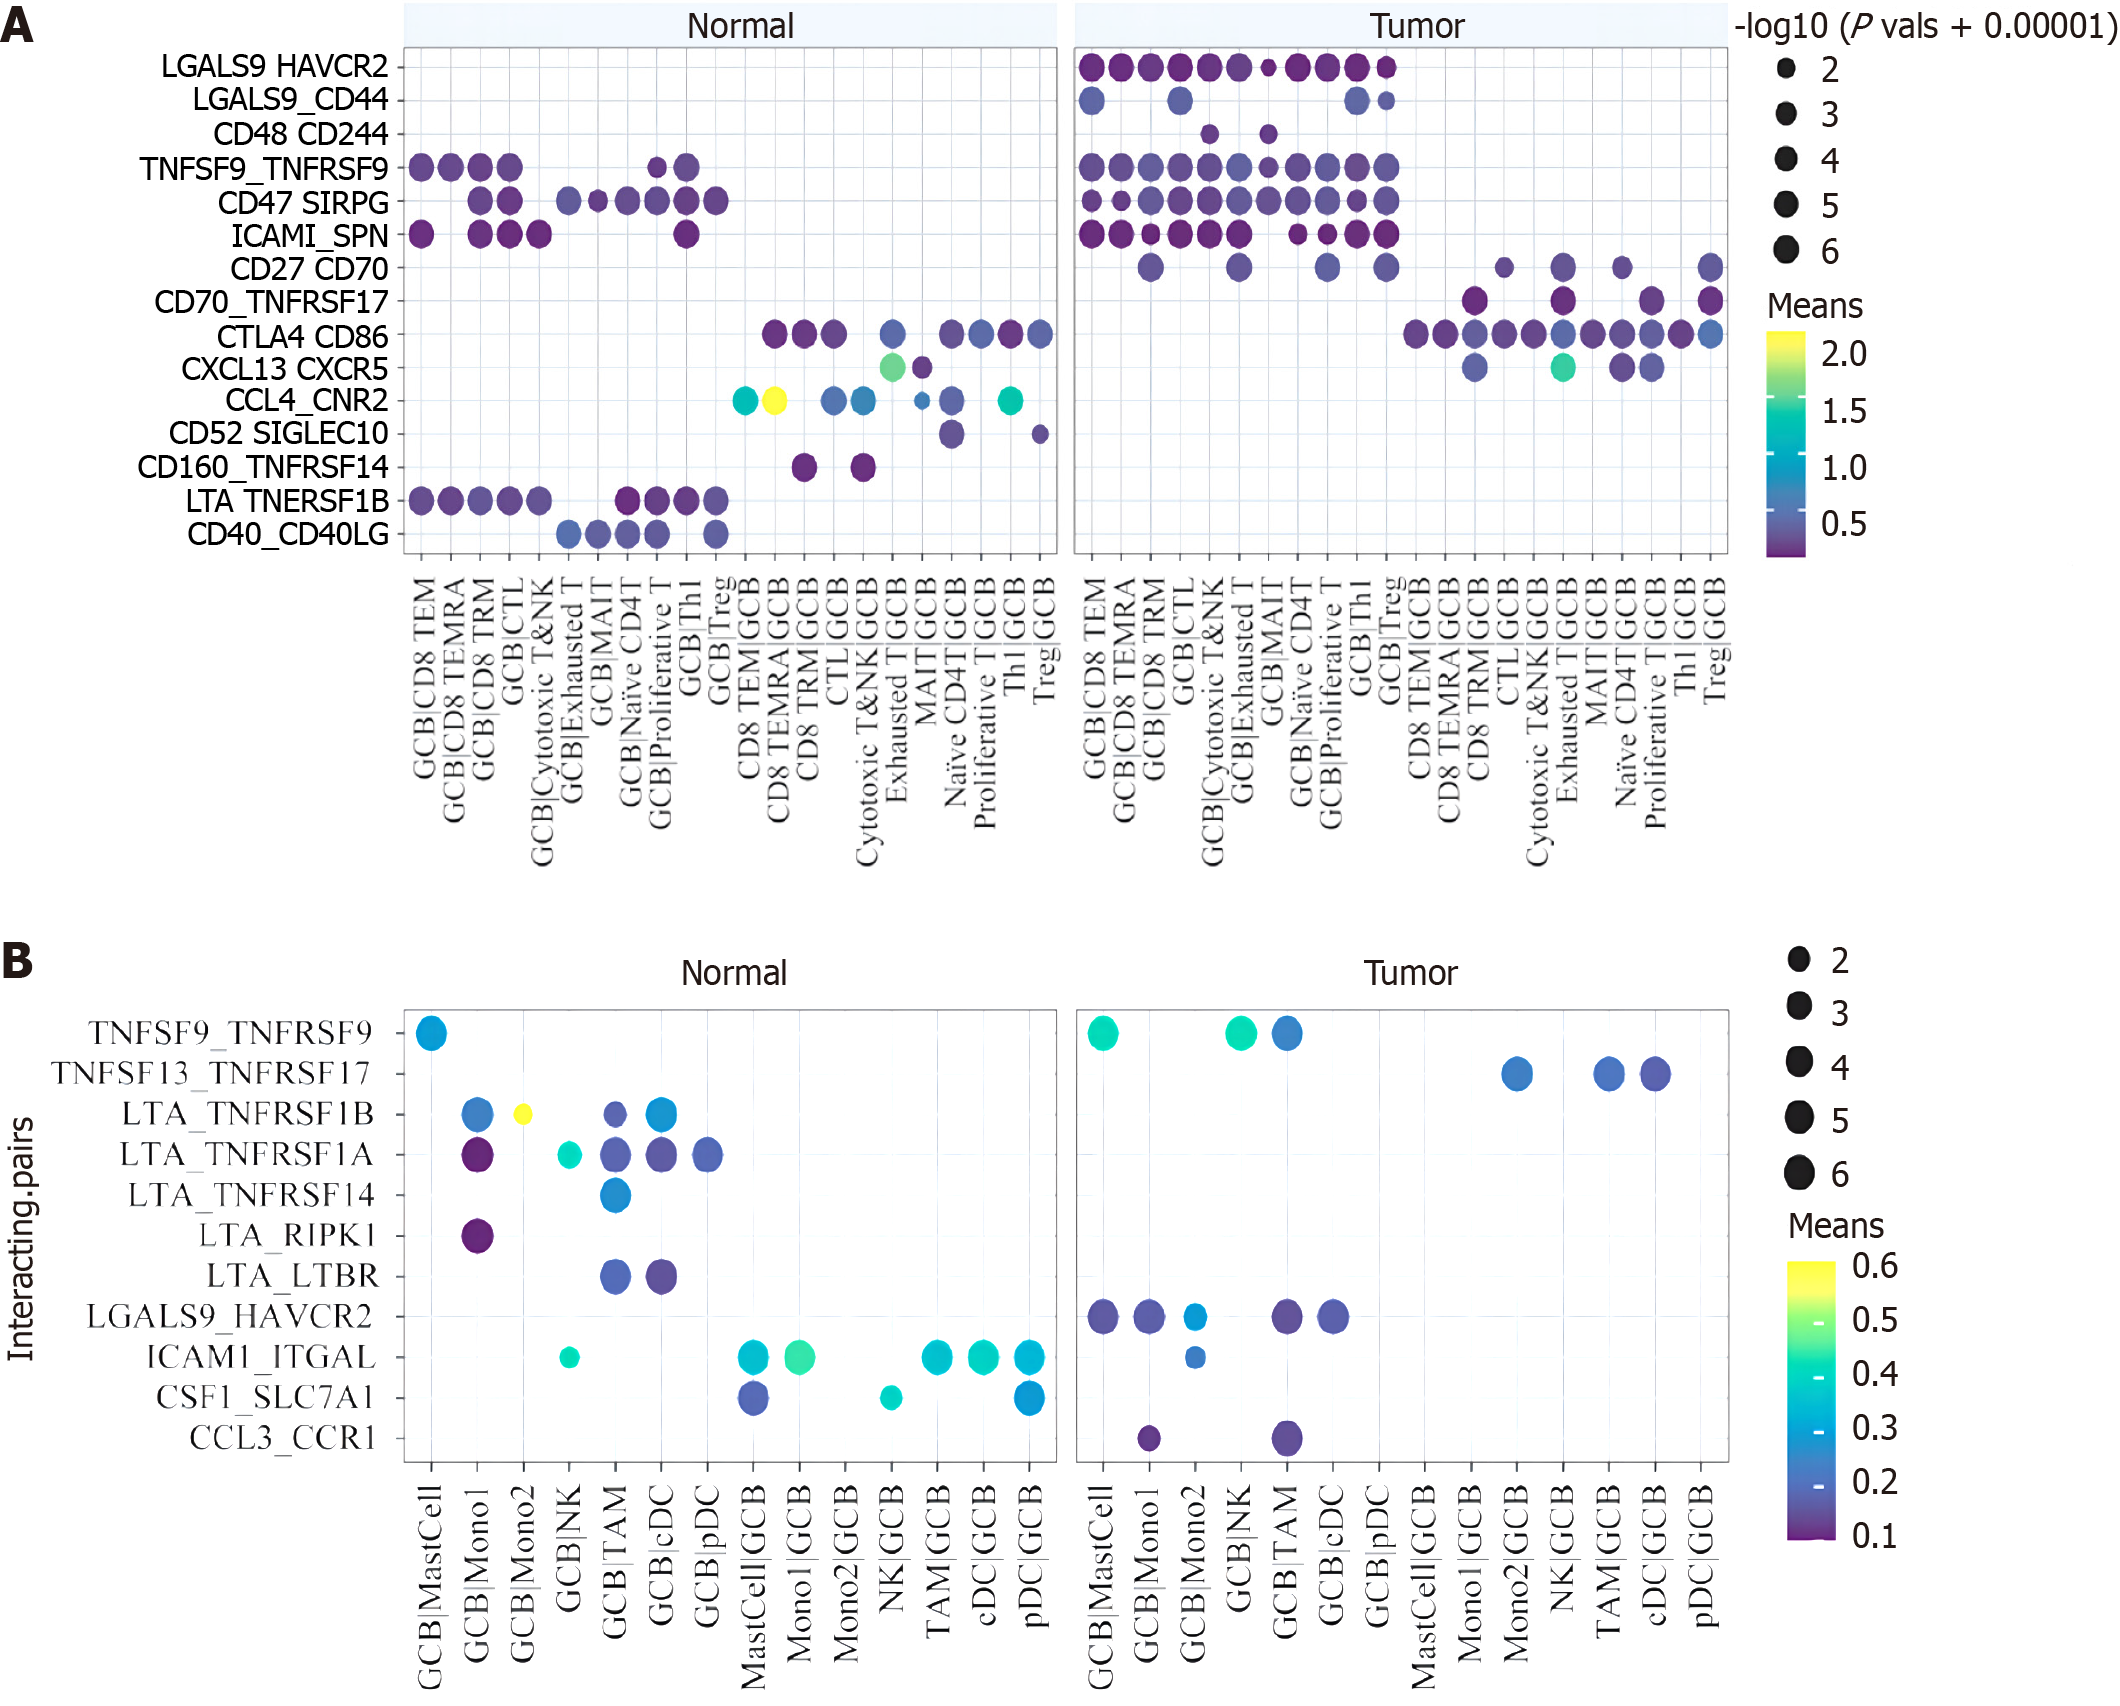
Figure 4 Interecting pairs between B cell subsets with T cells and myeloid cells.
A: Significant protein-protein interaction pairs between B cell subsets and T cell subsets; B: Significant protein-protein interaction pairs between B cell subsets and myeloids subsets.
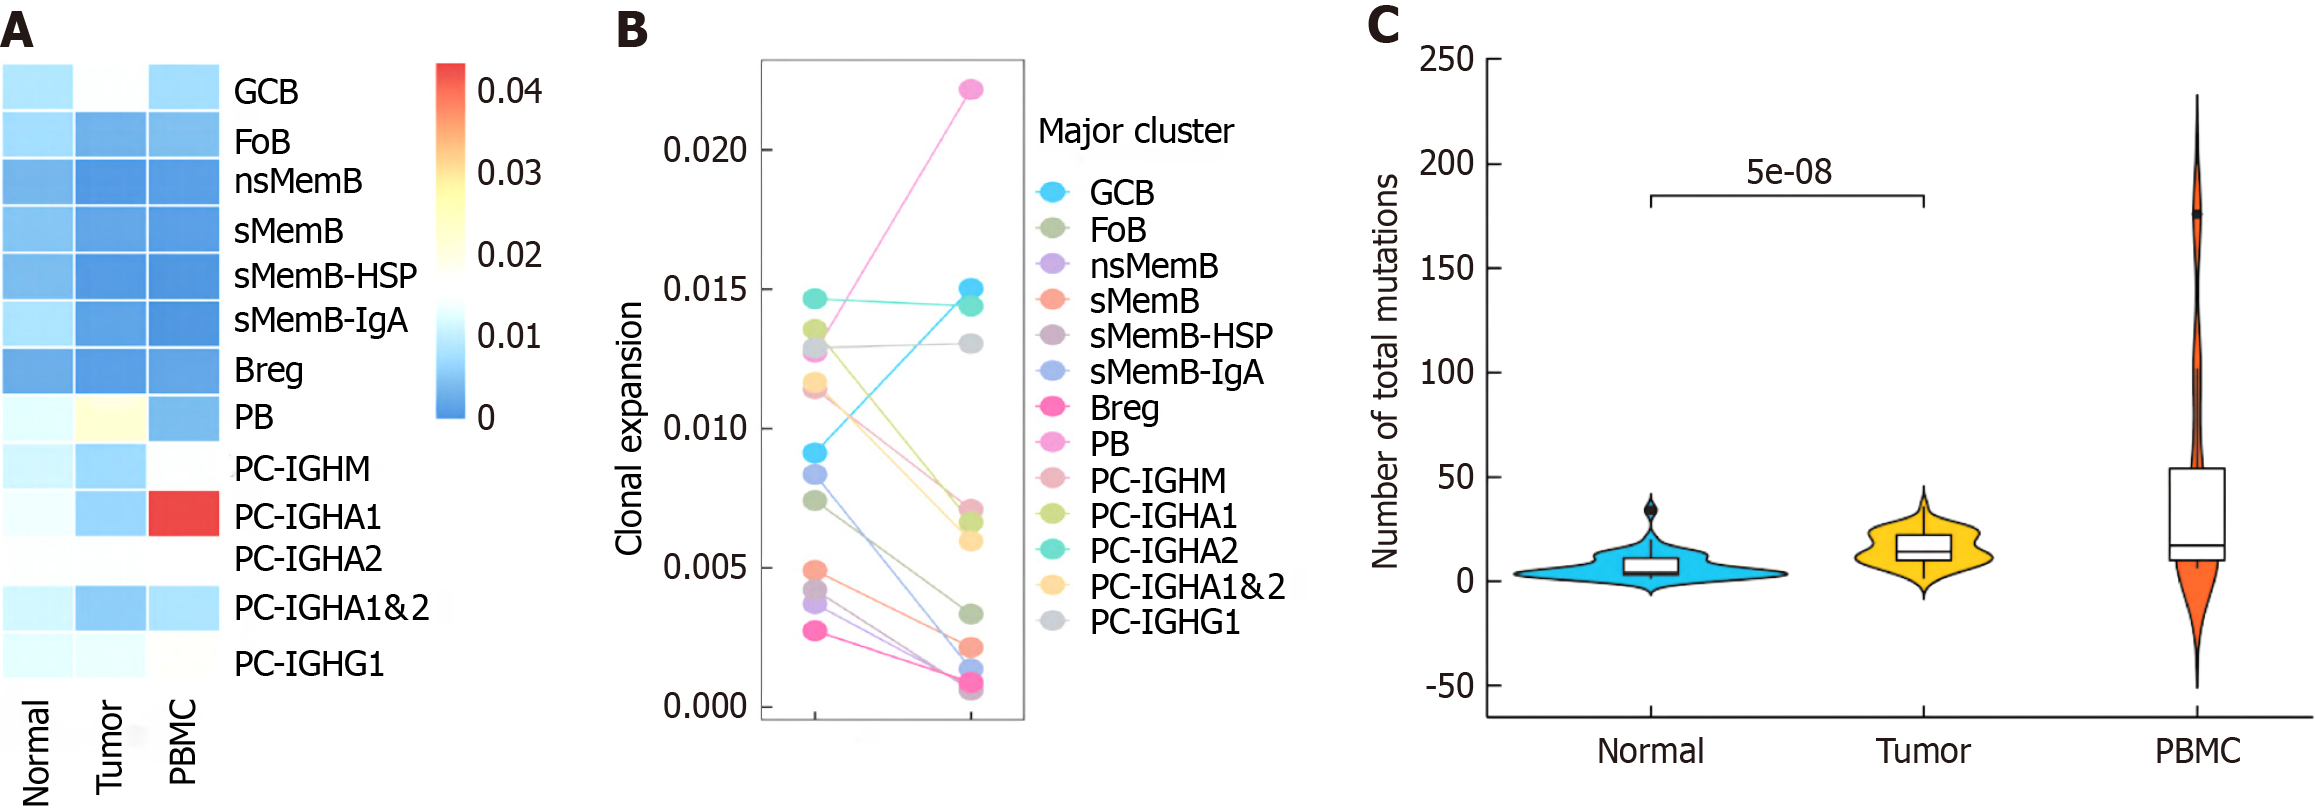
Figure 5 Clonal expansion index of B cell subsets and mutation level of germinal center B cell.
A: Zscored clonal expansion index among three samples; B: Comparsion of clonal expansion between normal and tumor tissues; C: Heavy chain mutation level of germinal center B cell among samples.
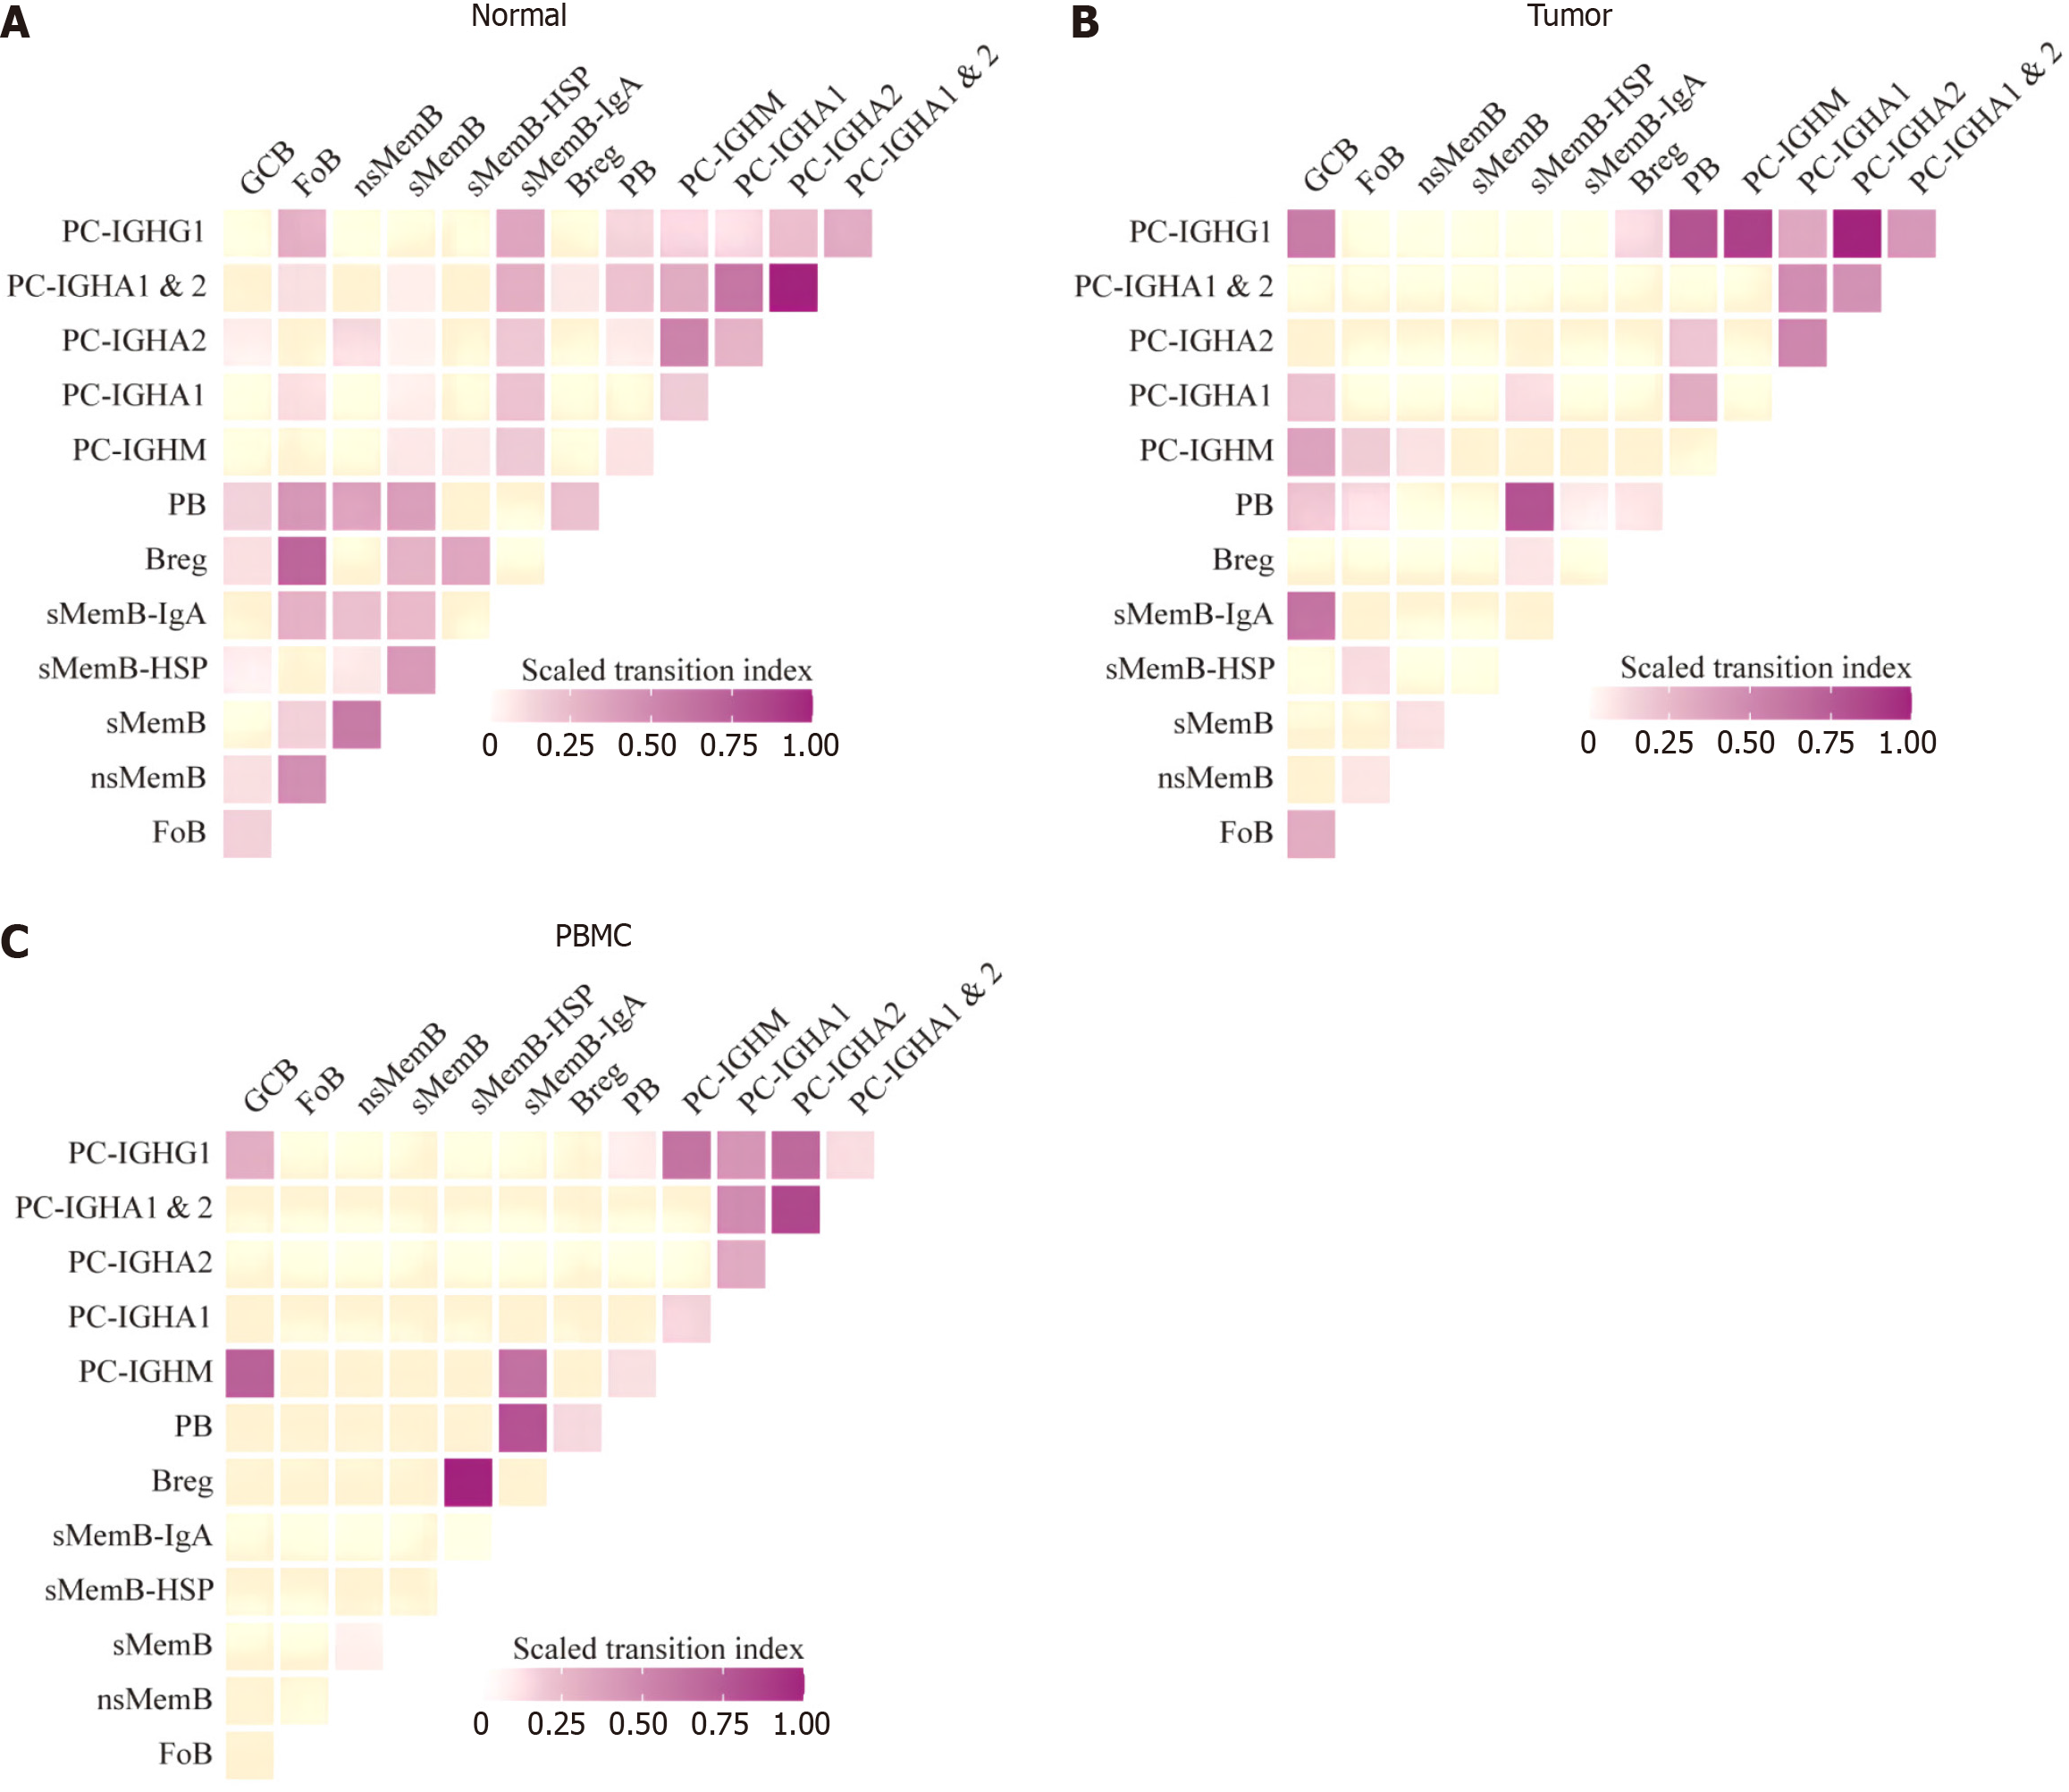
Figure 6 Transition index of B cell subsets.
A: Normal tissue; B: Tunor tissue; C: Peripheral blood mononuclear cell sample.
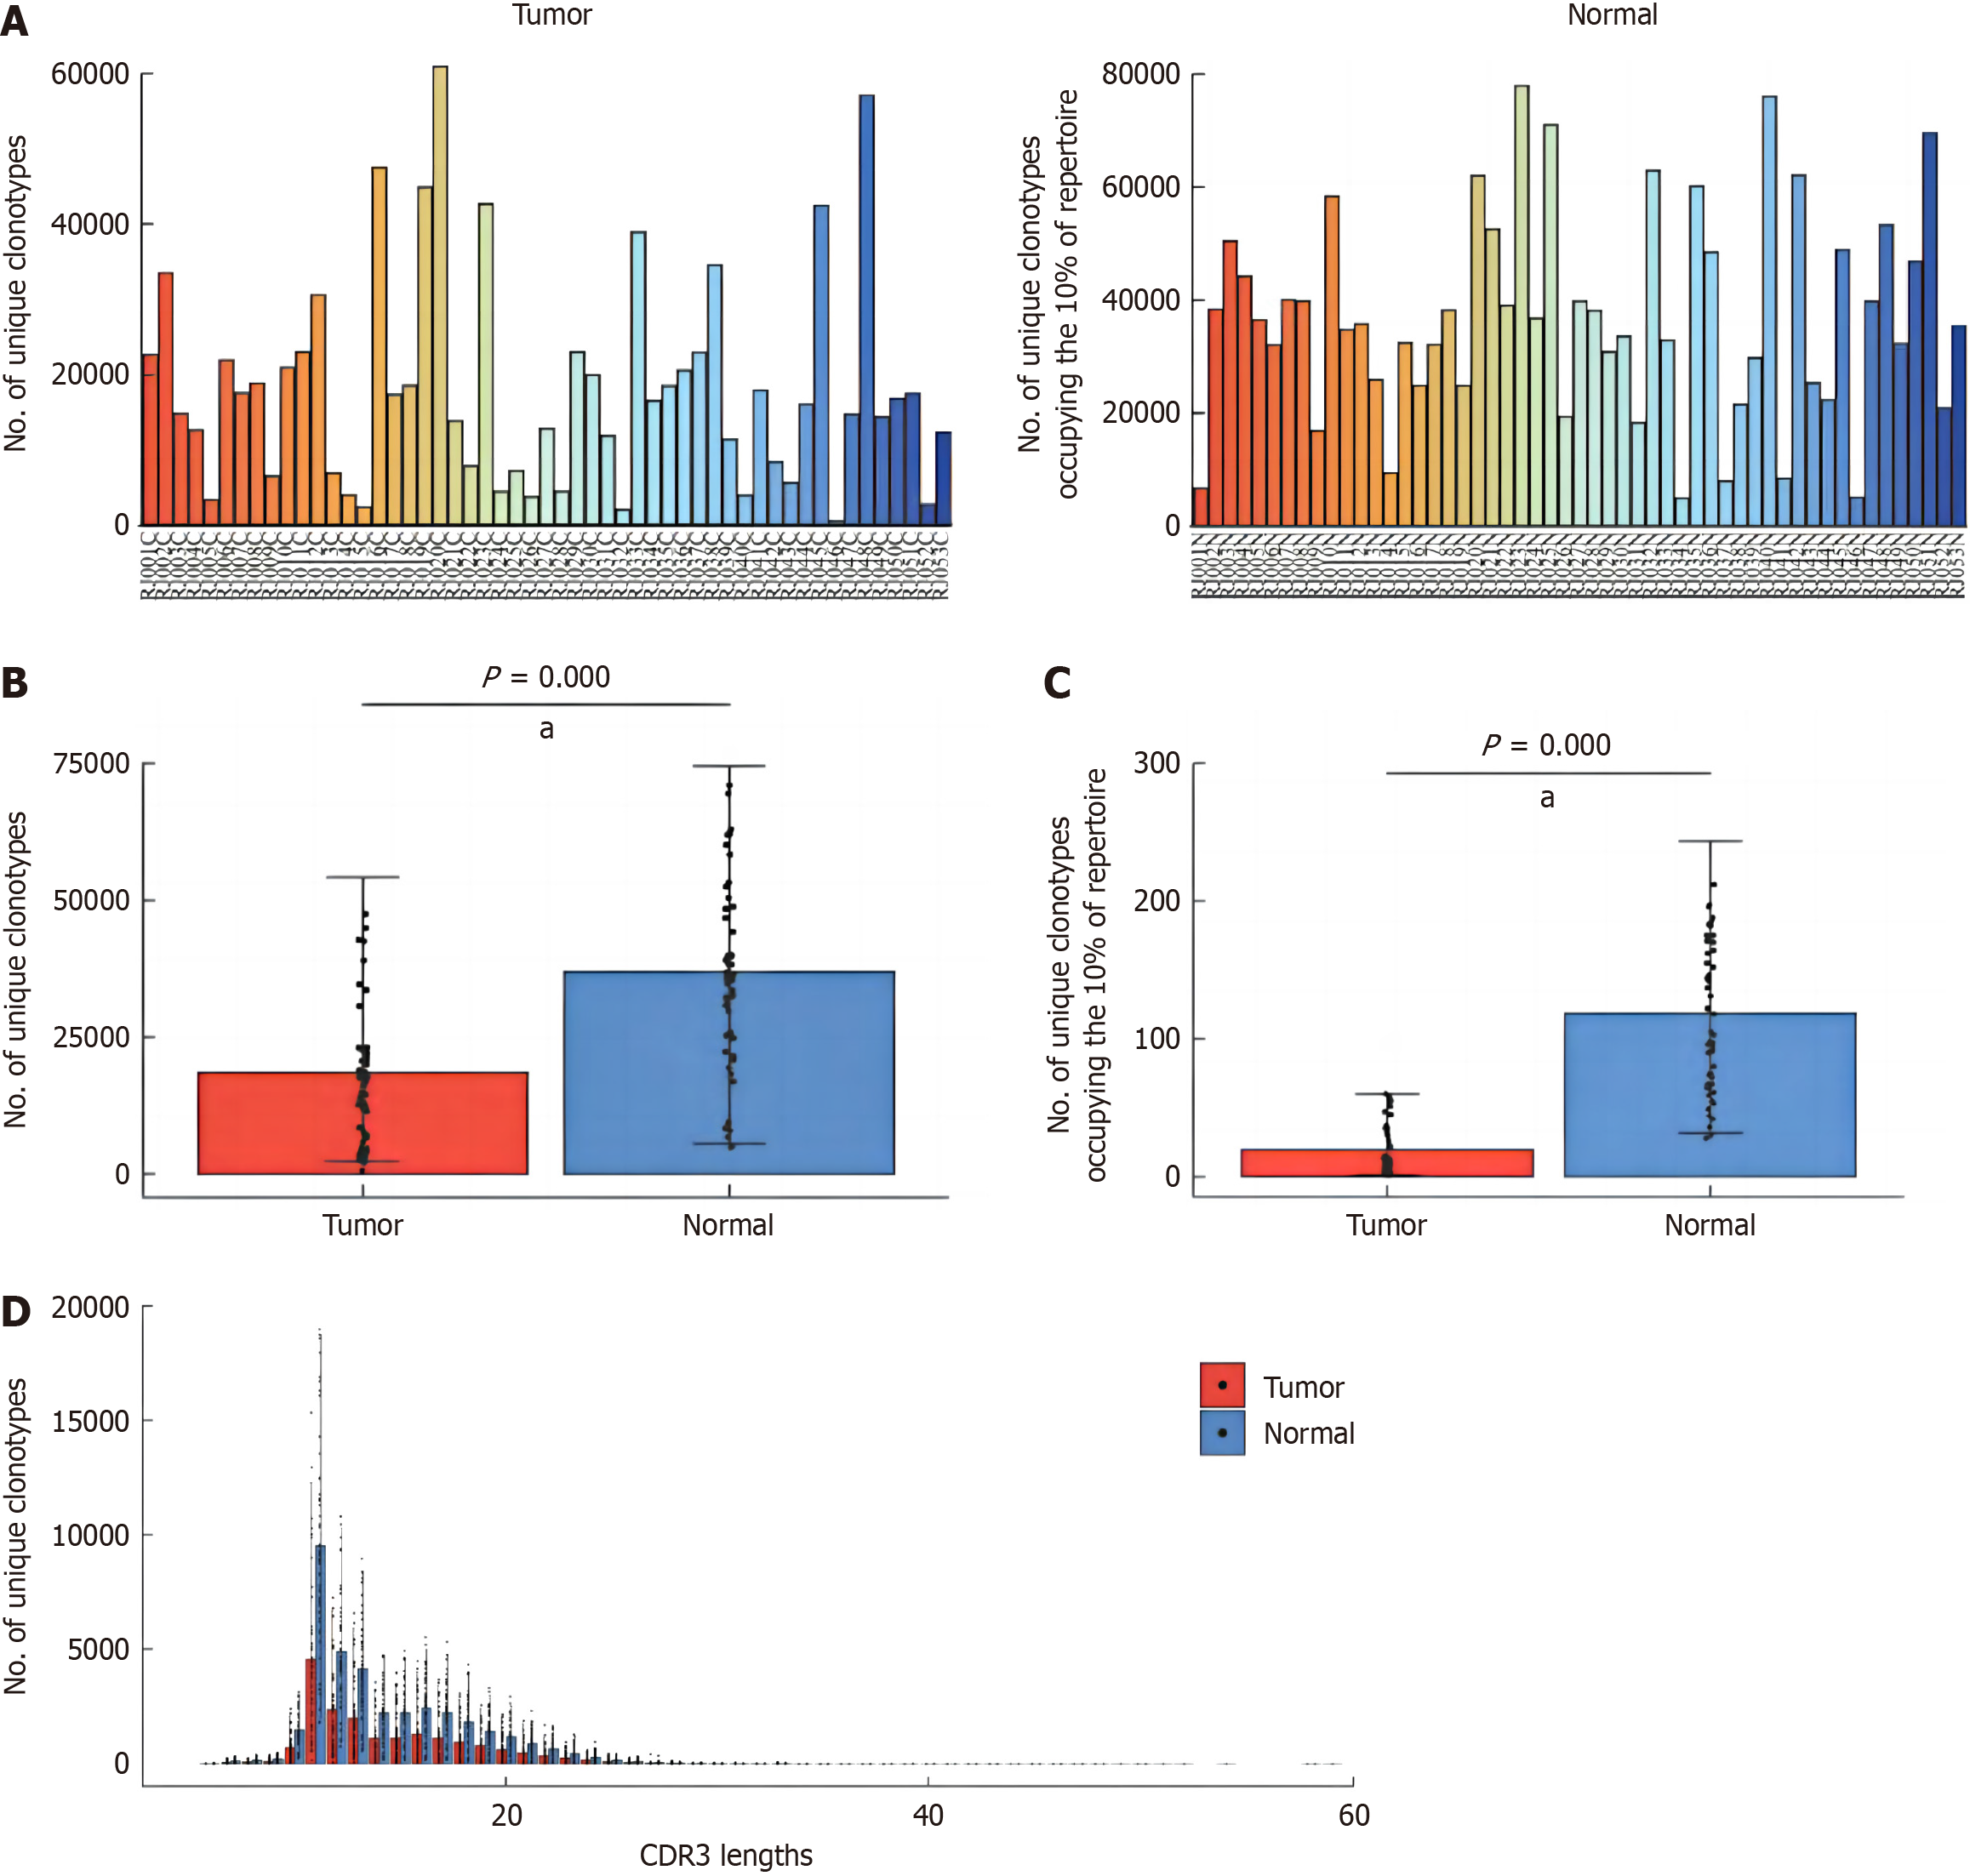
Figure 7 Comparison of the number of T-cell receptor clonotypes between tumor and adjacent normal tissues.
A: Estimation of the number of T-cell receptor (TCR) clonotypes in tumor and adjacent normal tissues; B: Comparison of TCR clonotypes between tumor and adjacent normal tissues; C: Comparison of the number of TCR clonotypes occupying 10% of repertoire between tumor and adjacent normal tissues; D: Comparison of TCR clonotypes with different CDR3 sequence lengths between tumor and adjacent normal tissues. aP < 0.01.
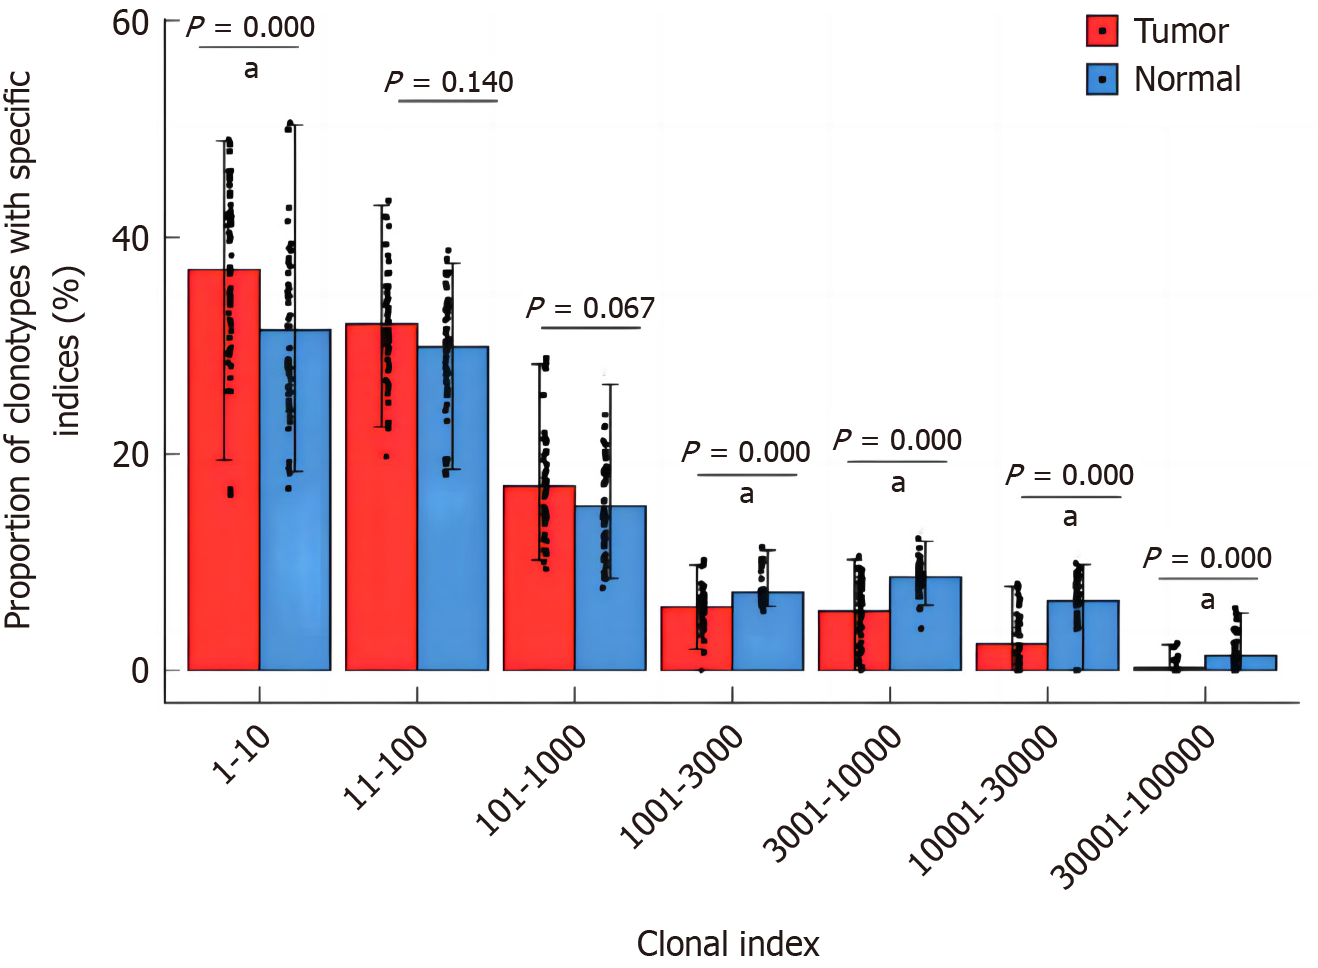
Figure 8 Comparison of proportion of T-cell receptor clonotypes with different amplification levels between tumor and adjacent normal tissues.
aP < 0.01.
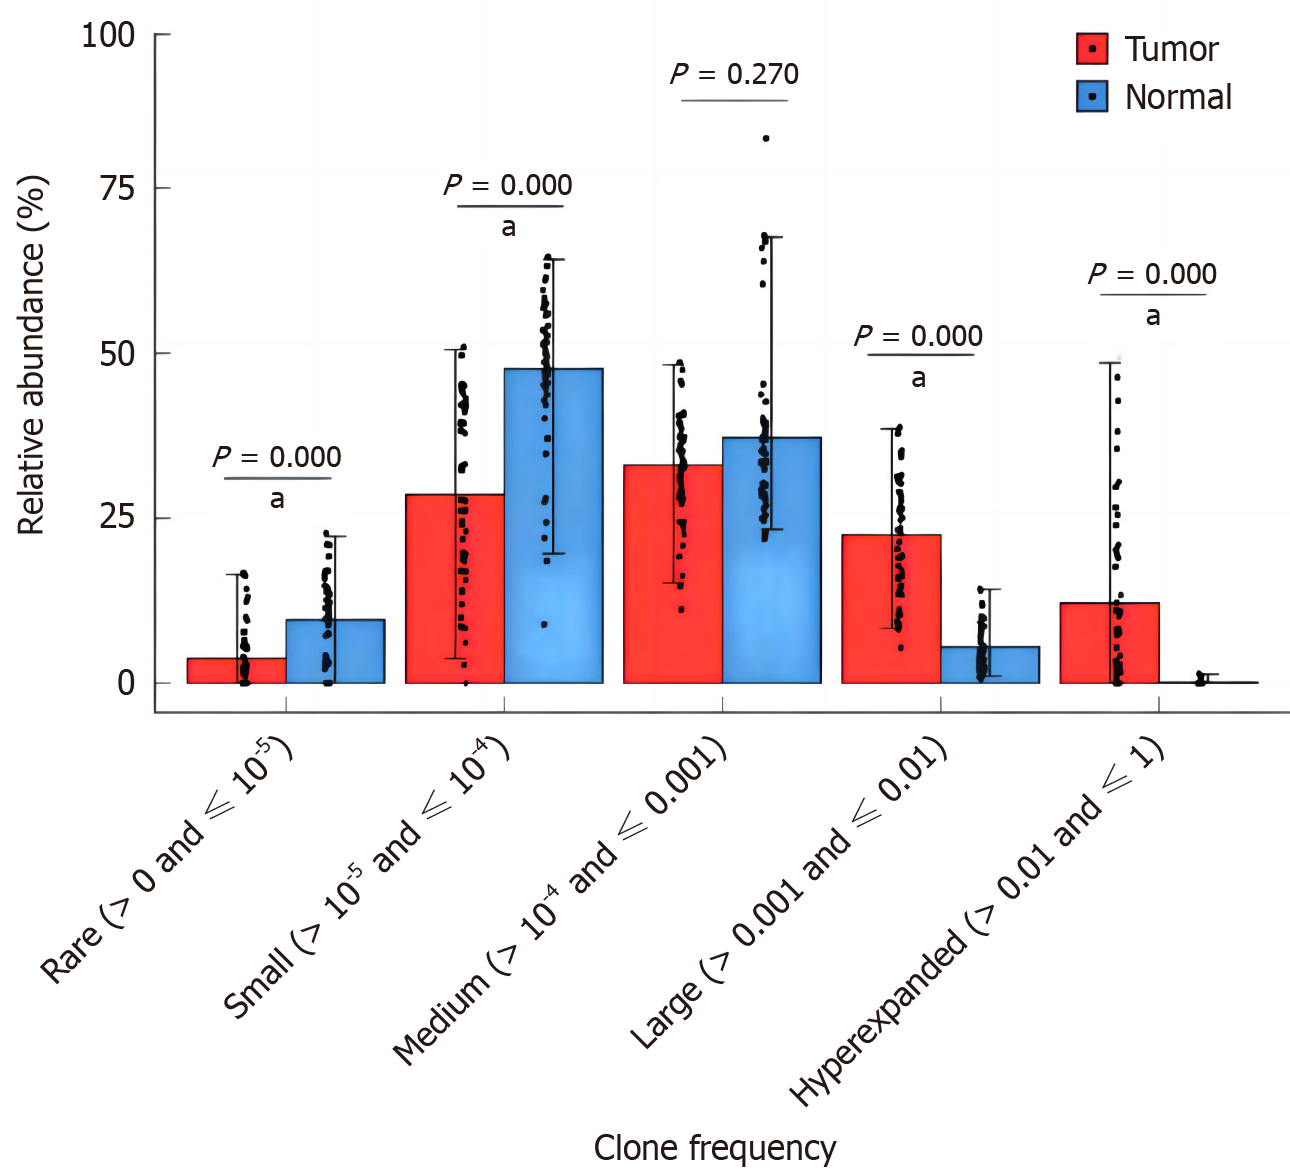
Figure 9 Comparison of relative abundances in different T-cell receptor clonotypes with specific frequencies between tumor and adjacent normal tissues.
aP < 0.01.
- Citation: Zhang JP, Yan BZ, Liu J, Wang W. Action of circulating and infiltrating B cells in the immune microenvironment of colorectal cancer by single-cell sequencing analysis. World J Gastrointest Oncol 2024; 16(6): 2683-2696
- URL: https://www.wjgnet.com/1948-5204/full/v16/i6/2683.htm
- DOI: https://dx.doi.org/10.4251/wjgo.v16.i6.2683


