Copyright
©The Author(s) 2024.
World J Gastrointest Oncol. Jun 15, 2024; 16(6): 2673-2682
Published online Jun 15, 2024. doi: 10.4251/wjgo.v16.i6.2673
Published online Jun 15, 2024. doi: 10.4251/wjgo.v16.i6.2673
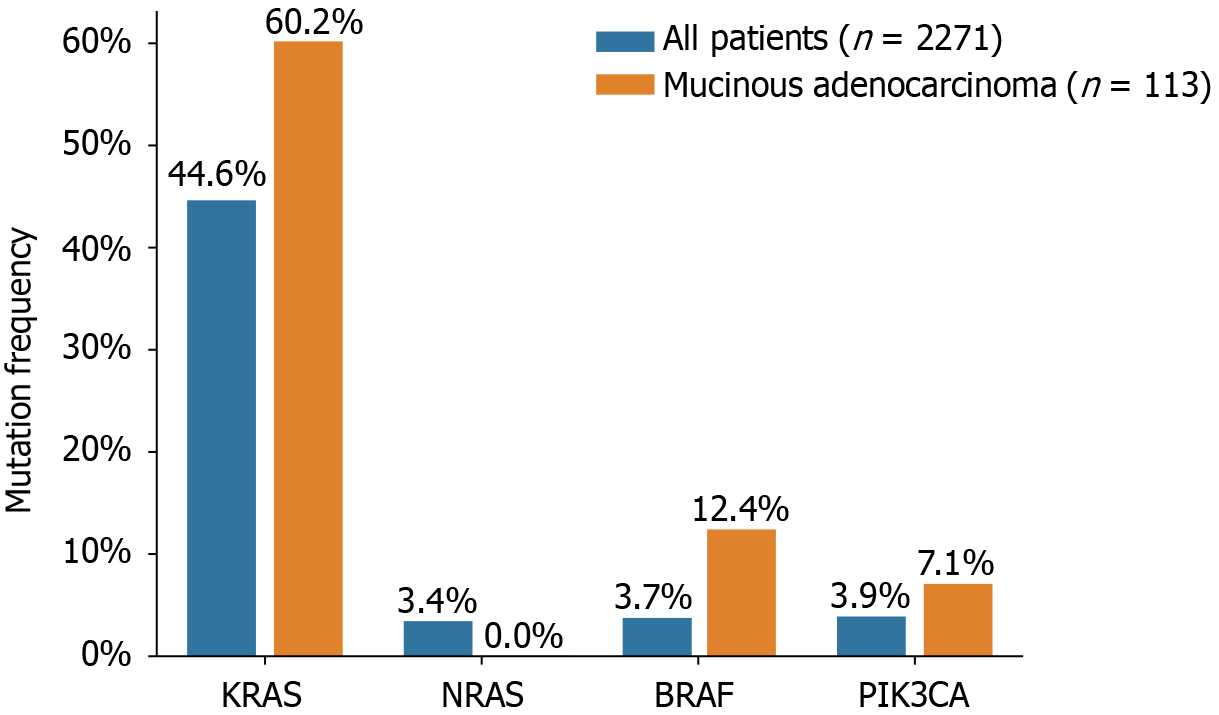
Figure 1 KRAS/NRAS/BRAF/PIK3CA mutation frequency.
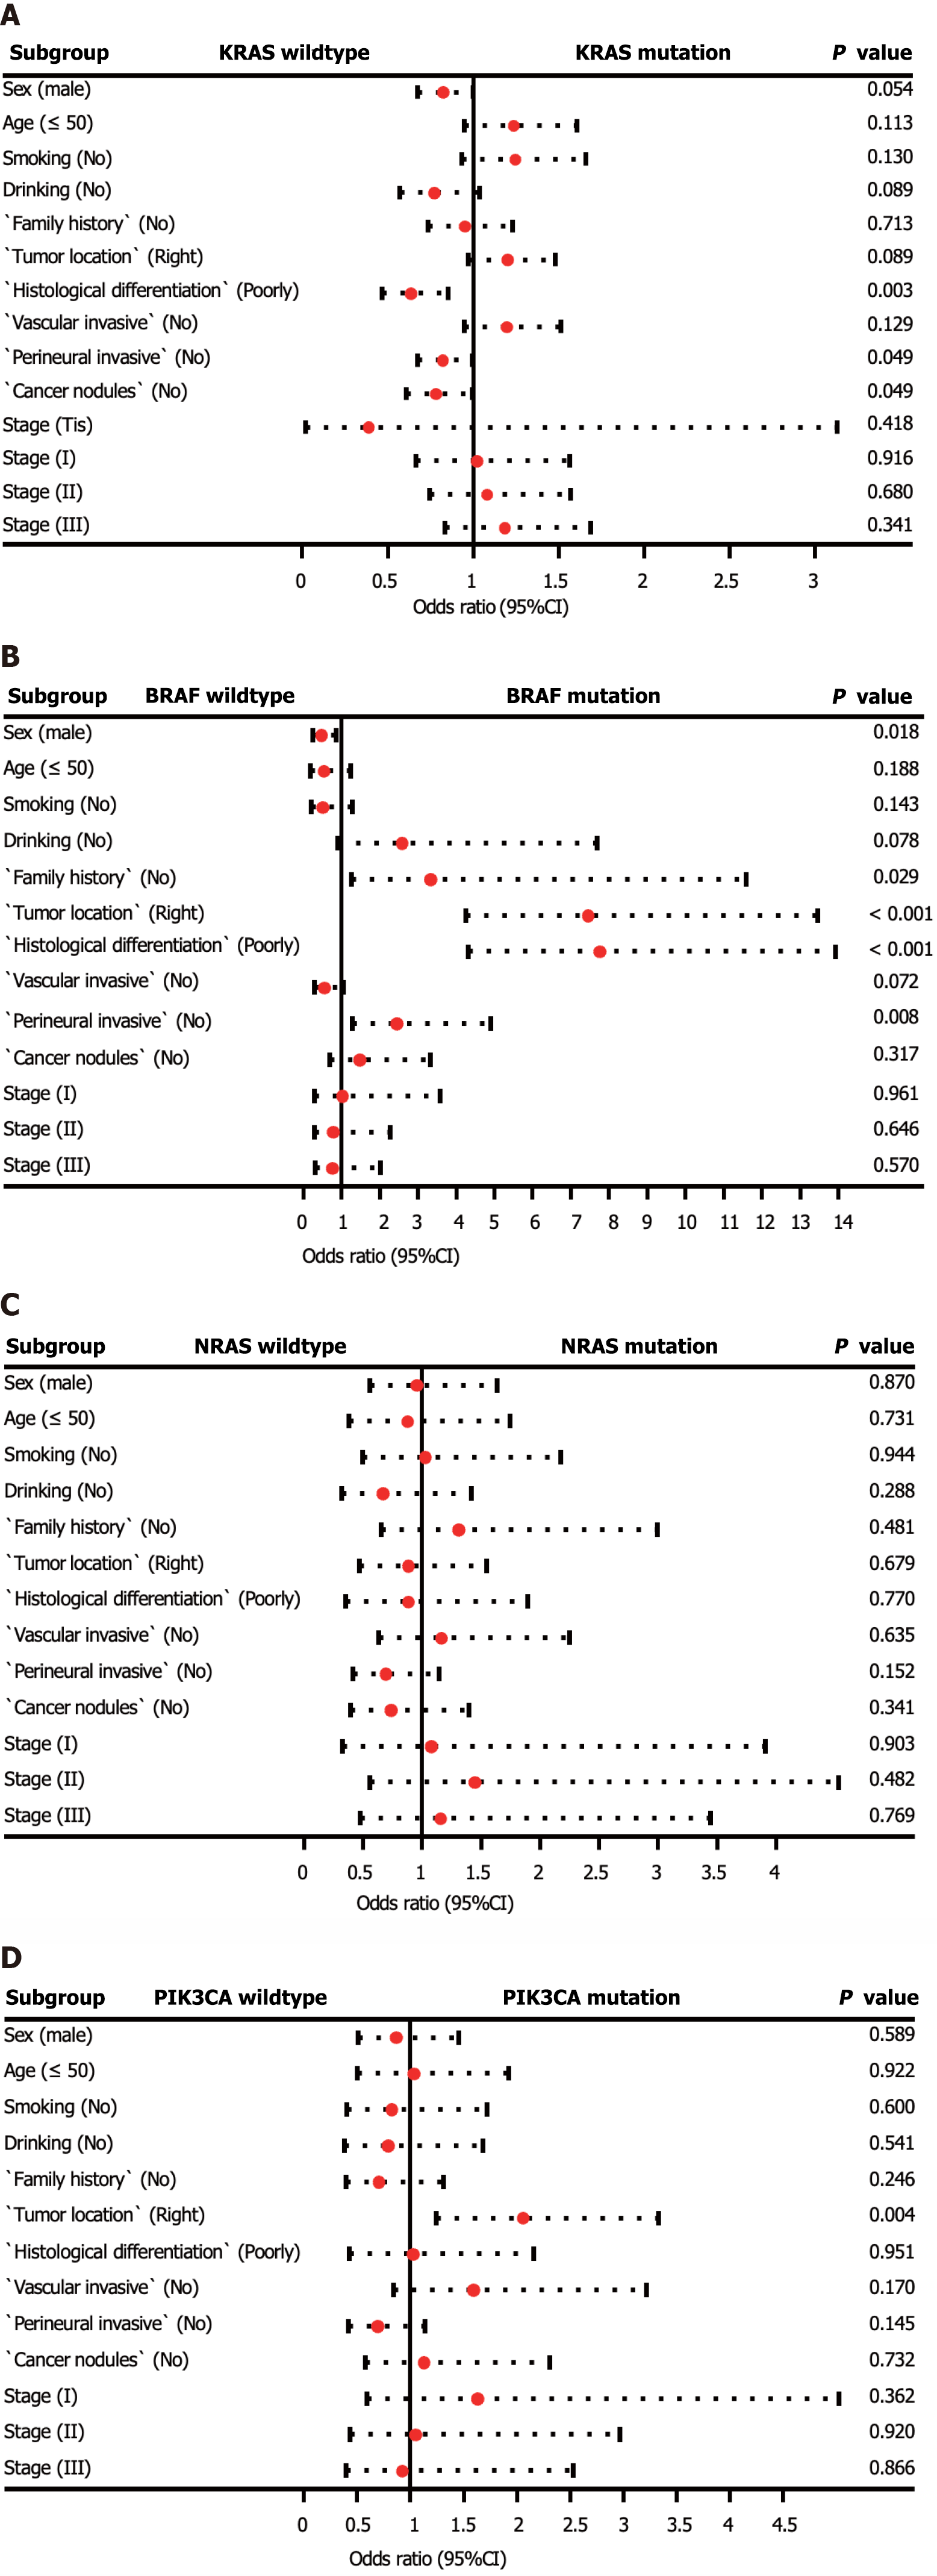
Figure 2 Multivariate logistic regression analyses for KRAS, BRAF, NRAS, and PIK3CA mutation detection.
A: KRAS mutation detection; B: BRAF mutation detection; C: NRAS mutation detection; D: PIK3CA mutation detection. If the odds ratio is less than 1, then the predictor is associated with KRAS, BRAF, NRAS, and PIK3CA mutation detection. OR: Odds ratio; CI: Confidence interval.
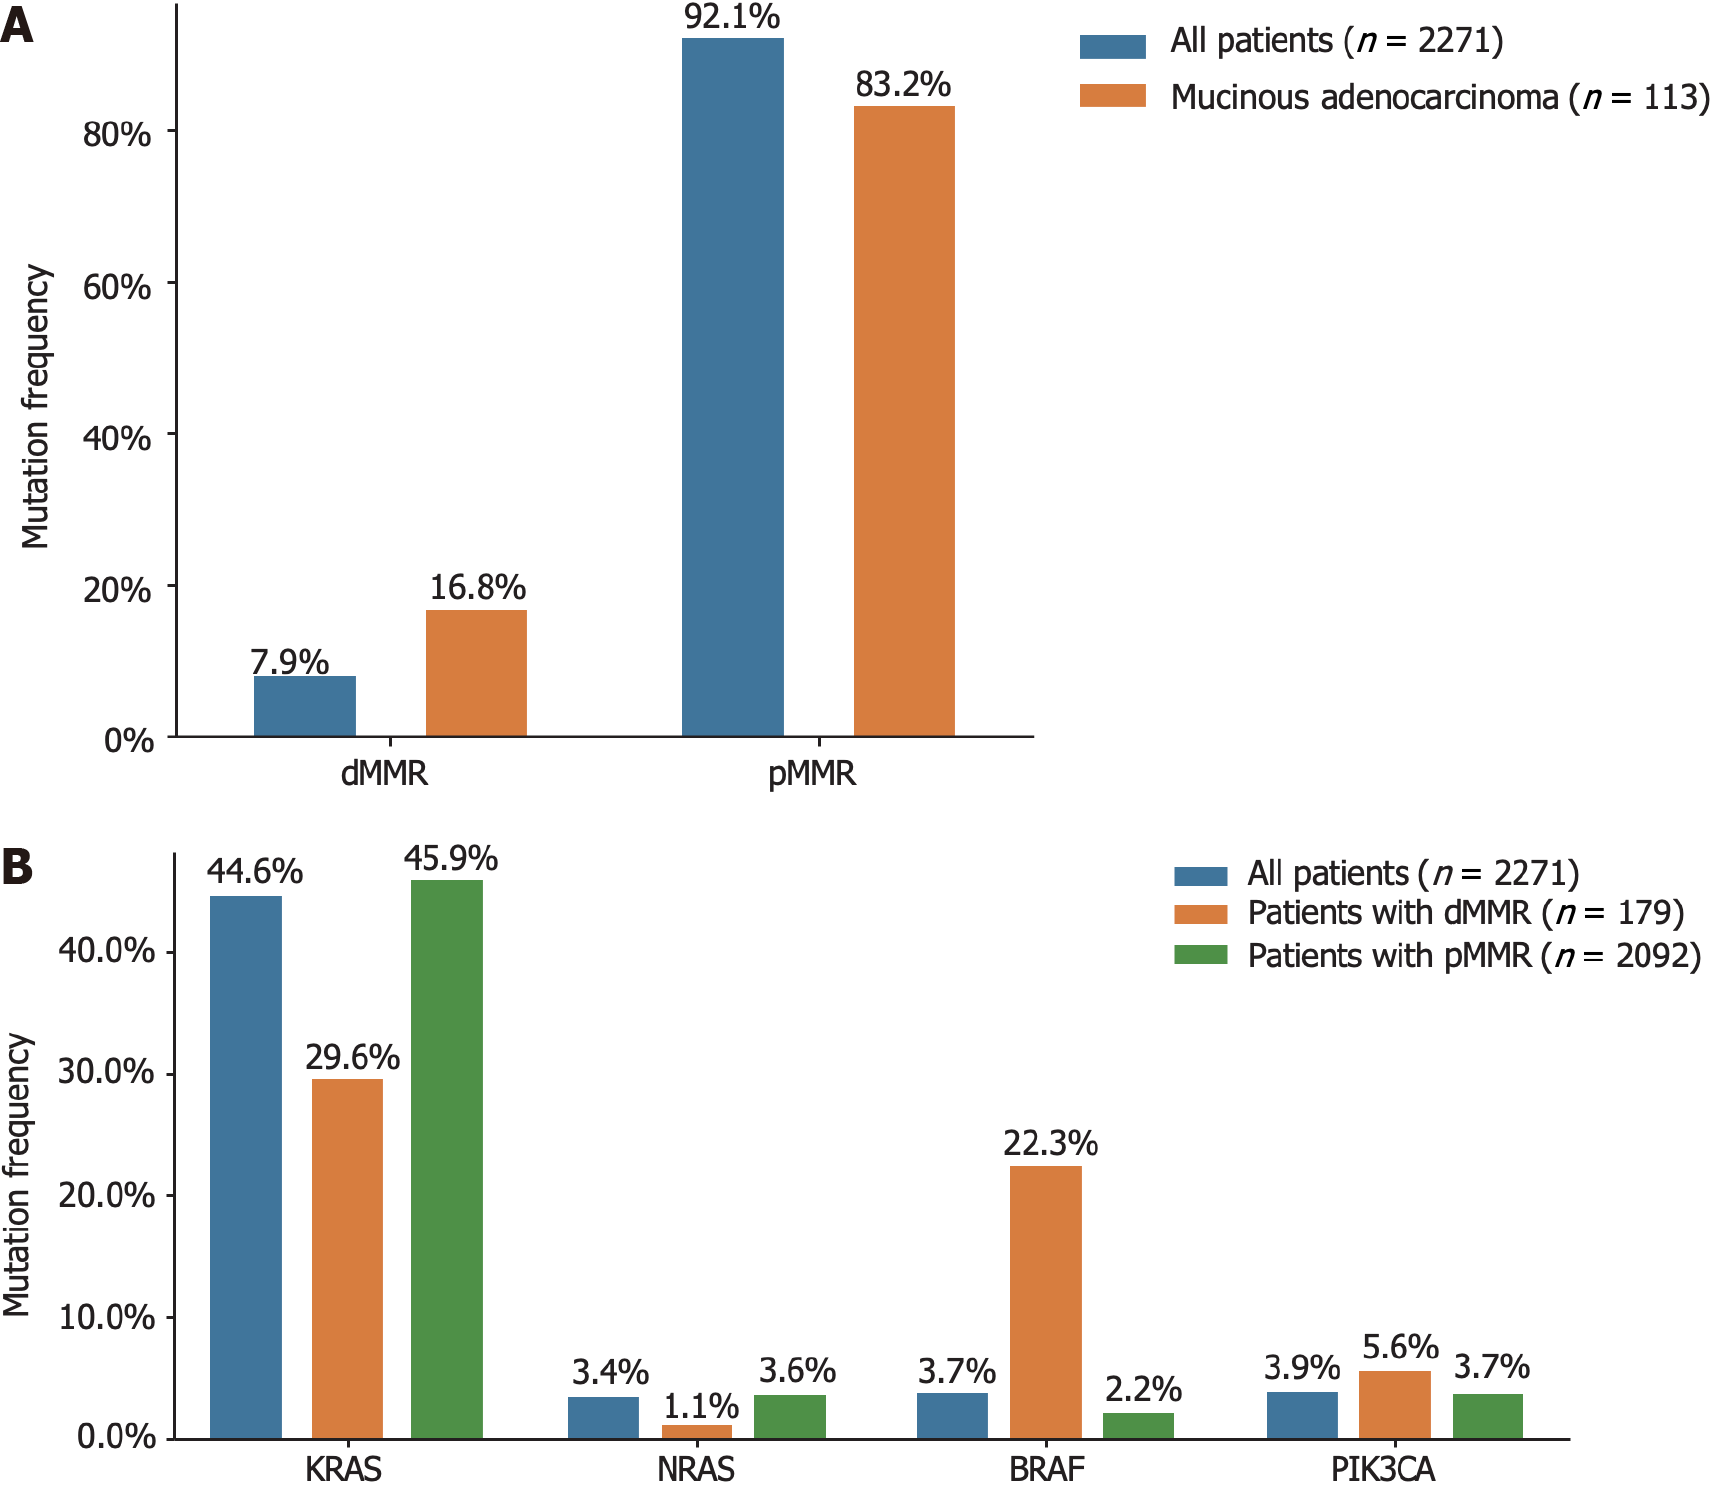
Figure 3 The mismatch repair deficiency status distributed across different histological types and driver genes.
A: Different histological types; B: Different driver genes. dMMR: Deficient mismatch repair; pMMR: Proficient mismatch repair.
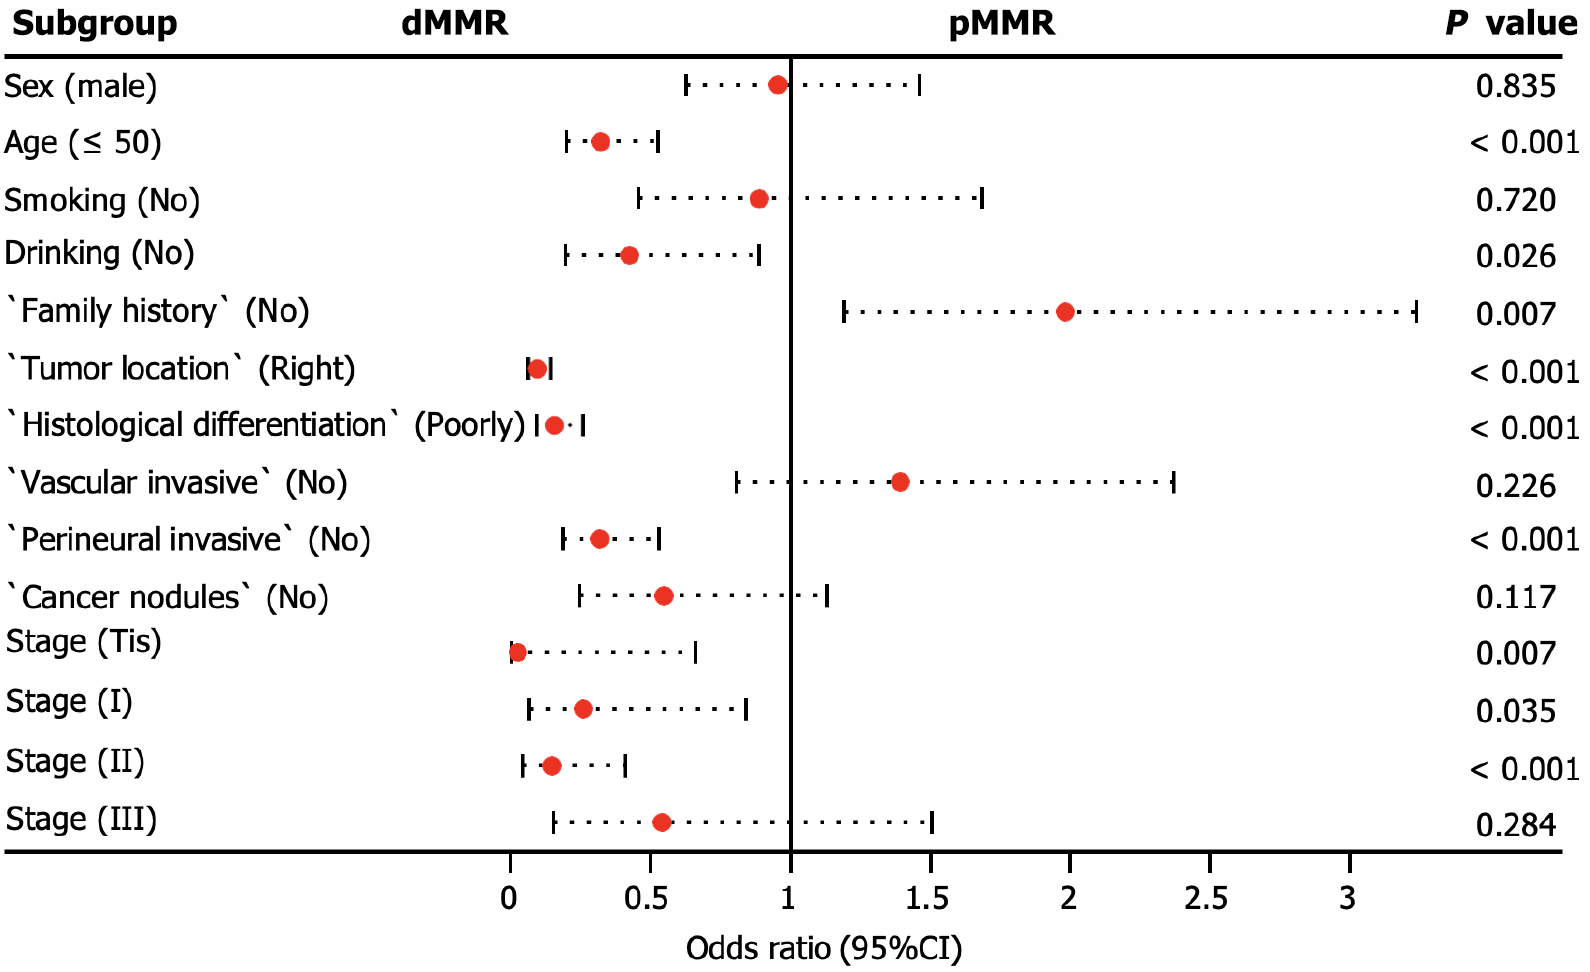
Figure 4 Multivariate logistic regression analyses for deficient mismatch repair detection.
If the odds ratio is less than 1, then the predictor is associated with deficient mismatch repair detection. CI: Confidence interval; OR: Odds ratio; dMMR: Deficient mismatch repair; pMMR: Proficient mismatch repair; Tis: Carcinoma in situ.
- Citation: Chen H, Jiang RY, Hua Z, Wang XW, Shi XL, Wang Y, Feng QQ, Luo J, Ning W, Shi YF, Zhang DK, Wang B, Jie JZ, Zhong DR. Comprehensive analysis of gene mutations and mismatch repair in Chinese colorectal cancer patients. World J Gastrointest Oncol 2024; 16(6): 2673-2682
- URL: https://www.wjgnet.com/1948-5204/full/v16/i6/2673.htm
- DOI: https://dx.doi.org/10.4251/wjgo.v16.i6.2673


