Copyright
©The Author(s) 2024.
World J Gastrointest Oncol. May 15, 2024; 16(5): 2168-2180
Published online May 15, 2024. doi: 10.4251/wjgo.v16.i5.2168
Published online May 15, 2024. doi: 10.4251/wjgo.v16.i5.2168
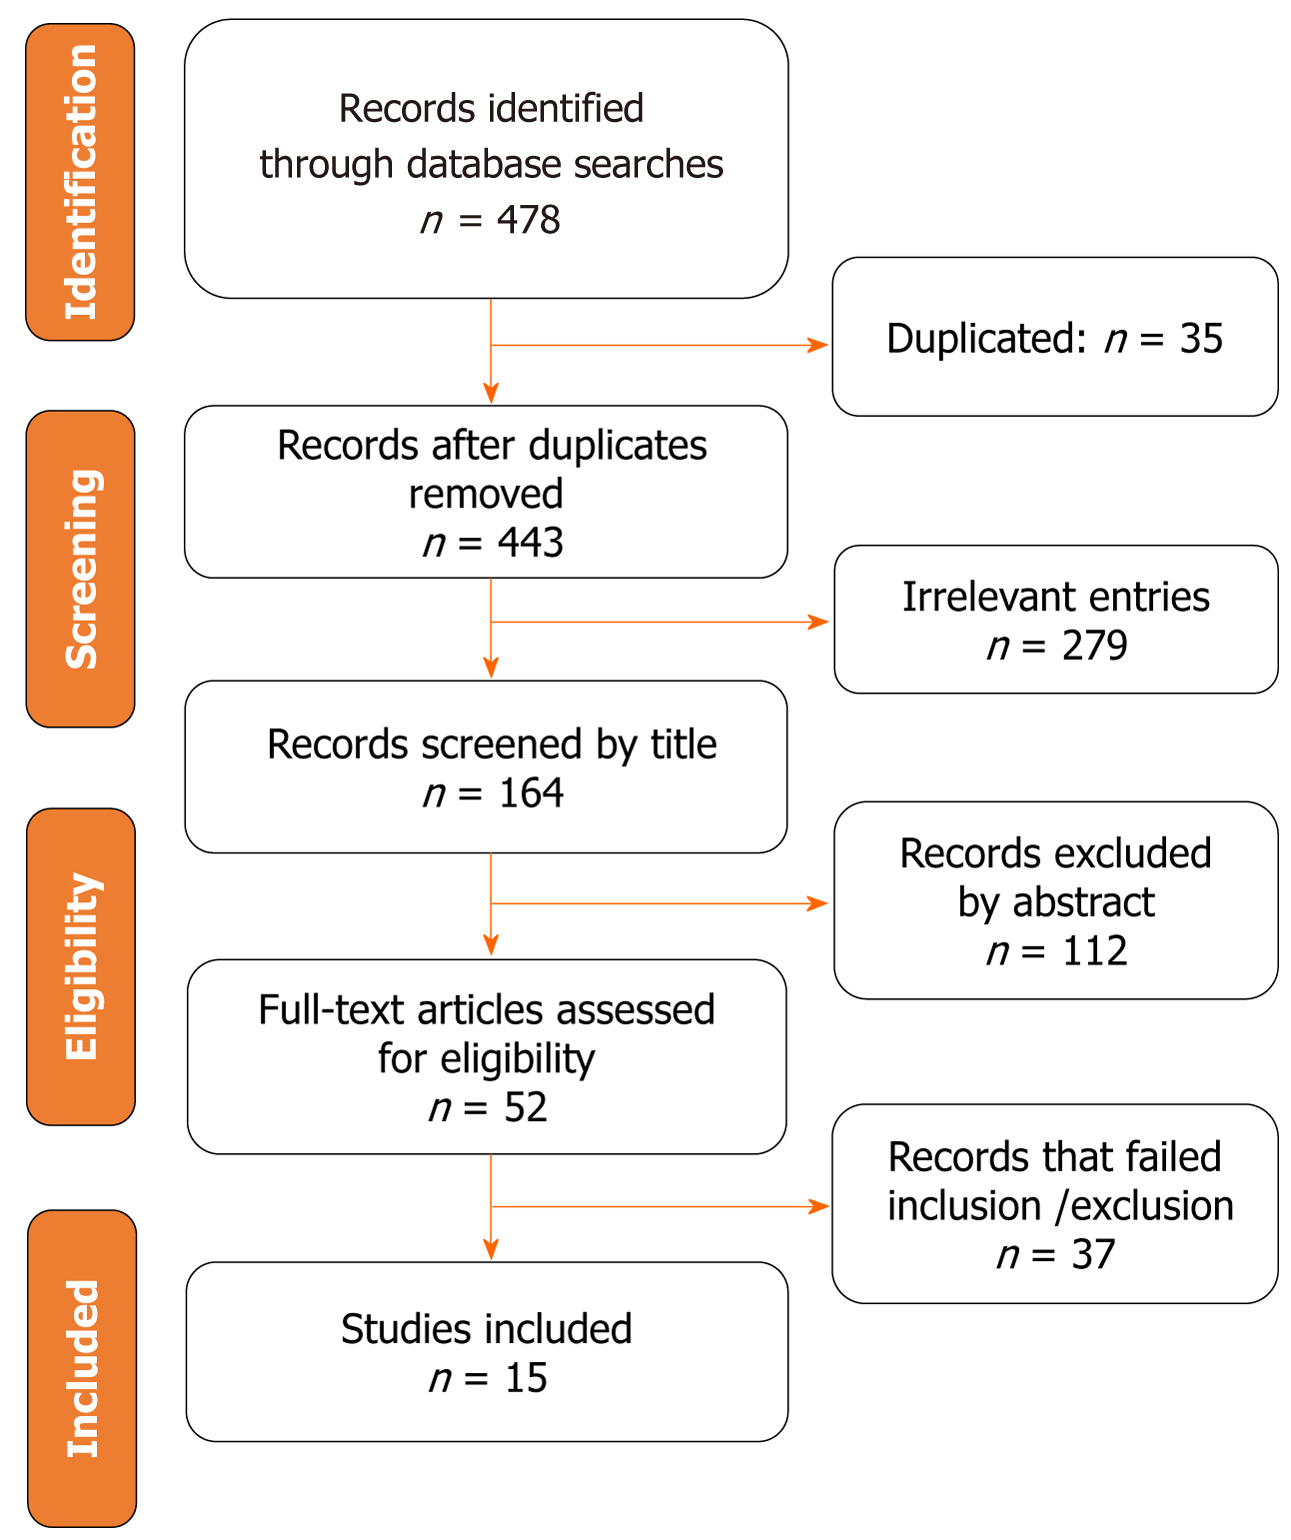
Figure 1 Flowchart of study selection process.
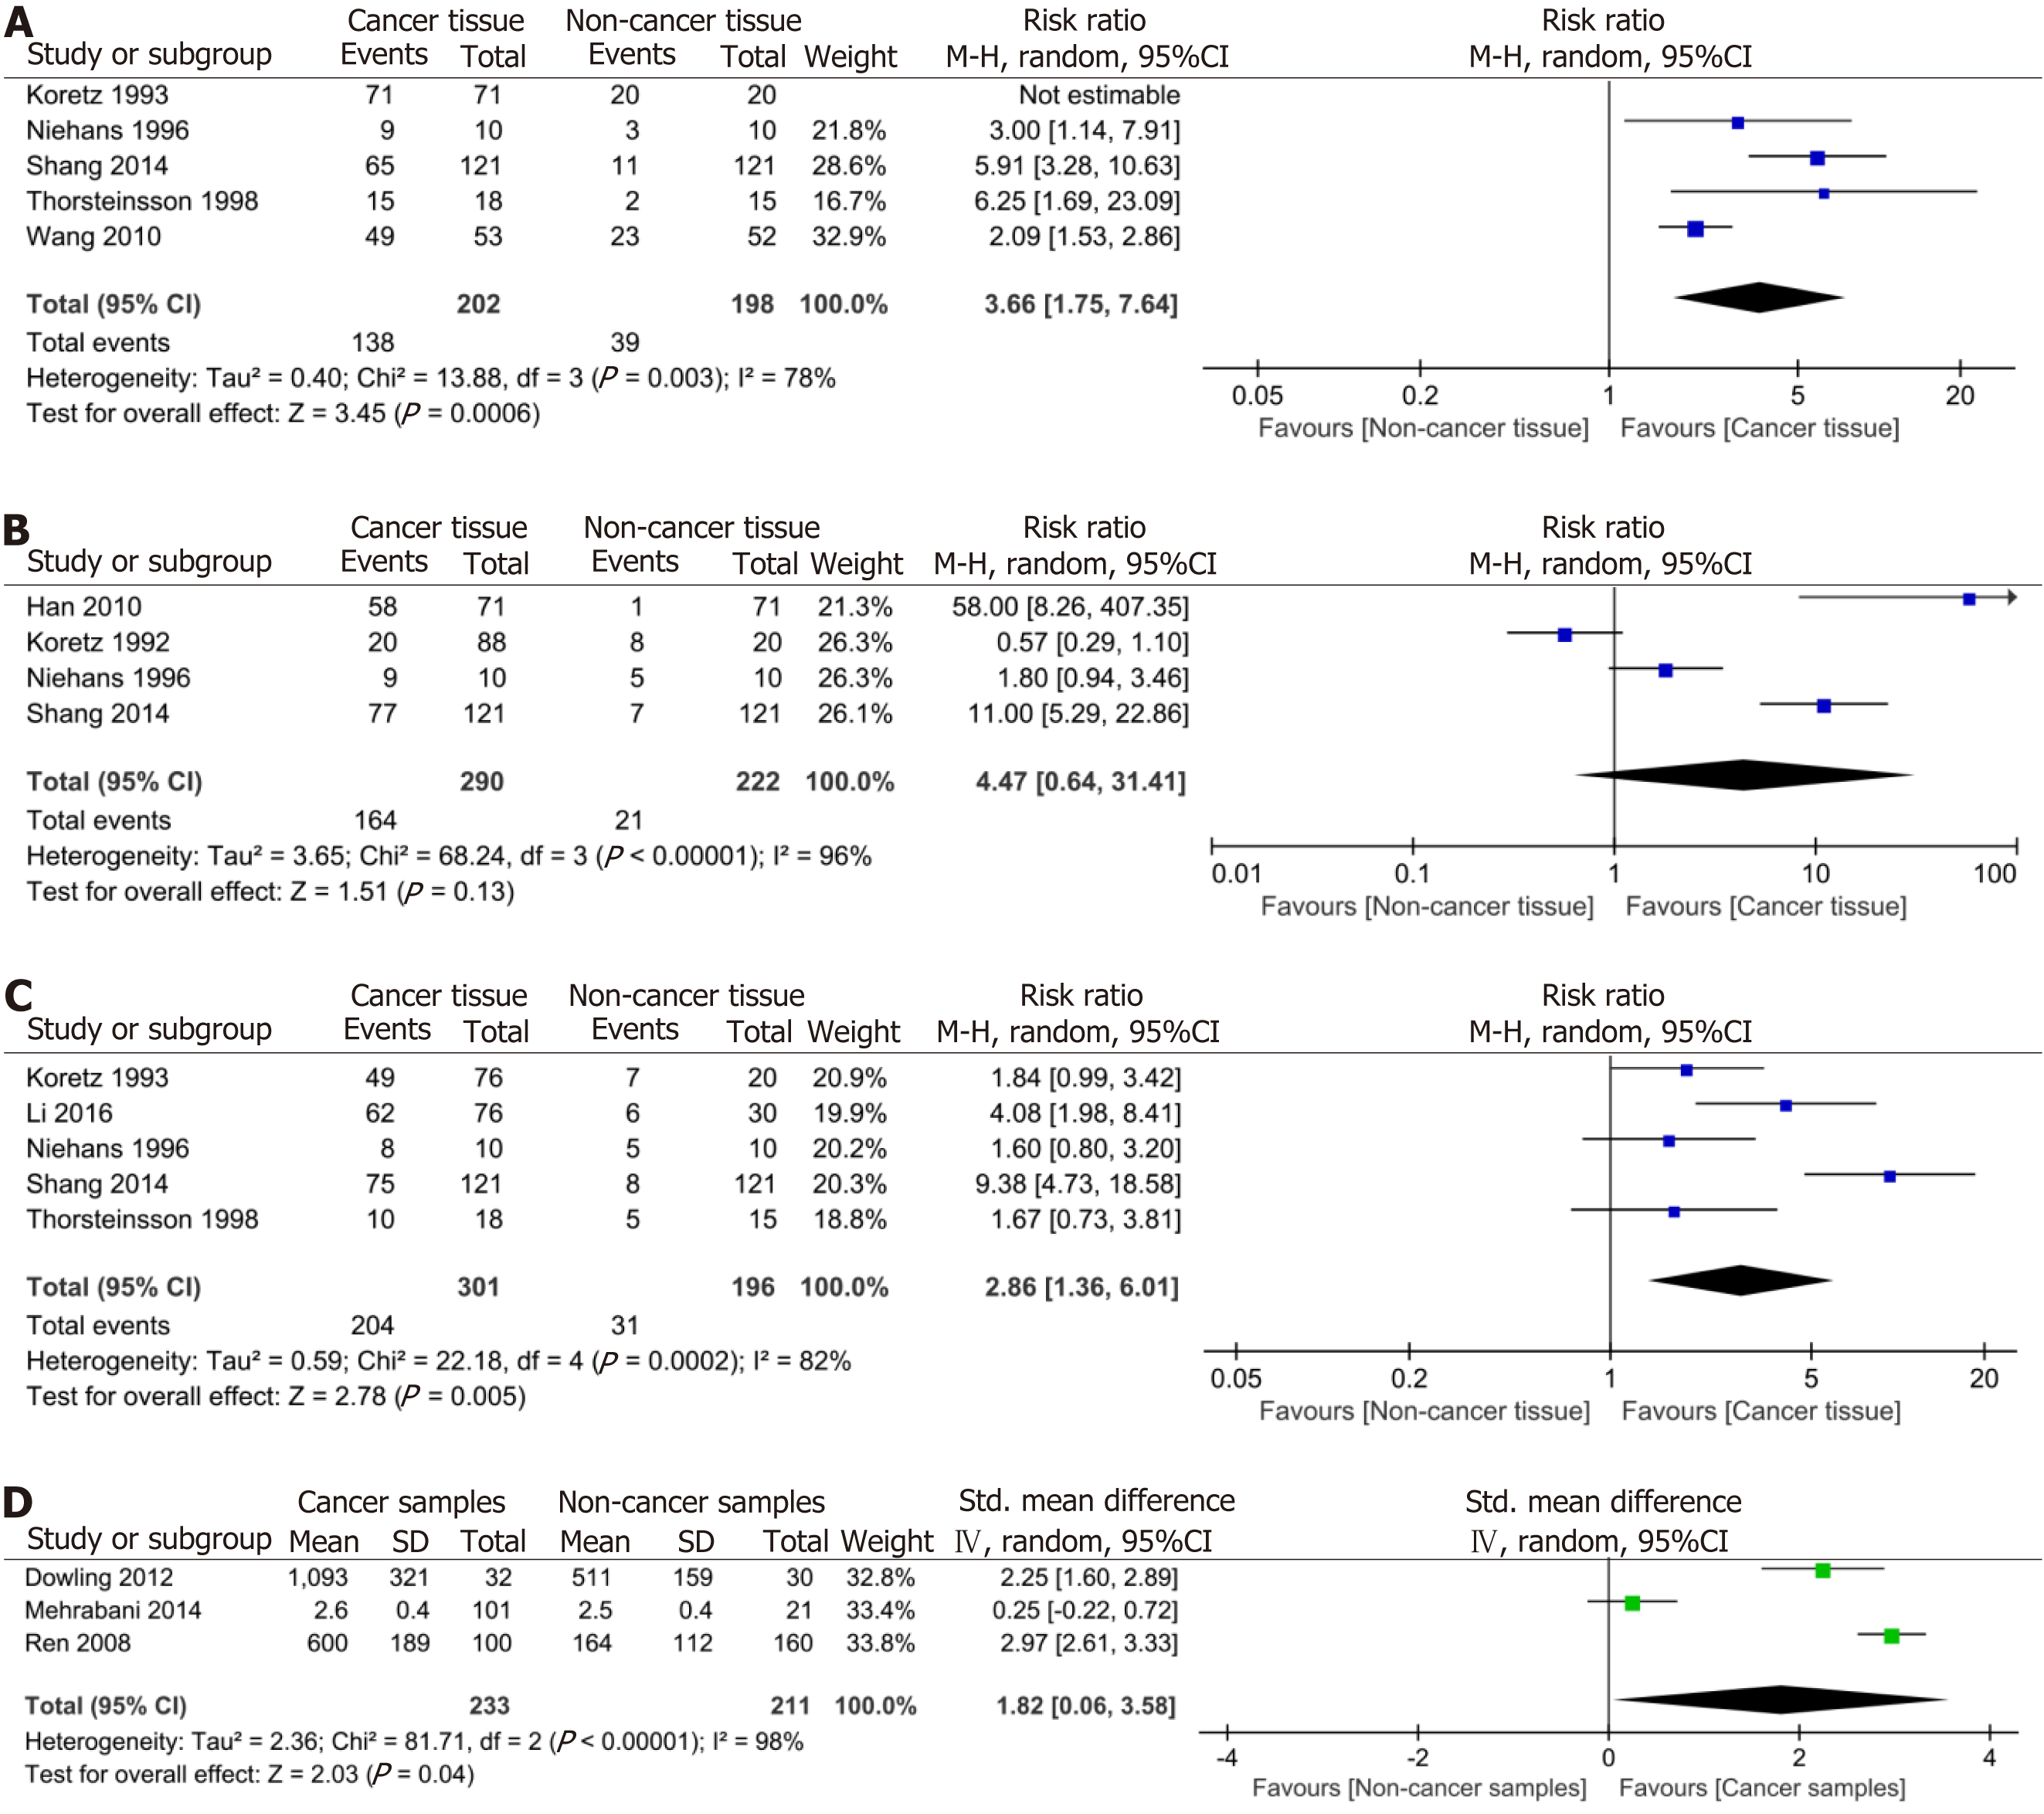
Figure 2 Forest plots of meta-analyses of studies comparing colorectal cancer samples with non-cancer samples for positive expression for complement component proteins detected by immunohistochemistry.
A: Cluster of differentiation 46; B: Cluster of differentiation 55; C: Cluster of differentiation 59; D: Complement component 3. CI: Confidence interval.
Figure 3 Forest plot of meta-analyses of studies comparing colorectal cancer samples with non-cancer samples for positive expression for serum complement component 1.
CI: Confidence interval.
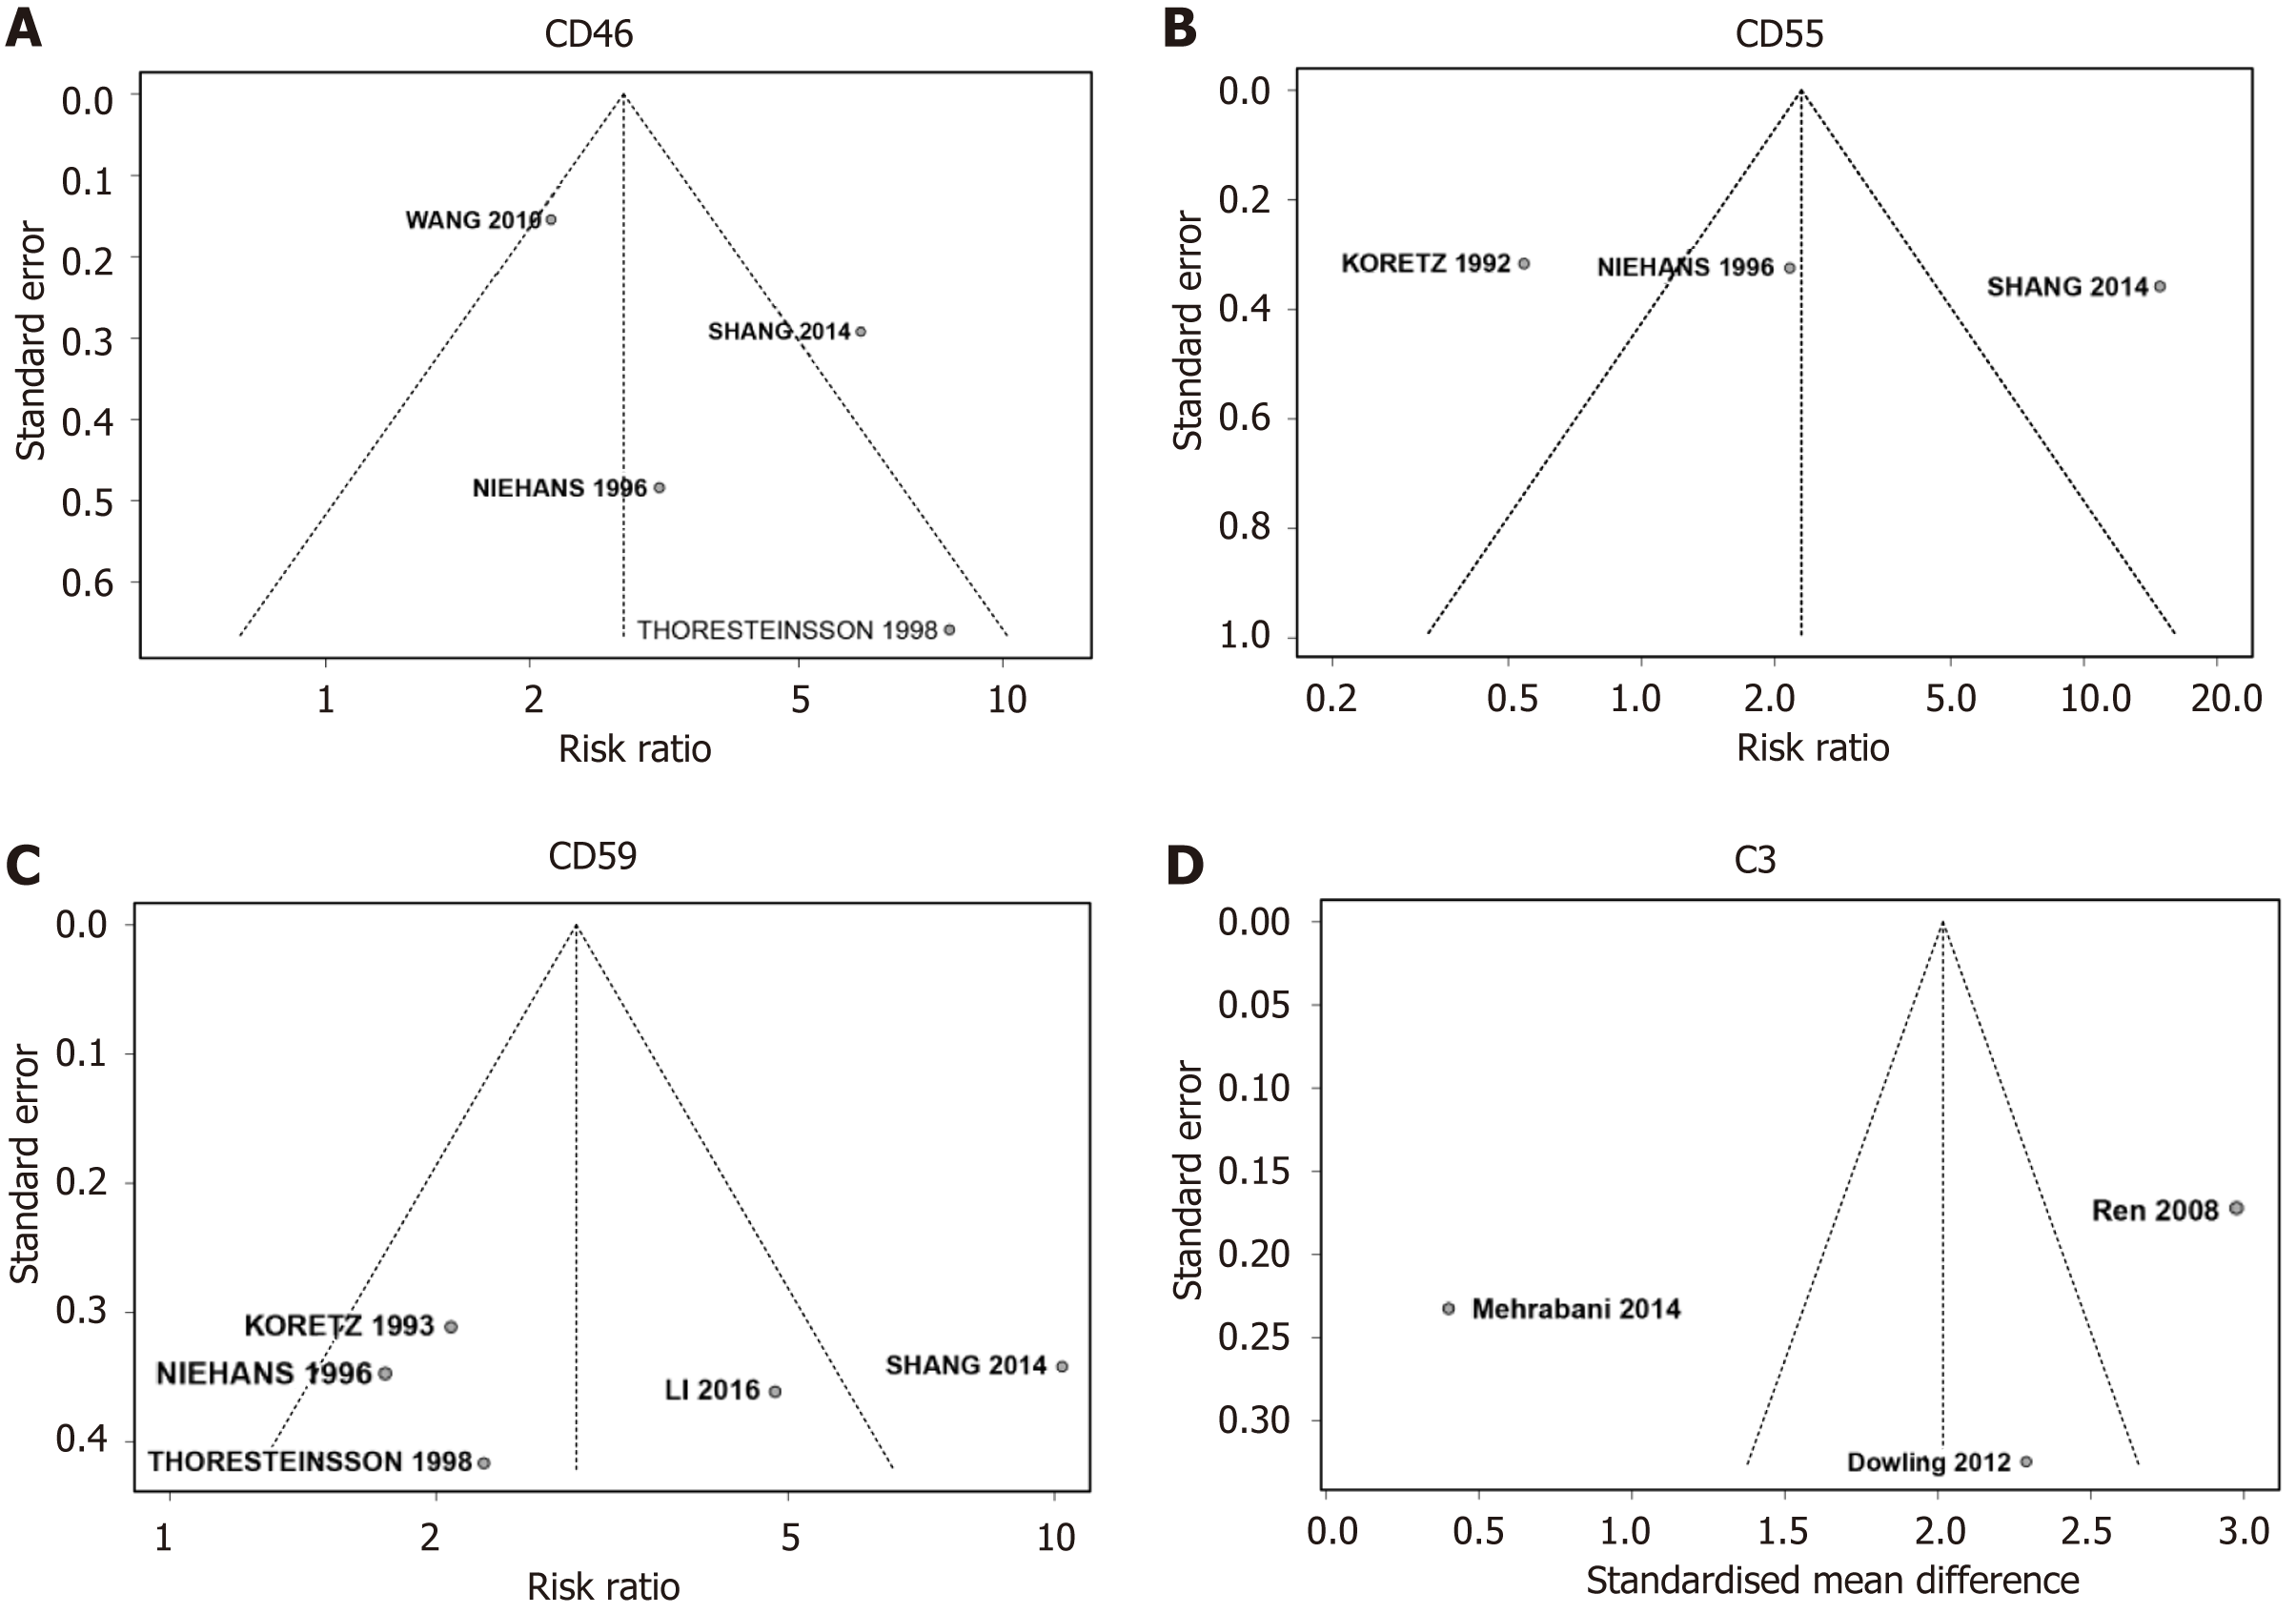
Figure 4 Funnel plots on outcomes of the complement components.
A: Cluster of differentiation 46; B: Cluster of differentiation 55; C: Cluster of differentiation 59; D: Complement component 3. CD: Cluster of differentiation; C3: Complement component 3.
- Citation: Zhu XL, Zhang L, Qi SX. Association of complement components with risk of colorectal cancer: A systematic review and meta-analysis. World J Gastrointest Oncol 2024; 16(5): 2168-2180
- URL: https://www.wjgnet.com/1948-5204/full/v16/i5/2168.htm
- DOI: https://dx.doi.org/10.4251/wjgo.v16.i5.2168


