Copyright
©The Author(s) 2024.
World J Gastrointest Oncol. May 15, 2024; 16(5): 1869-1877
Published online May 15, 2024. doi: 10.4251/wjgo.v16.i5.1869
Published online May 15, 2024. doi: 10.4251/wjgo.v16.i5.1869
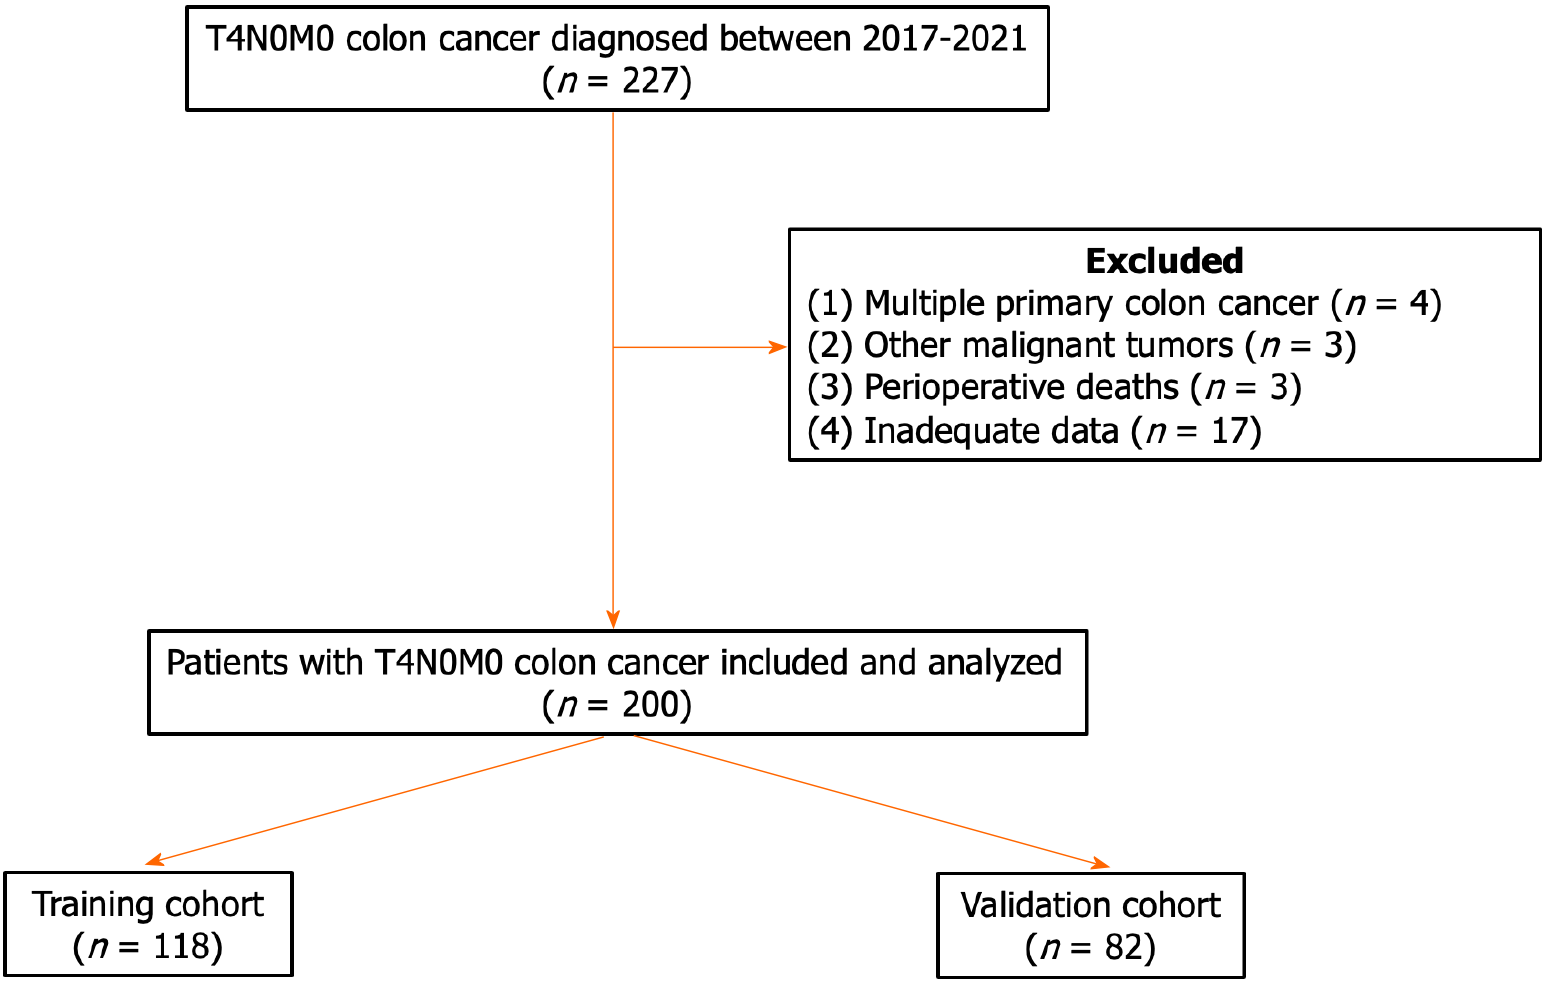
Figure 1 Flowchart of the study designed.
227 patients were treated and 200 patients were enrolled into this study, which were randomly divided into training cohort and validation cohort.
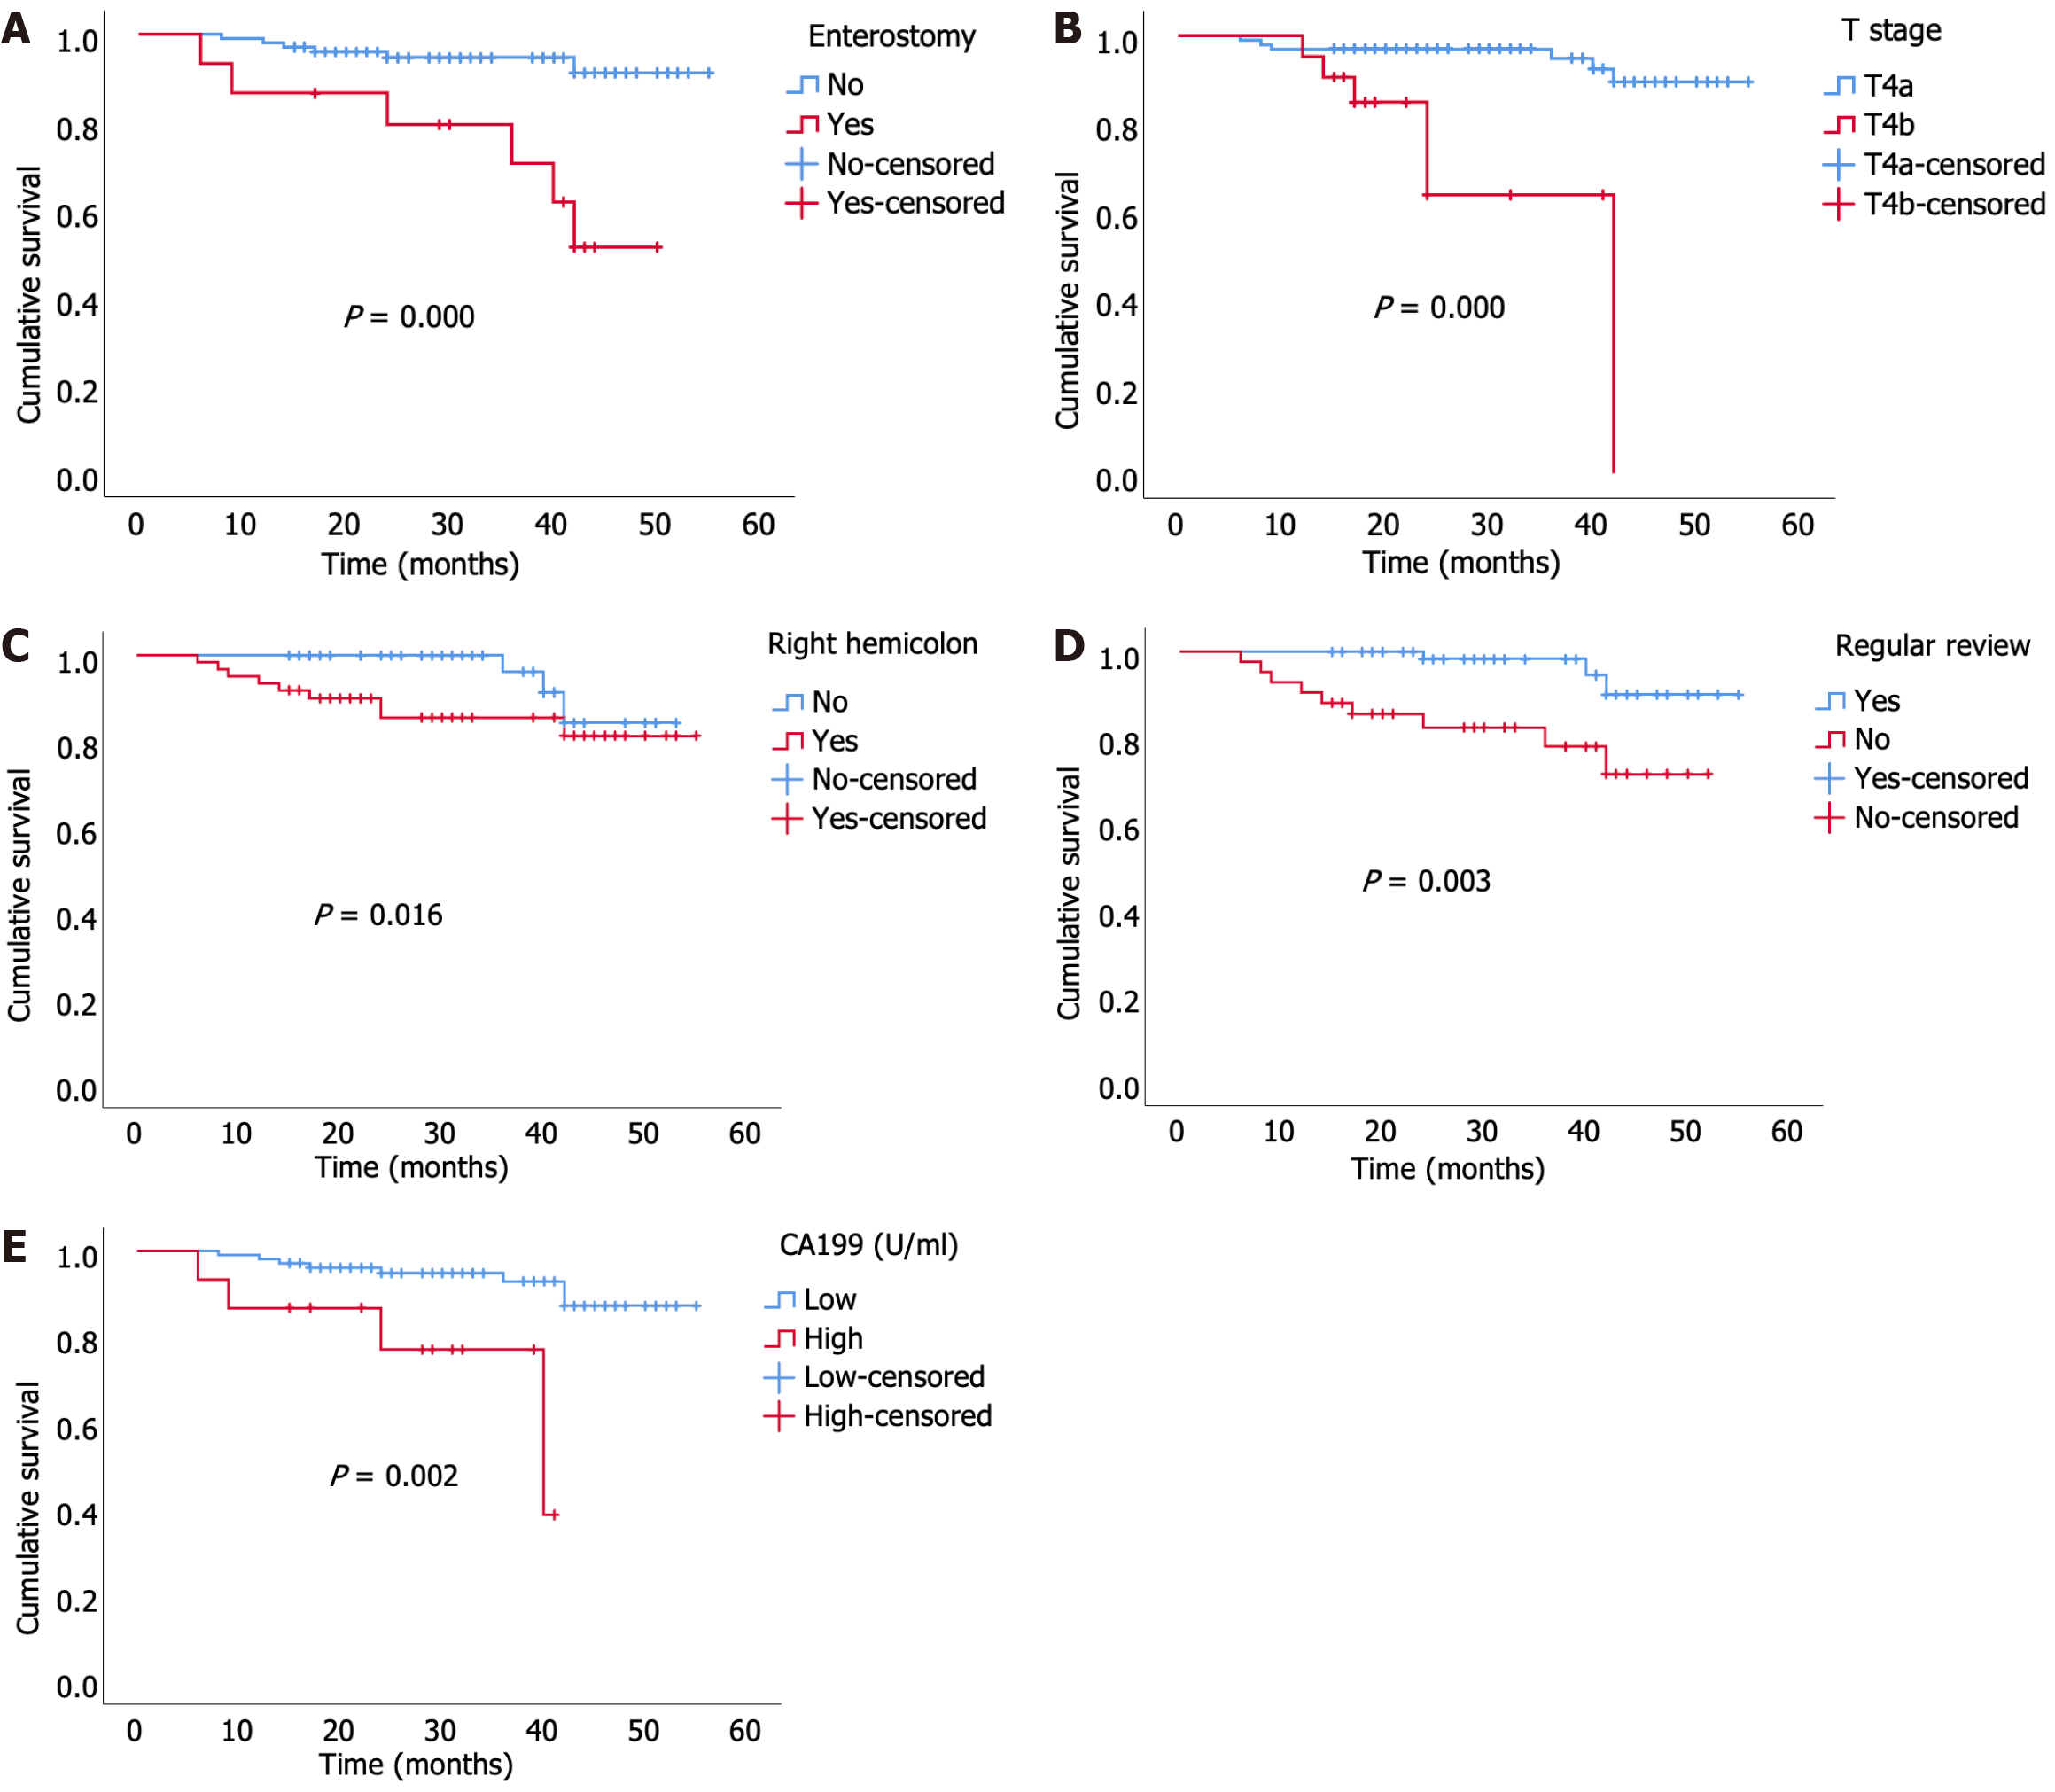
Figure 2 Kaplan-Meier curves of overall survival for patients with T4N0M0 colon cancer in the training cohort.
A: Enterostomy; B: T stage; C: Right hemicolon; D: Regular review; E: Carbohydrate antigen 199. CA199: Carbohydrate antigen 199.
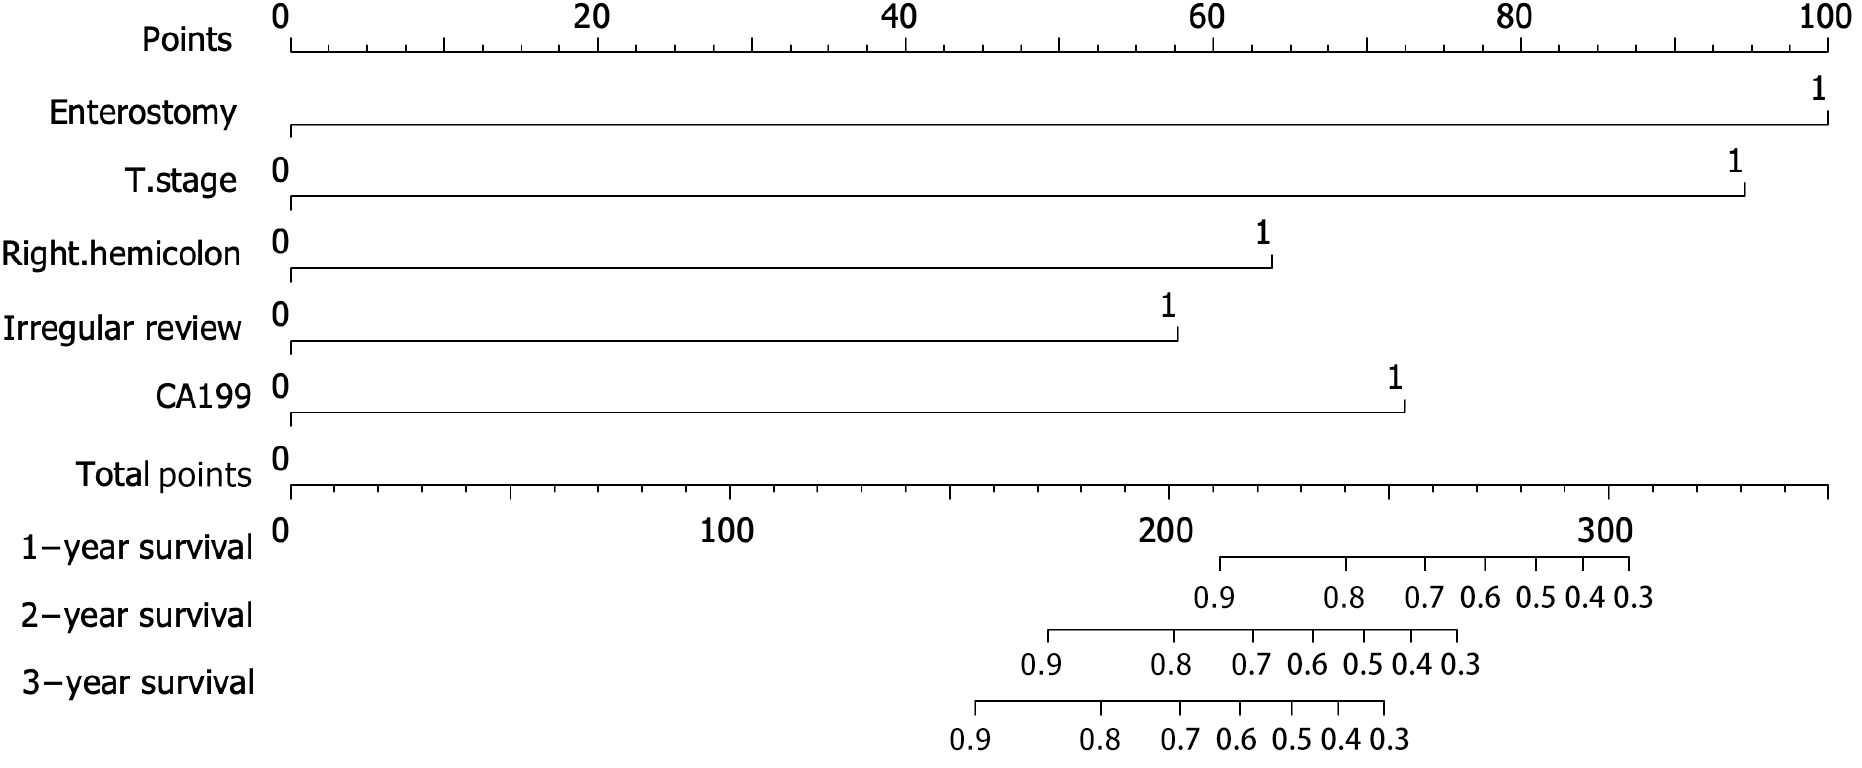
Figure 3 The probability of 1-, 2- and 3-yr overall survival in patients with T4N0M0 colon cancer.
It can be predicted by calculating the points of each variate and projecting the total points to the bottom scale. CA199: Carbohydrate antigen 199.
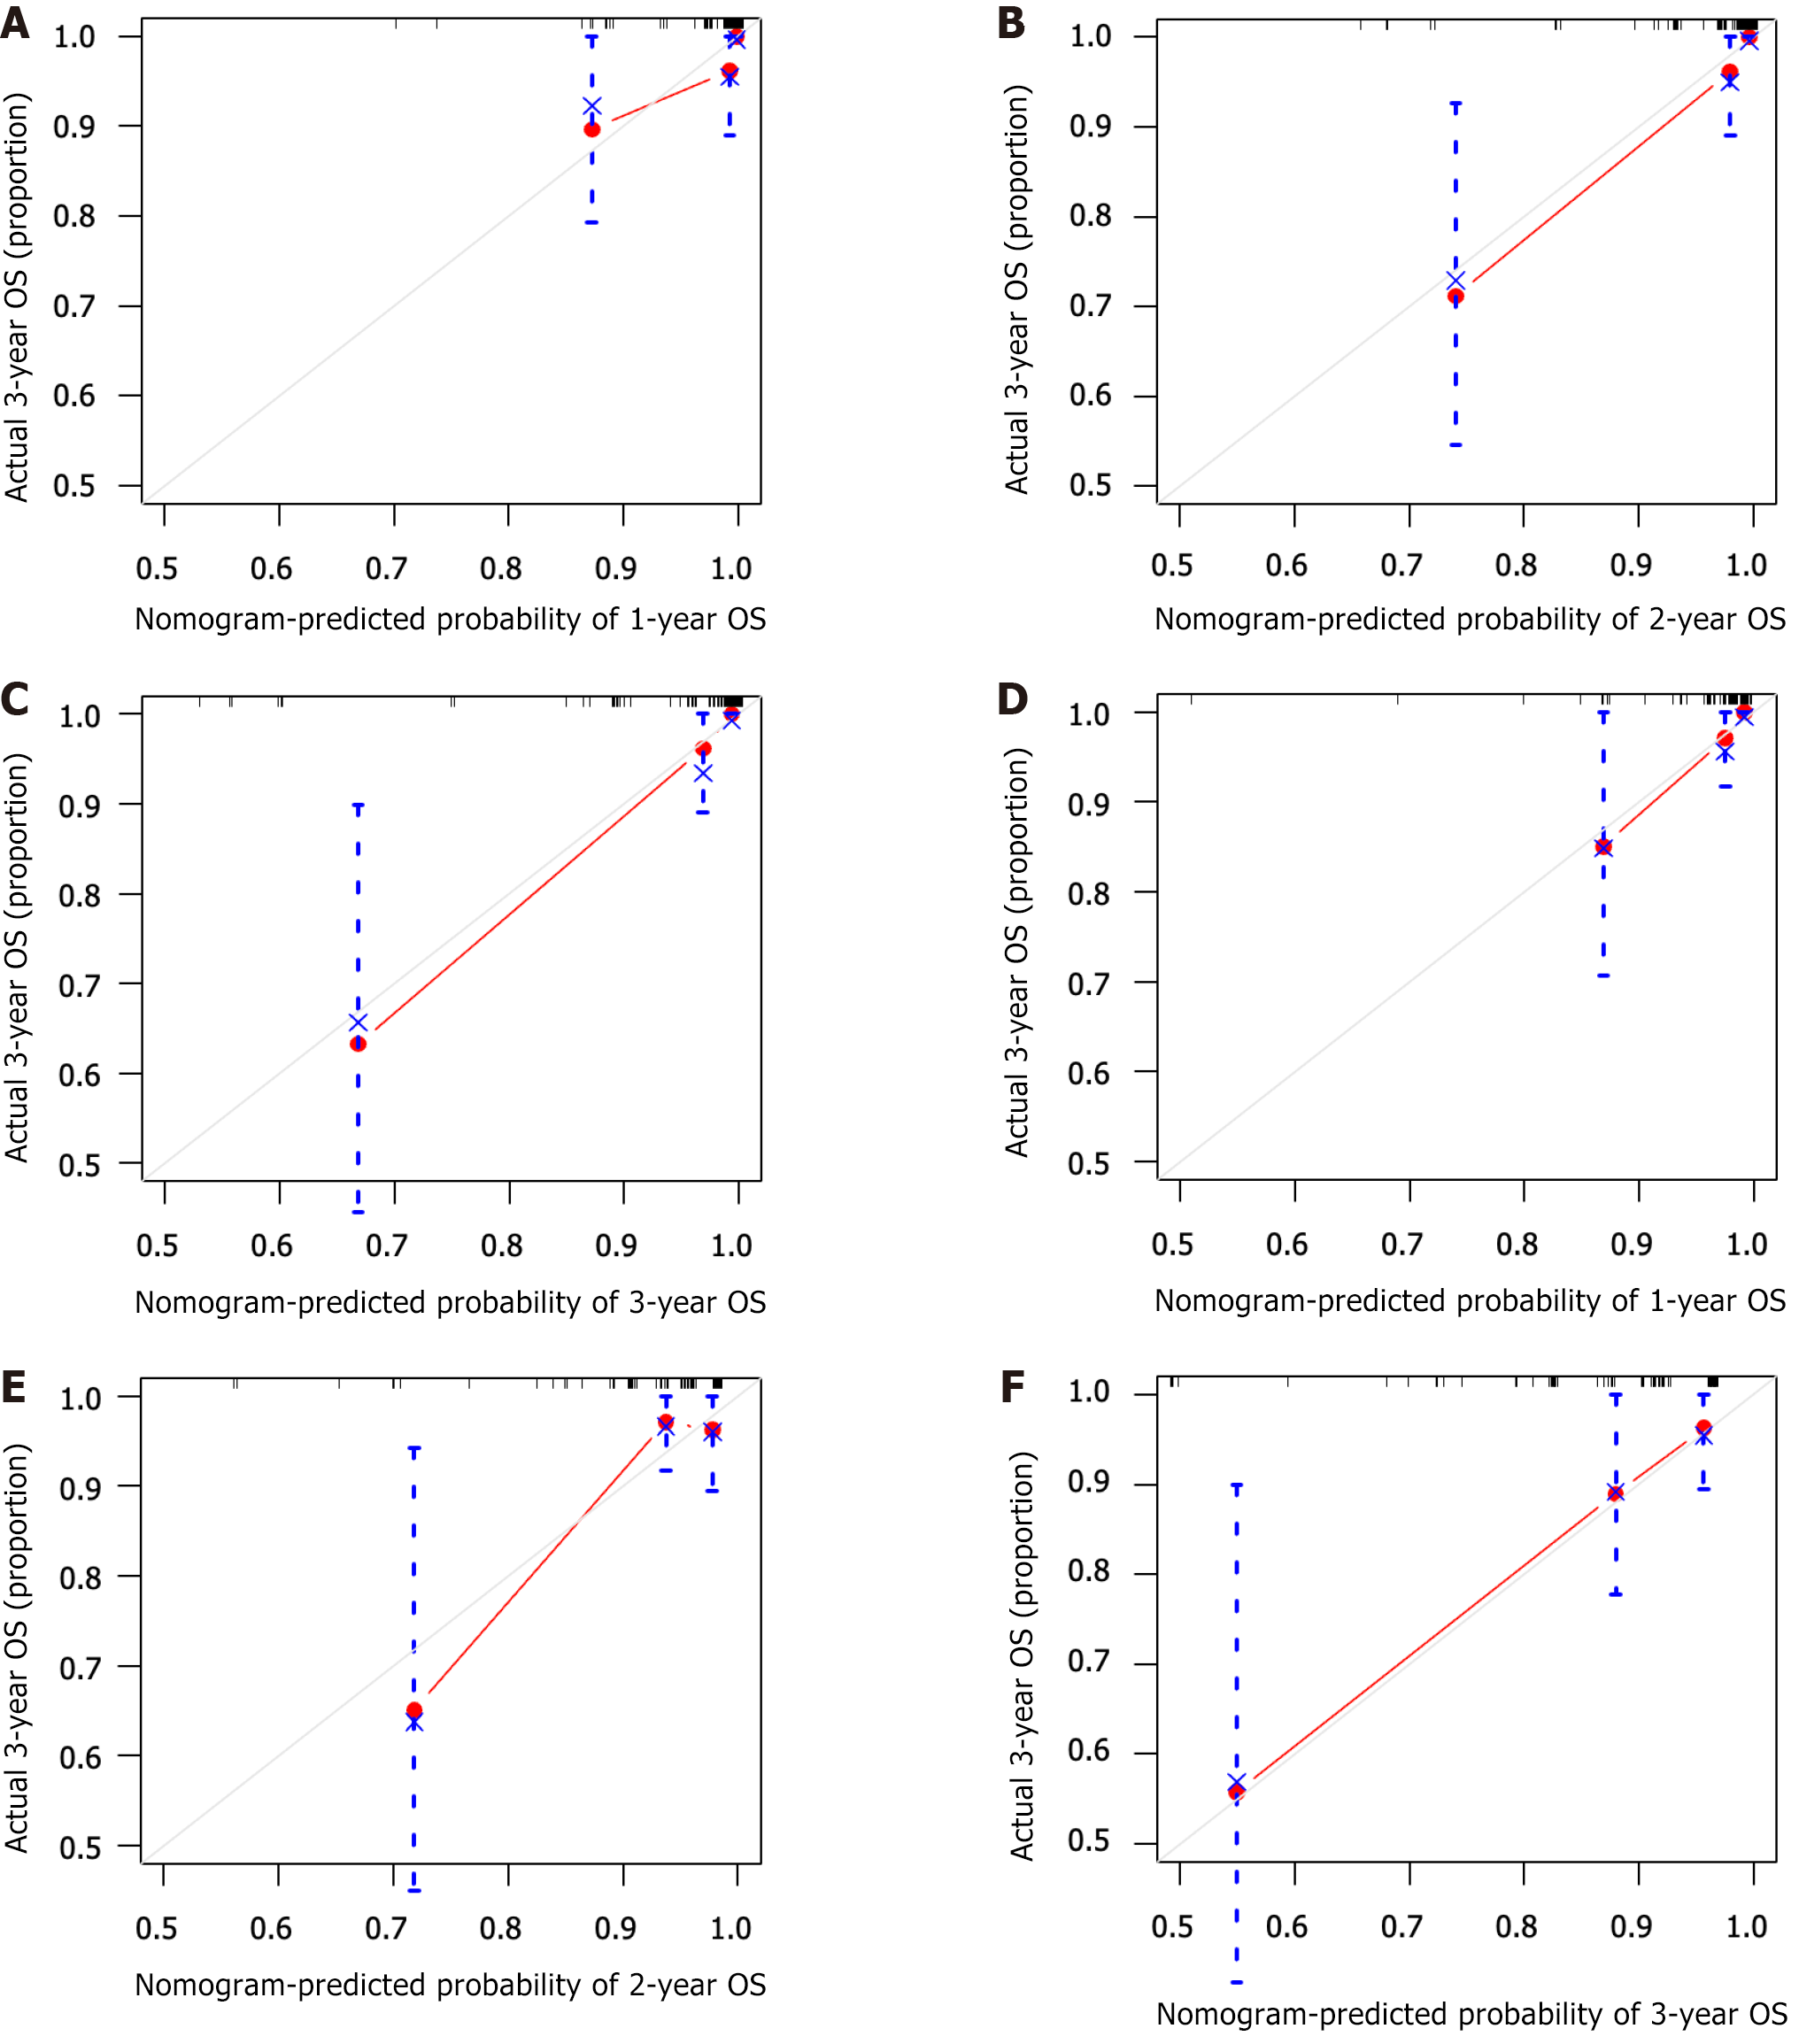
Figure 4 The calibration curves of the nomogram model in the training and validation cohorts.
X-axis: The predicted overall survival (OS); y-axis: The actual OS. A-C: The 1-3 yr OS of the training cohort; D-F: The 1-3 yr OS of the validation cohort. OS: Overall survival.
- Citation: Liu B, Zhang ZX, Nie XY, Sun WL, Yan YJ, Fu WH. Clinical outcome and prognostic factors of T4N0M0 colon cancer after R0 resection: A retrospective study. World J Gastrointest Oncol 2024; 16(5): 1869-1877
- URL: https://www.wjgnet.com/1948-5204/full/v16/i5/1869.htm
- DOI: https://dx.doi.org/10.4251/wjgo.v16.i5.1869


