Copyright
©The Author(s) 2024.
World J Gastrointest Oncol. Apr 15, 2024; 16(4): 1437-1452
Published online Apr 15, 2024. doi: 10.4251/wjgo.v16.i4.1437
Published online Apr 15, 2024. doi: 10.4251/wjgo.v16.i4.1437
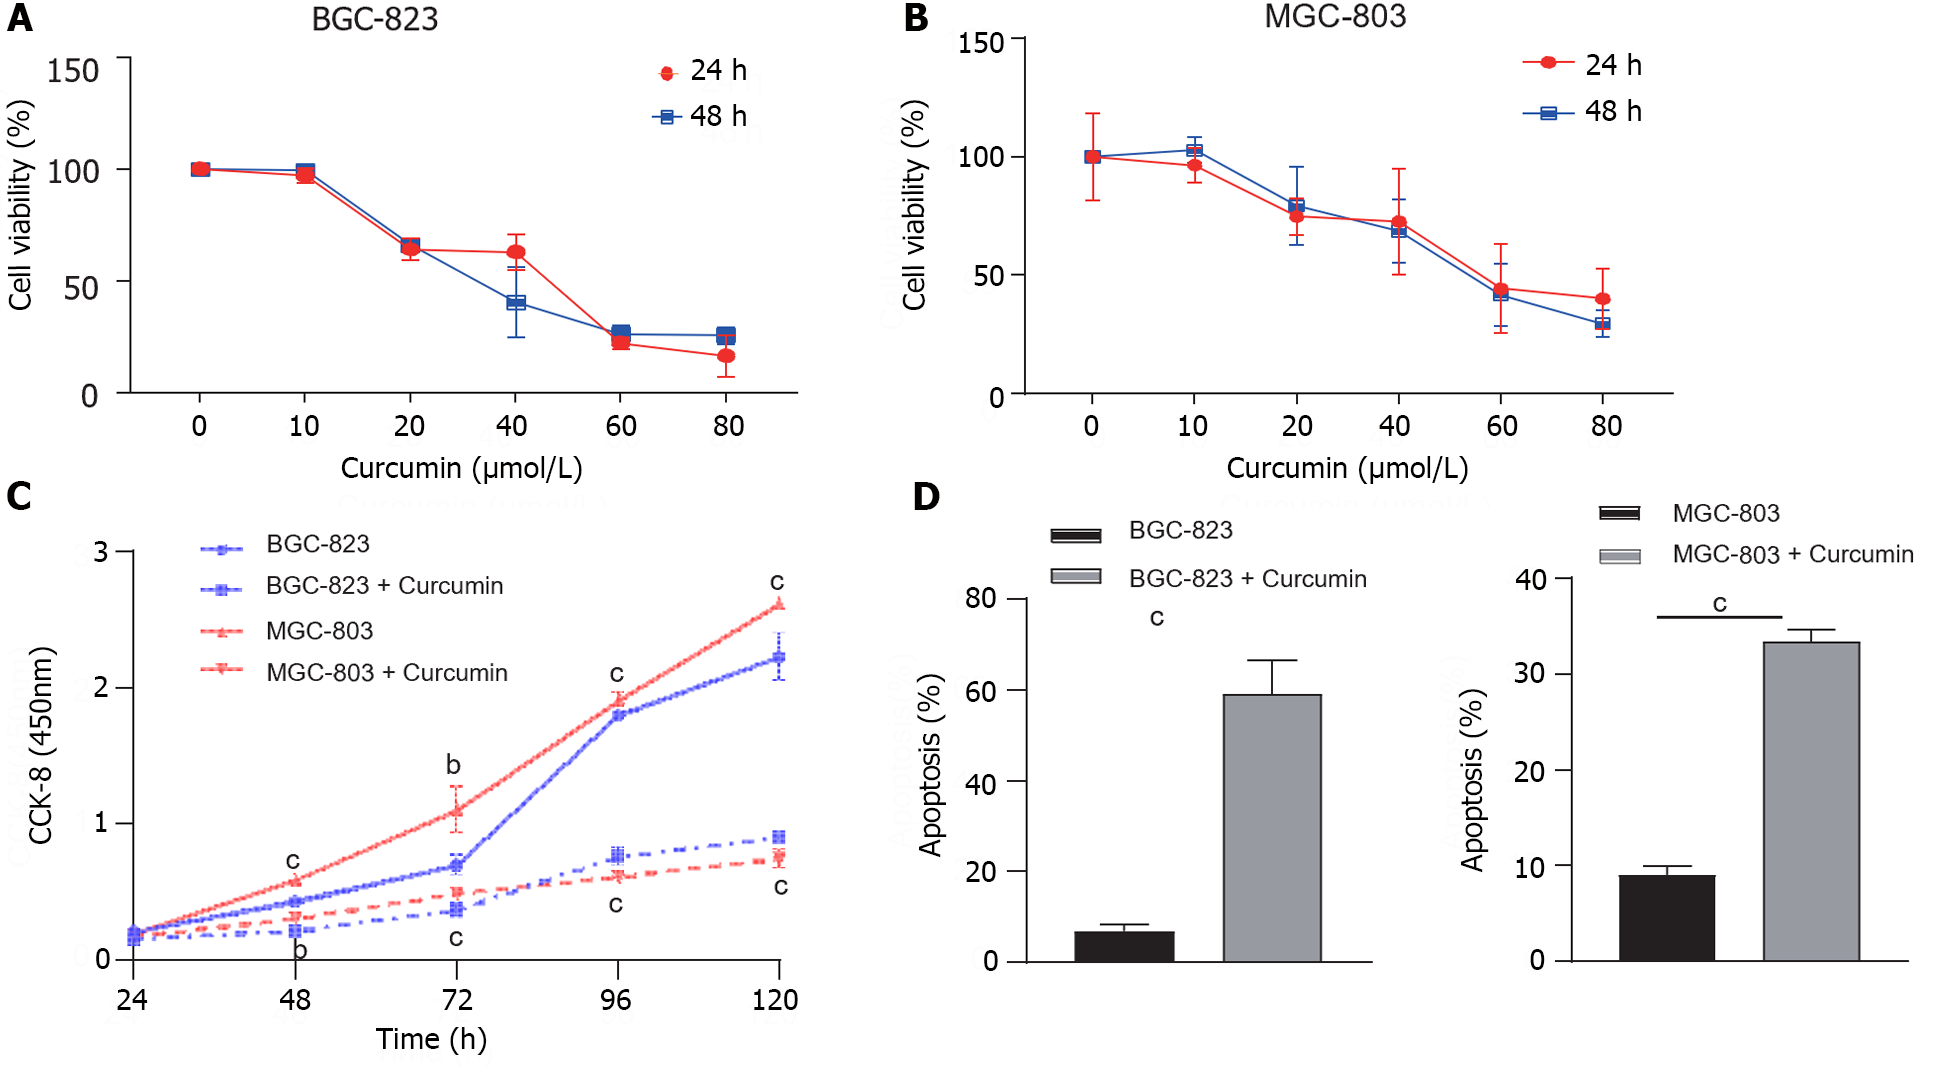
Figure 1 Effects of curcumin concentrations on cell viability and proliferation.
A and B: The effects of different concentrations of curcumin on the viability of BGC-823 and MGC-803 cells were detected using the CCK-8 assay; C: The proliferation of BGC-823 and MGC-803 cells treated with 40 μmol/L curcumin at different time points was assessed using the CCK-8 assay; D: The apoptotic rate of BGC-823 and MGC-803 cells after curcumin treatment. The results were obtained from three independent tests. bP < 0.01, cP < 0.001.
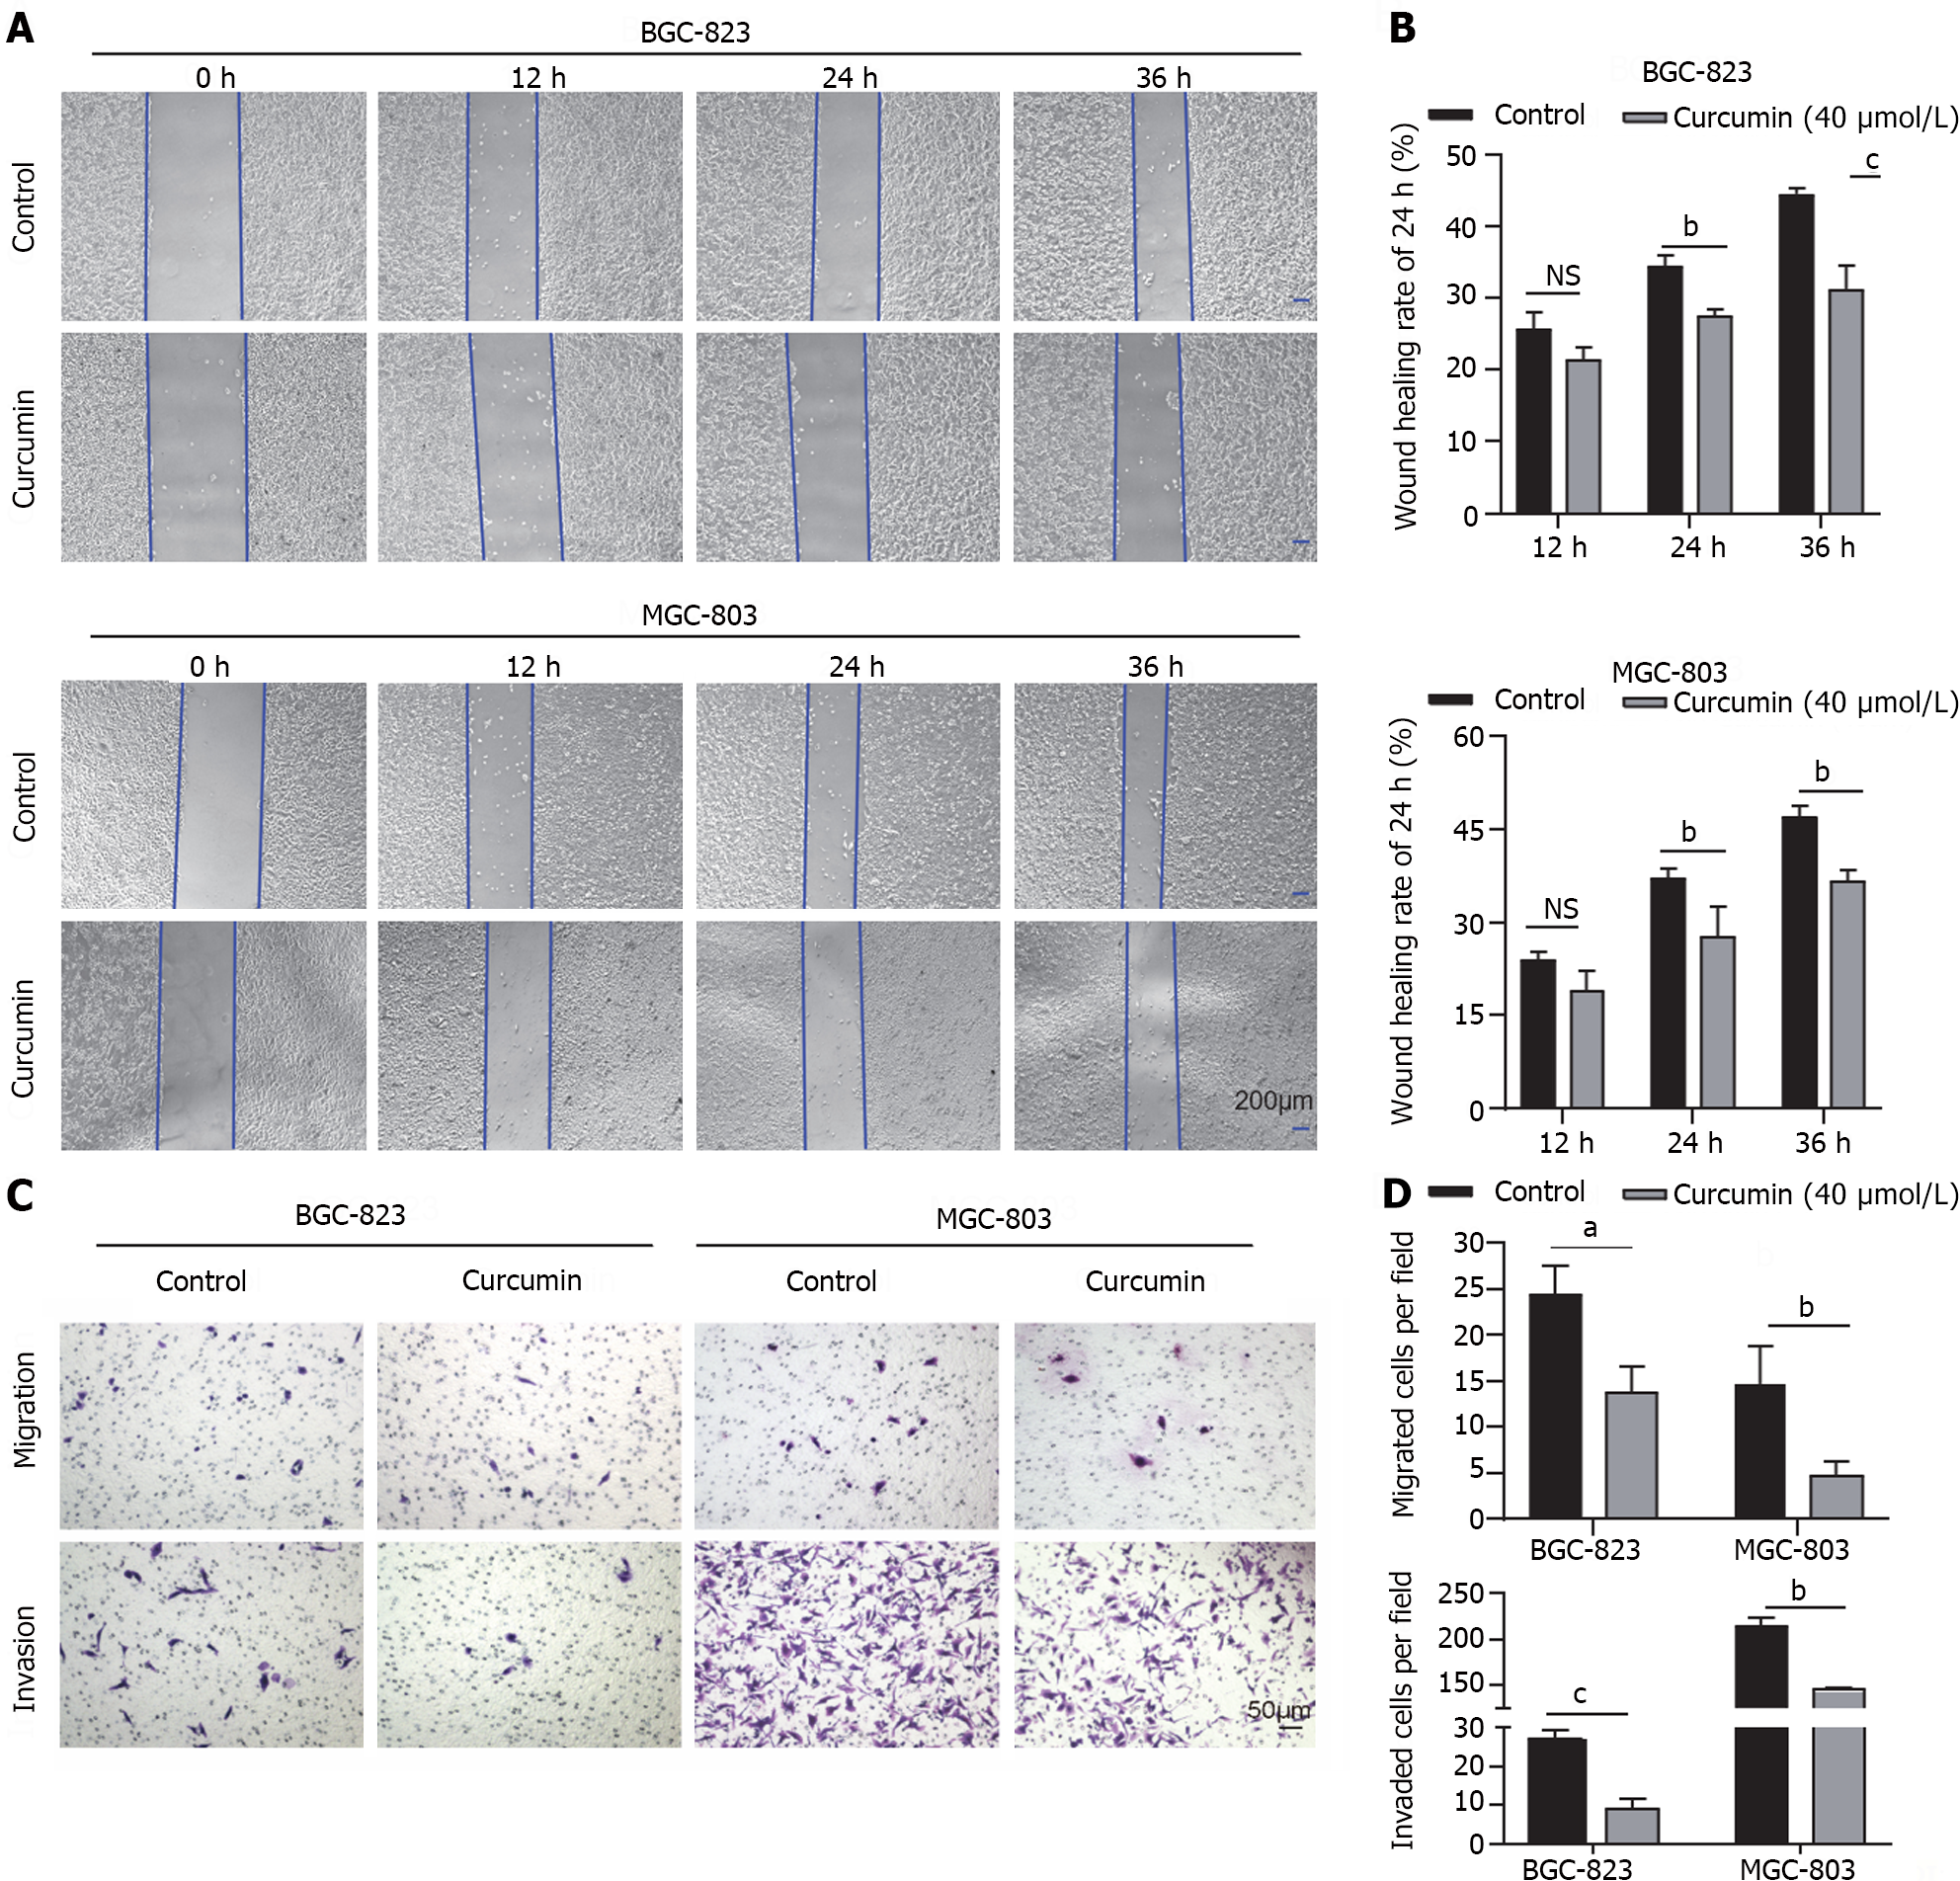
Figure 2 Inhibition of gastric cancer cell migration and invasion by curcumin.
A and B: Migration ability assessed by wound healing and Transwell migration and invasion assays. Curcumin (40 μmol/L) inhibited the migration of gastric cancer cells. Bar = 200 μm; C and D: In the Transwell assay, 40 μmol/L curcumin significantly inhibited the migration and invasion of BGC-823 and MGC-803 cells. Bar = 50 μm. The results were obtained from three independent tests. aP < 0.05, bP < 0.01, cP < 0.001.
Figure 3 Effects of curcumin on apoptosis and proliferation and AKT-mTOR pathway proteins.
A: After treating BGC-823 and MGC-803 cells with 40 μmol/L curcumin, the proteins involved in apoptosis and proliferation and the AKT-mTOR pathway were detected using western blotting. Curcumin (40 μmol/L) increased the expression of Bax-2 but decreased the expression of Bcl-2, CDK4, and CDK6 and decreased the phosphorylation of Akt, mTOR, and P65 in gastric cancer cells; B: Statistical graph of the western blotting results. The results were obtained from three independent tests. aP < 0.05, bP < 0.01, cP < 0.001.
Figure 4 Analysis of differentially expressed genes and lncRNAs between the curcumin-treated and control groups.
A: Volcano plot of differentially expressed genes. Red points indicate upregulated genes [Log2 (fold change)] > 1, P-value < 0.05; blue points represent downregulated genes [Log2 (fold change)] < -1, P-value < 0.05; and black points signify genes without significant differential expression; B: Cluster heatmap of gene expression. The color scale represents the Z-score values, where red indicates high expression and blue indicates low expression. Group 1: Untreated group; Group 2: Curcumin-treated group; C: The expression level of lncRNAs in BGC-823 was detected using quantitative reverse transcription polymerase chain reaction (qRT-PCR); D: The expression of lncRNAs in MGC-803 cells was detected using qRT-PCR. aP < 0.05, bP < 0.01, cP < 0.001.
Figure 5 Knockdown of lncRNA AC022424.
2 and its impact on cell proliferation. A and B: The knockdown efficiency of AC022424.2 was detected using quantitative real-time polymerase chain reaction for BGC-823 (A) and MGC-803 (B) cells; C and D: The proliferation of BGC-823 (C) and MGC-803 (D) cells was inhibited after the knockdown of lncRNA AC022424.2, as assessed using the CCK-8 assay. The results were obtained from three independent tests. bP < 0.01, cP < 0.001.
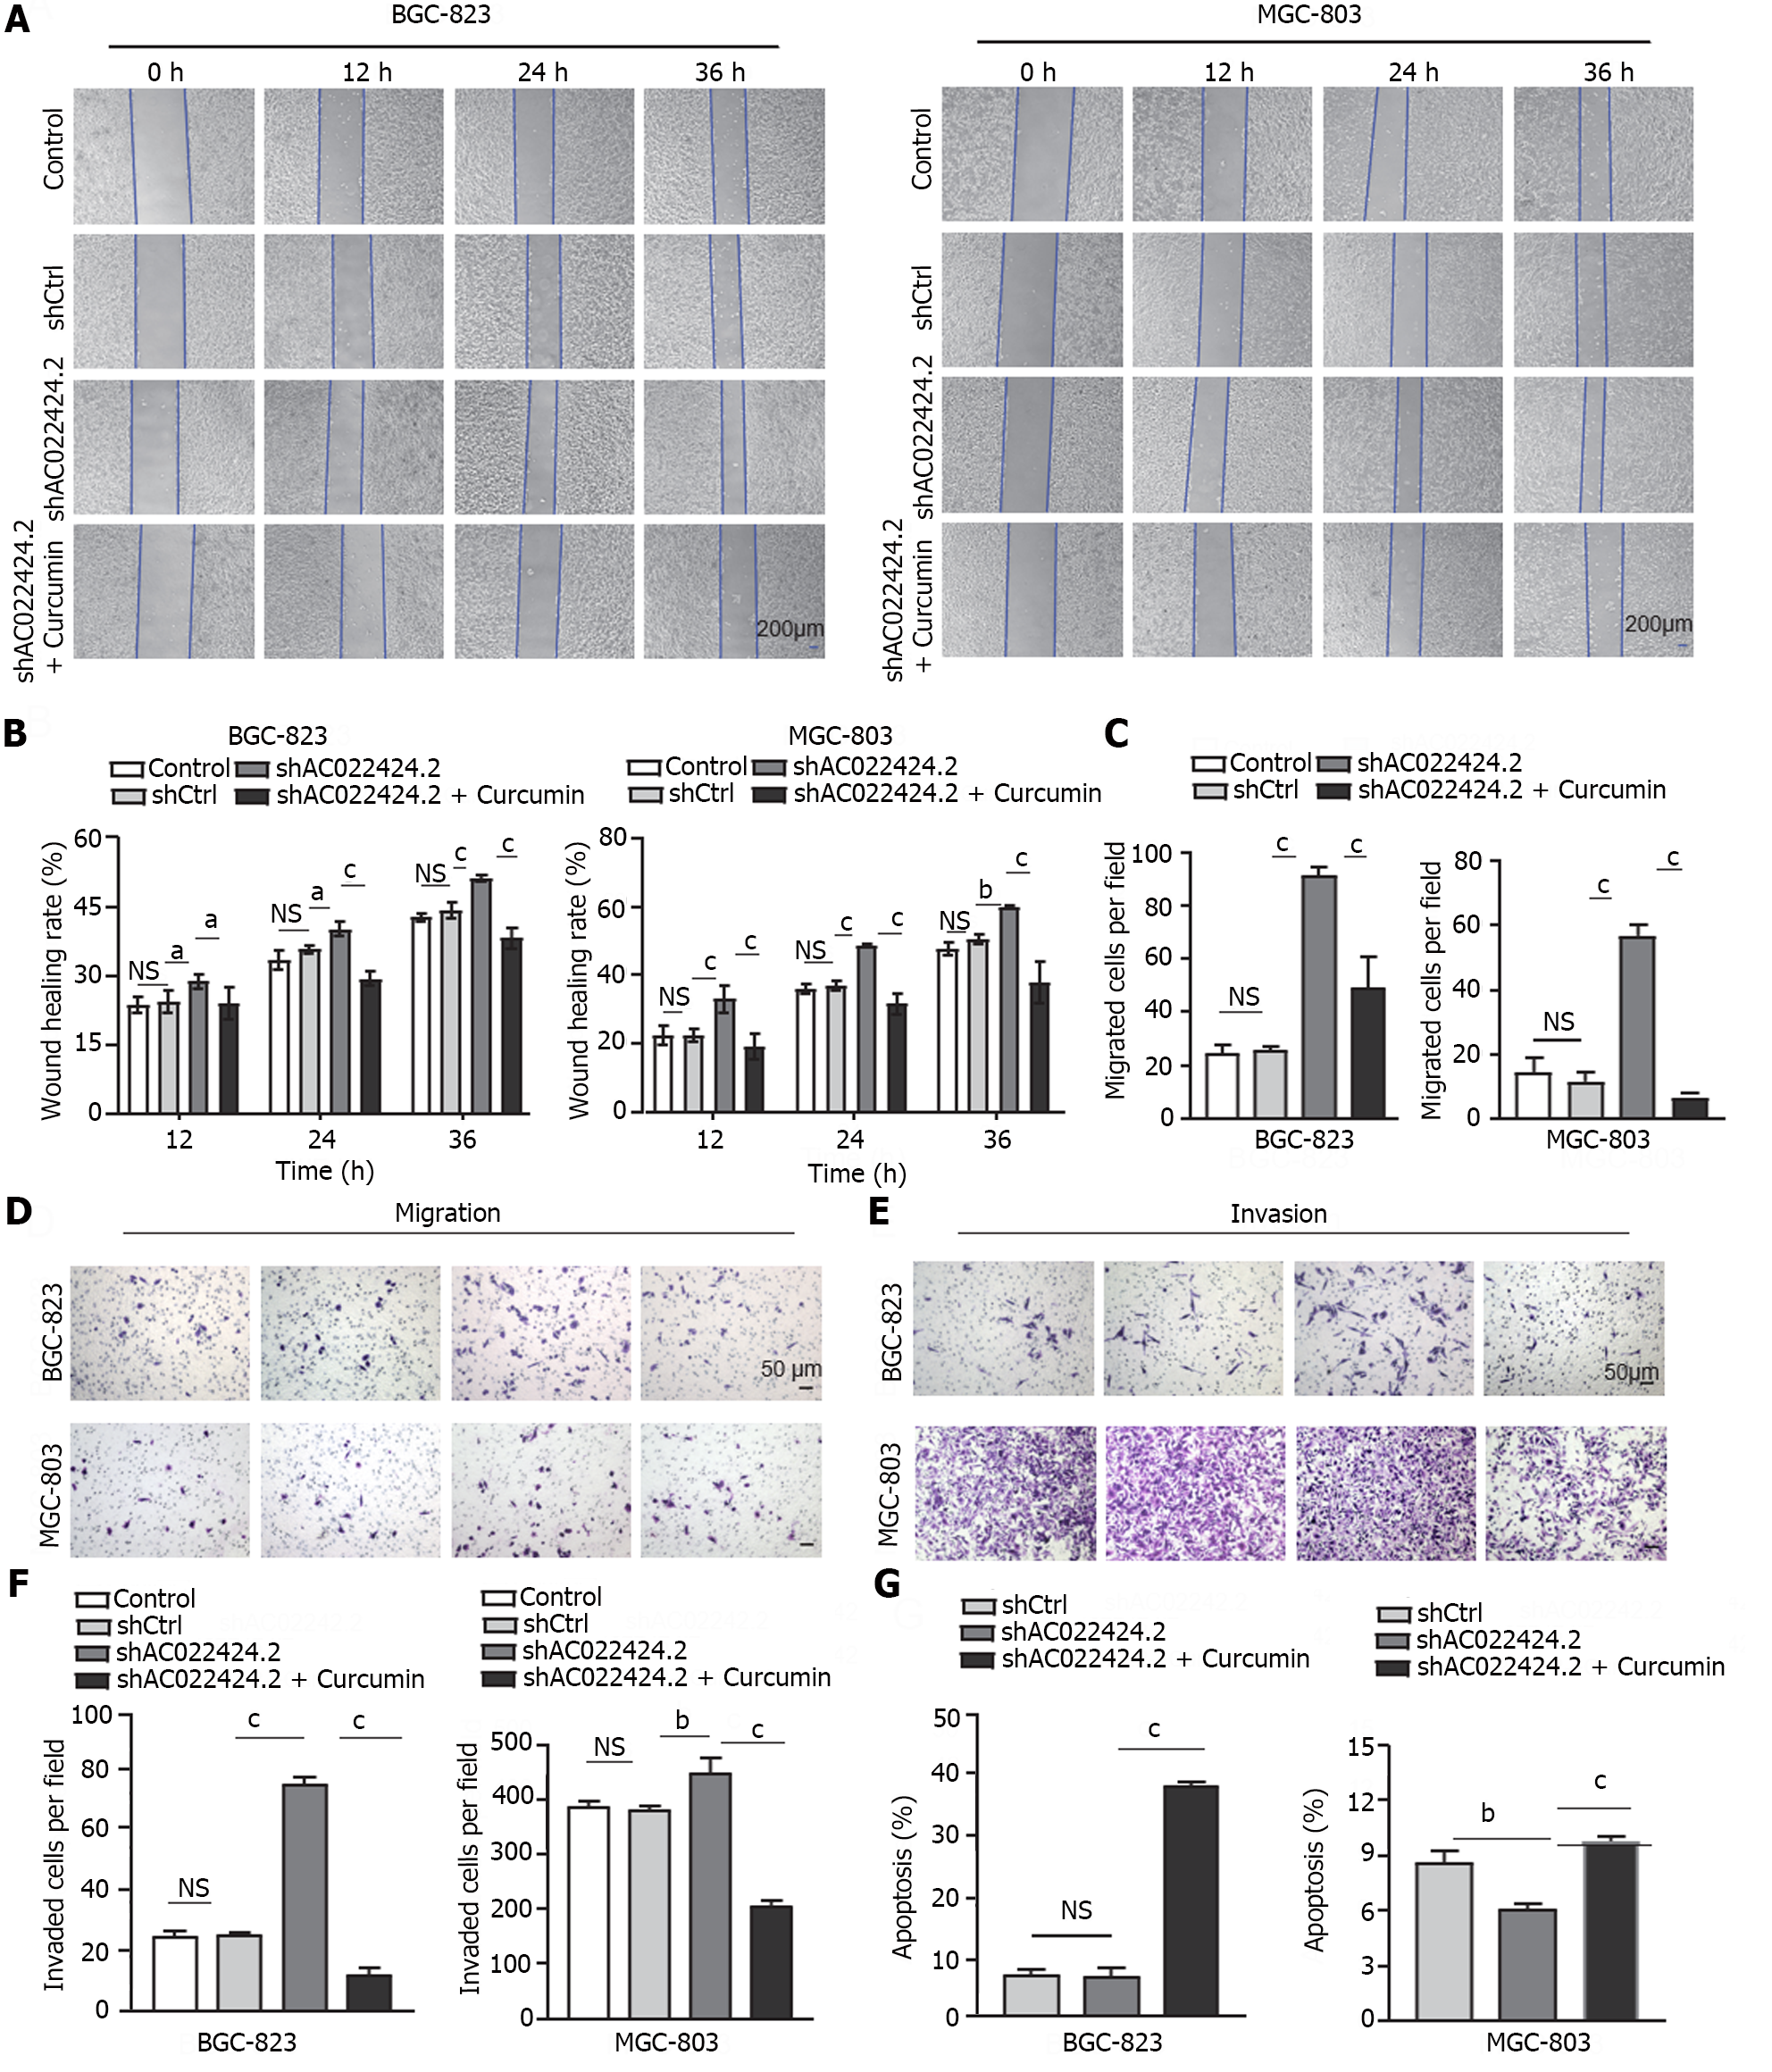
Figure 6 Influence of lncRNA AC022424.
2 on gastric cancer cell migration, invasion, and apoptosis. A-F: LncRNA AC022424.2 affected gastric cancer (GC) cell migration and invasion. After the knockdown of lncRNA AC022424.2, the migration ability of GC cells was assessed using wound healing (A and B) and Transwell migration assays (C and D), and the invasion ability of GC cells was measured using the Transwell invasion assays (E and F); G: Changes in the apoptosis of BGC-823 and MGC-803 cells after the knockdown of lncRNA AC022424.2. The results were obtained from three independent tests. aP < 0.05, bP < 0.01, cP < 0.001.
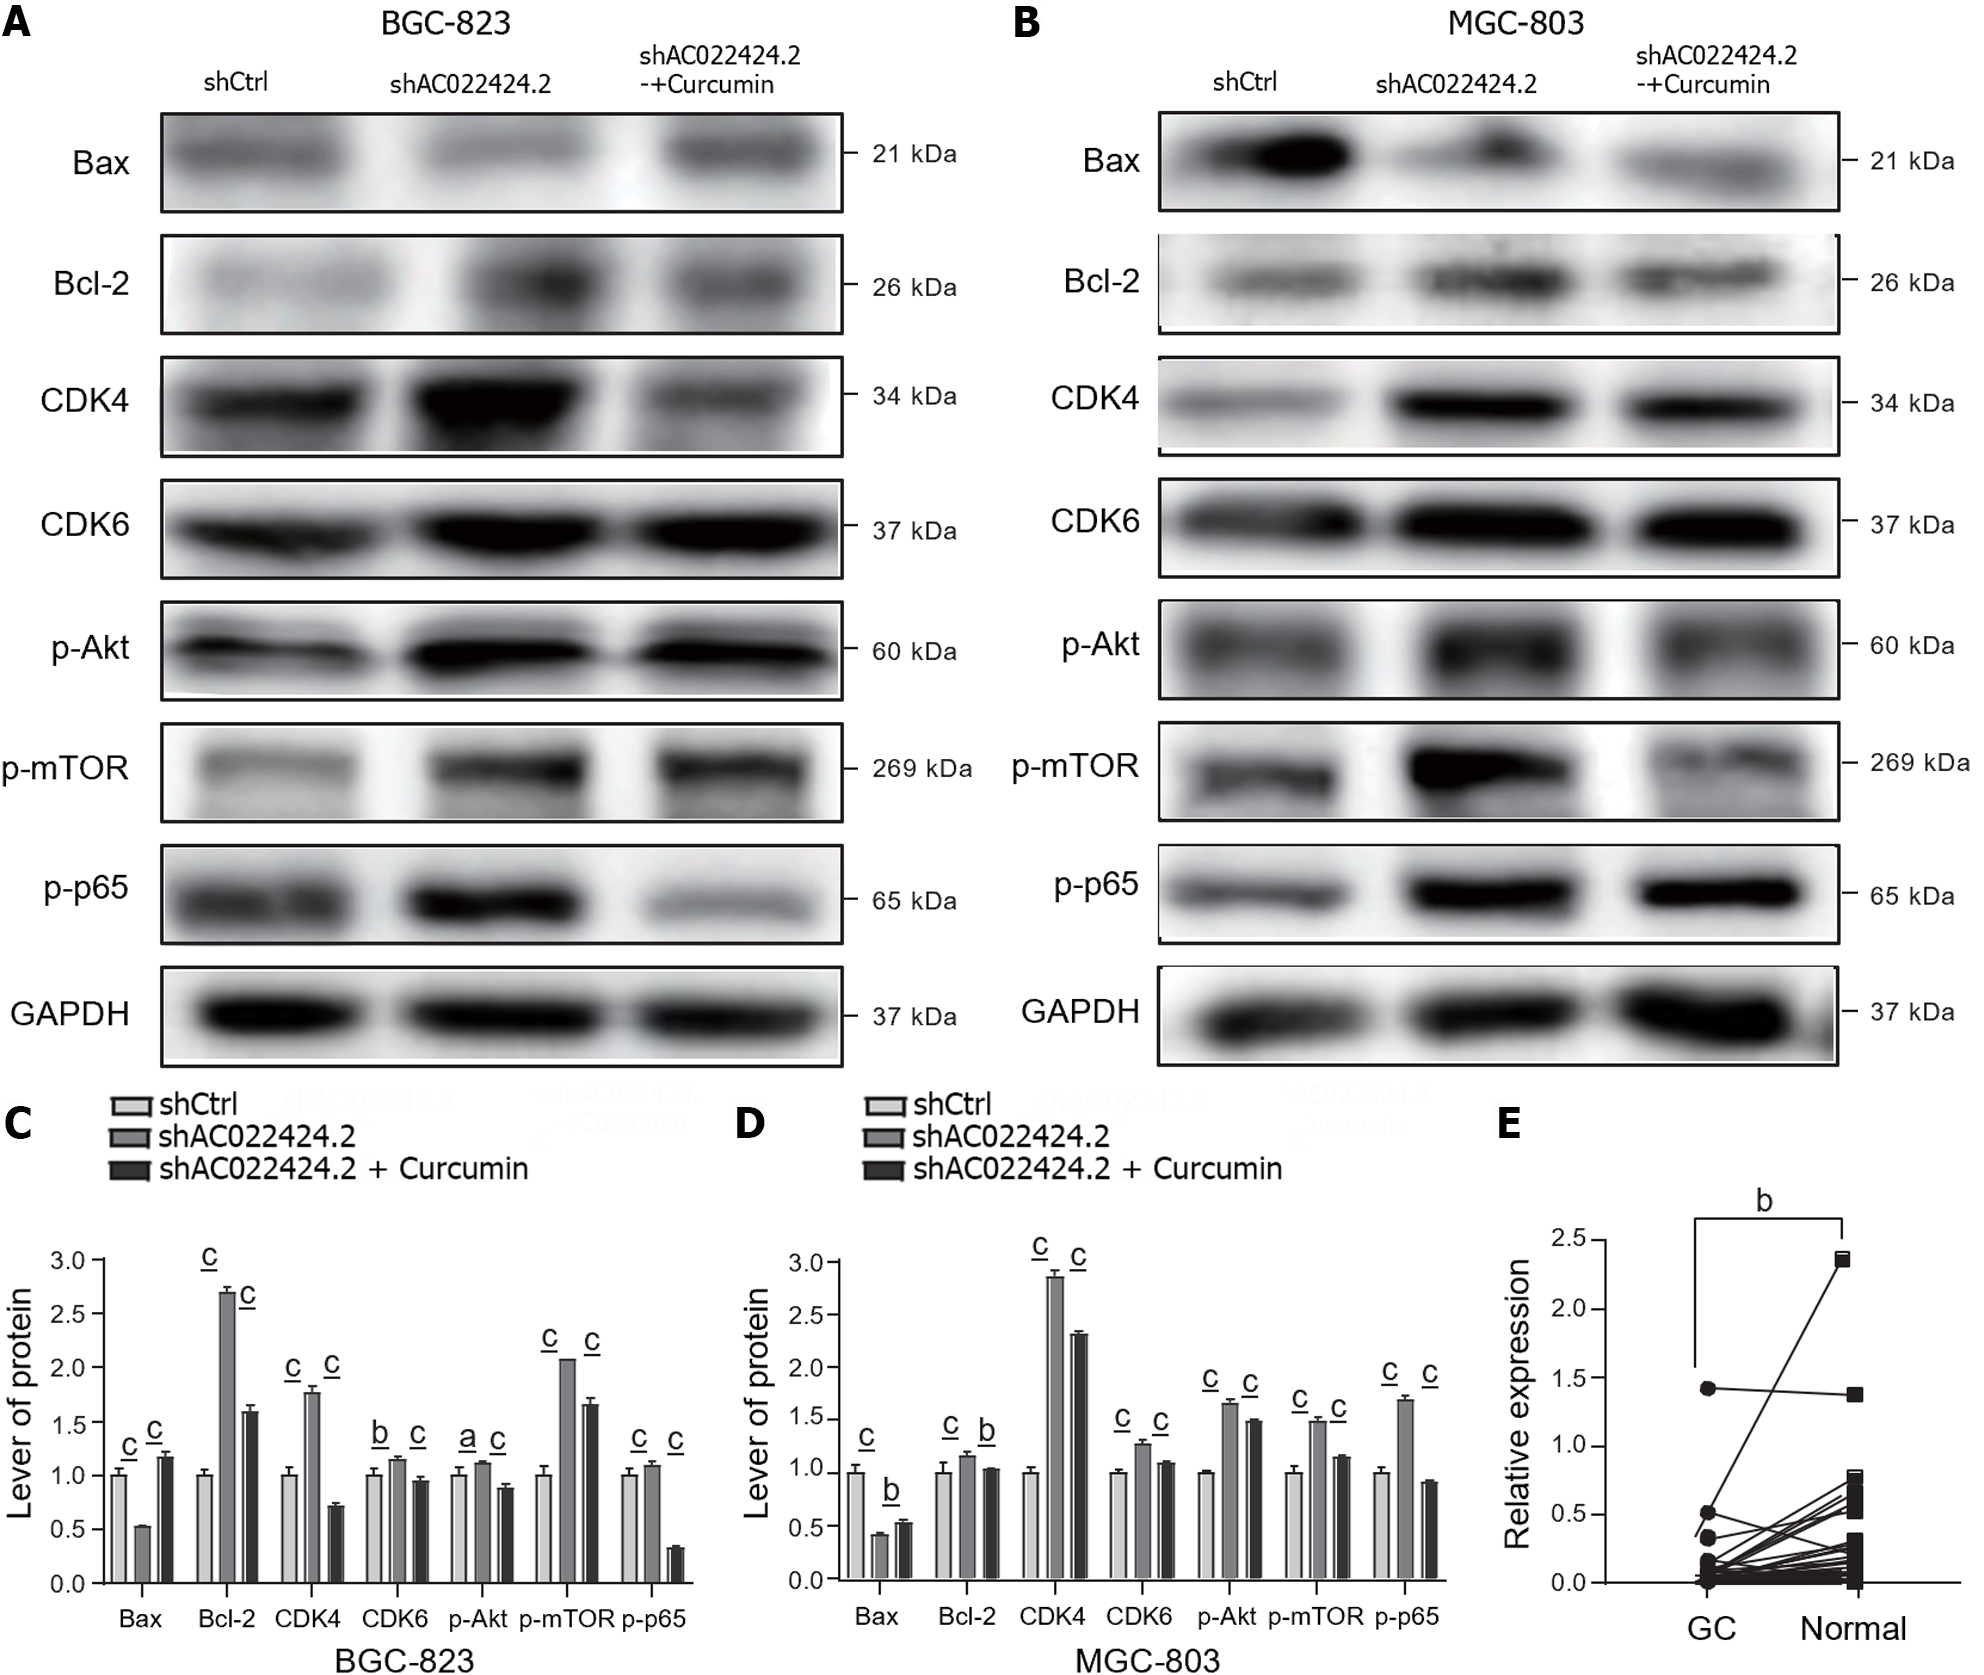
Figure 7 Protein expression changes in apoptosis and proliferation and the AKT-mTOR pathway.
A-D: Western blotting was used to detect the protein expression of apoptosis and proliferation and the AKT-mTOR pathway in BGC-823 and MGC-803 cells after silencing lncRNA AC022424.2; E: Changes in the expression of lncRNA AC022424.2 in cancer tissue and adjacent tissue samples from clinical patients were analyzed using quantitative reverse transcription polymerase chain reaction. The results were obtained from three independent tests. aP < 0.05, bP < 0.01, cP < 0.001.
- Citation: Wang BS, Zhang CL, Cui X, Li Q, Yang L, He ZY, Yang Z, Zeng MM, Cao N. Curcumin inhibits the growth and invasion of gastric cancer by regulating long noncoding RNA AC022424.2. World J Gastrointest Oncol 2024; 16(4): 1437-1452
- URL: https://www.wjgnet.com/1948-5204/full/v16/i4/1437.htm
- DOI: https://dx.doi.org/10.4251/wjgo.v16.i4.1437


