Copyright
©The Author(s) 2024.
World J Gastrointest Oncol. Feb 15, 2024; 16(2): 364-371
Published online Feb 15, 2024. doi: 10.4251/wjgo.v16.i2.364
Published online Feb 15, 2024. doi: 10.4251/wjgo.v16.i2.364
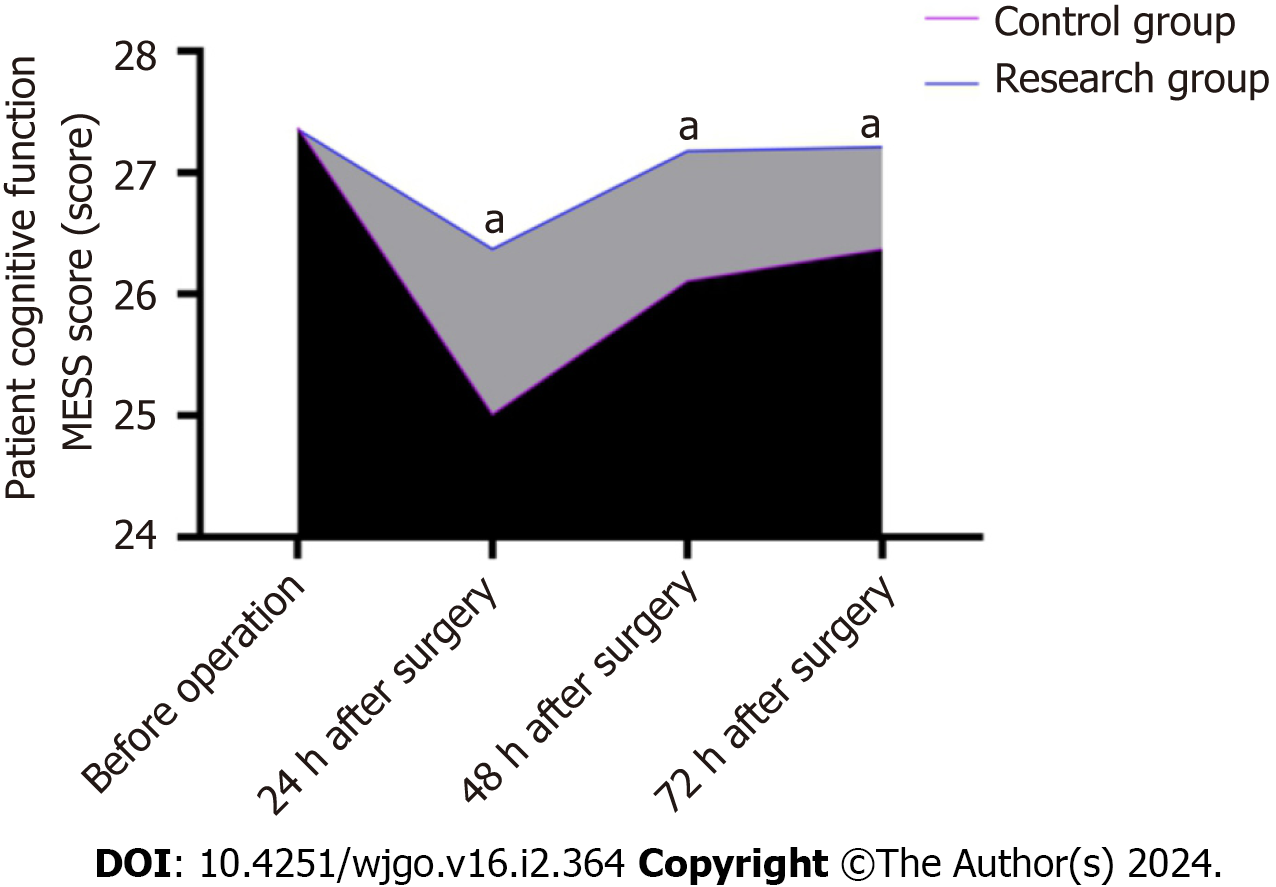
Figure 1 Comparative of negative emotions.
aP < 0.05, the difference was statistically significant in comparison to control group (note: Period in comparison to the control group, the cognitive Mangled Extremity Severity Score of patients in the research group increased remarkably at 24 h, 48 h, and 72 h following the procedure, and the cognitive function of patients in the research group was more stable, P < 0.05). MESS: Mangled Extremity Severity Score.
Figure 2 Comparative of blood glucose indicators.
A: Interleukin-6 levels of patients were compared at 6, 12, 24, 48 h following the procedure; B: Interleukin-10 levels of patients were compared at 6, 12, 24, 48 h following the procedure; C: TNF-α levels of patients were compared at 6, 12, 24, 48 h following the procedure. aP < 0.05, the difference was statistically significant in comparison to control group. Note: Comparison to the control, interleukin-6 levels of patients in the research group were remarkably decreased at 6, 12, 24, 48 h following the procedure, P < 0.05; In comparison to the control, the interleukin-10 level in the research group was remarkably decreased at 12 h, 24 h, and 48 h following the procedure, P < 0.05. There was no significant change in tumor necrosis factor-α level at different times, P > 0.05. IL-6: Interleukin-6; IL-10: Interleukin-10; TNF-α: Tumor necrosis factor-α.
Figure 3 Comparative of renal function indicators.
A: CD3 levels of patients were compared at 6, 12, 24, 48 h following the procedure; B: CD4 levels of patients were compared at 6, 12, 24, 48 h following the procedure; C: CD3/CD8 levels of patients were compared at 6, 12, 24, 48 h following the procedure. aP < 0.05, the difference was statistically significant in comparison to research group. Note: In comparison to the research group, the level of CD3+ in the control group was remarkably decreased at 6, 12, 24, 48 h following the procedure, P < 0.05. In comparison to the research group, CD4+ levels in the research group were remarkably decreased at 6, 12, 24, 48 h following the procedure, P < 0.05. In comparison to the research group, the levels of CD4+/CD8+ in the research group were remarkably decreased at 6, 12, 24, 48 h following the procedure, P < 0.05.
- Citation: Tang JC, Ma JW, Jian JJ, Shen J, Cao LL. Effect of different anesthetic modalities with multimodal analgesia on postoperative pain level in colorectal tumor patients. World J Gastrointest Oncol 2024; 16(2): 364-371
- URL: https://www.wjgnet.com/1948-5204/full/v16/i2/364.htm
- DOI: https://dx.doi.org/10.4251/wjgo.v16.i2.364


