Copyright
©The Author(s) 2024.
World J Gastrointest Oncol. Oct 15, 2024; 16(10): 4209-4231
Published online Oct 15, 2024. doi: 10.4251/wjgo.v16.i10.4209
Published online Oct 15, 2024. doi: 10.4251/wjgo.v16.i10.4209
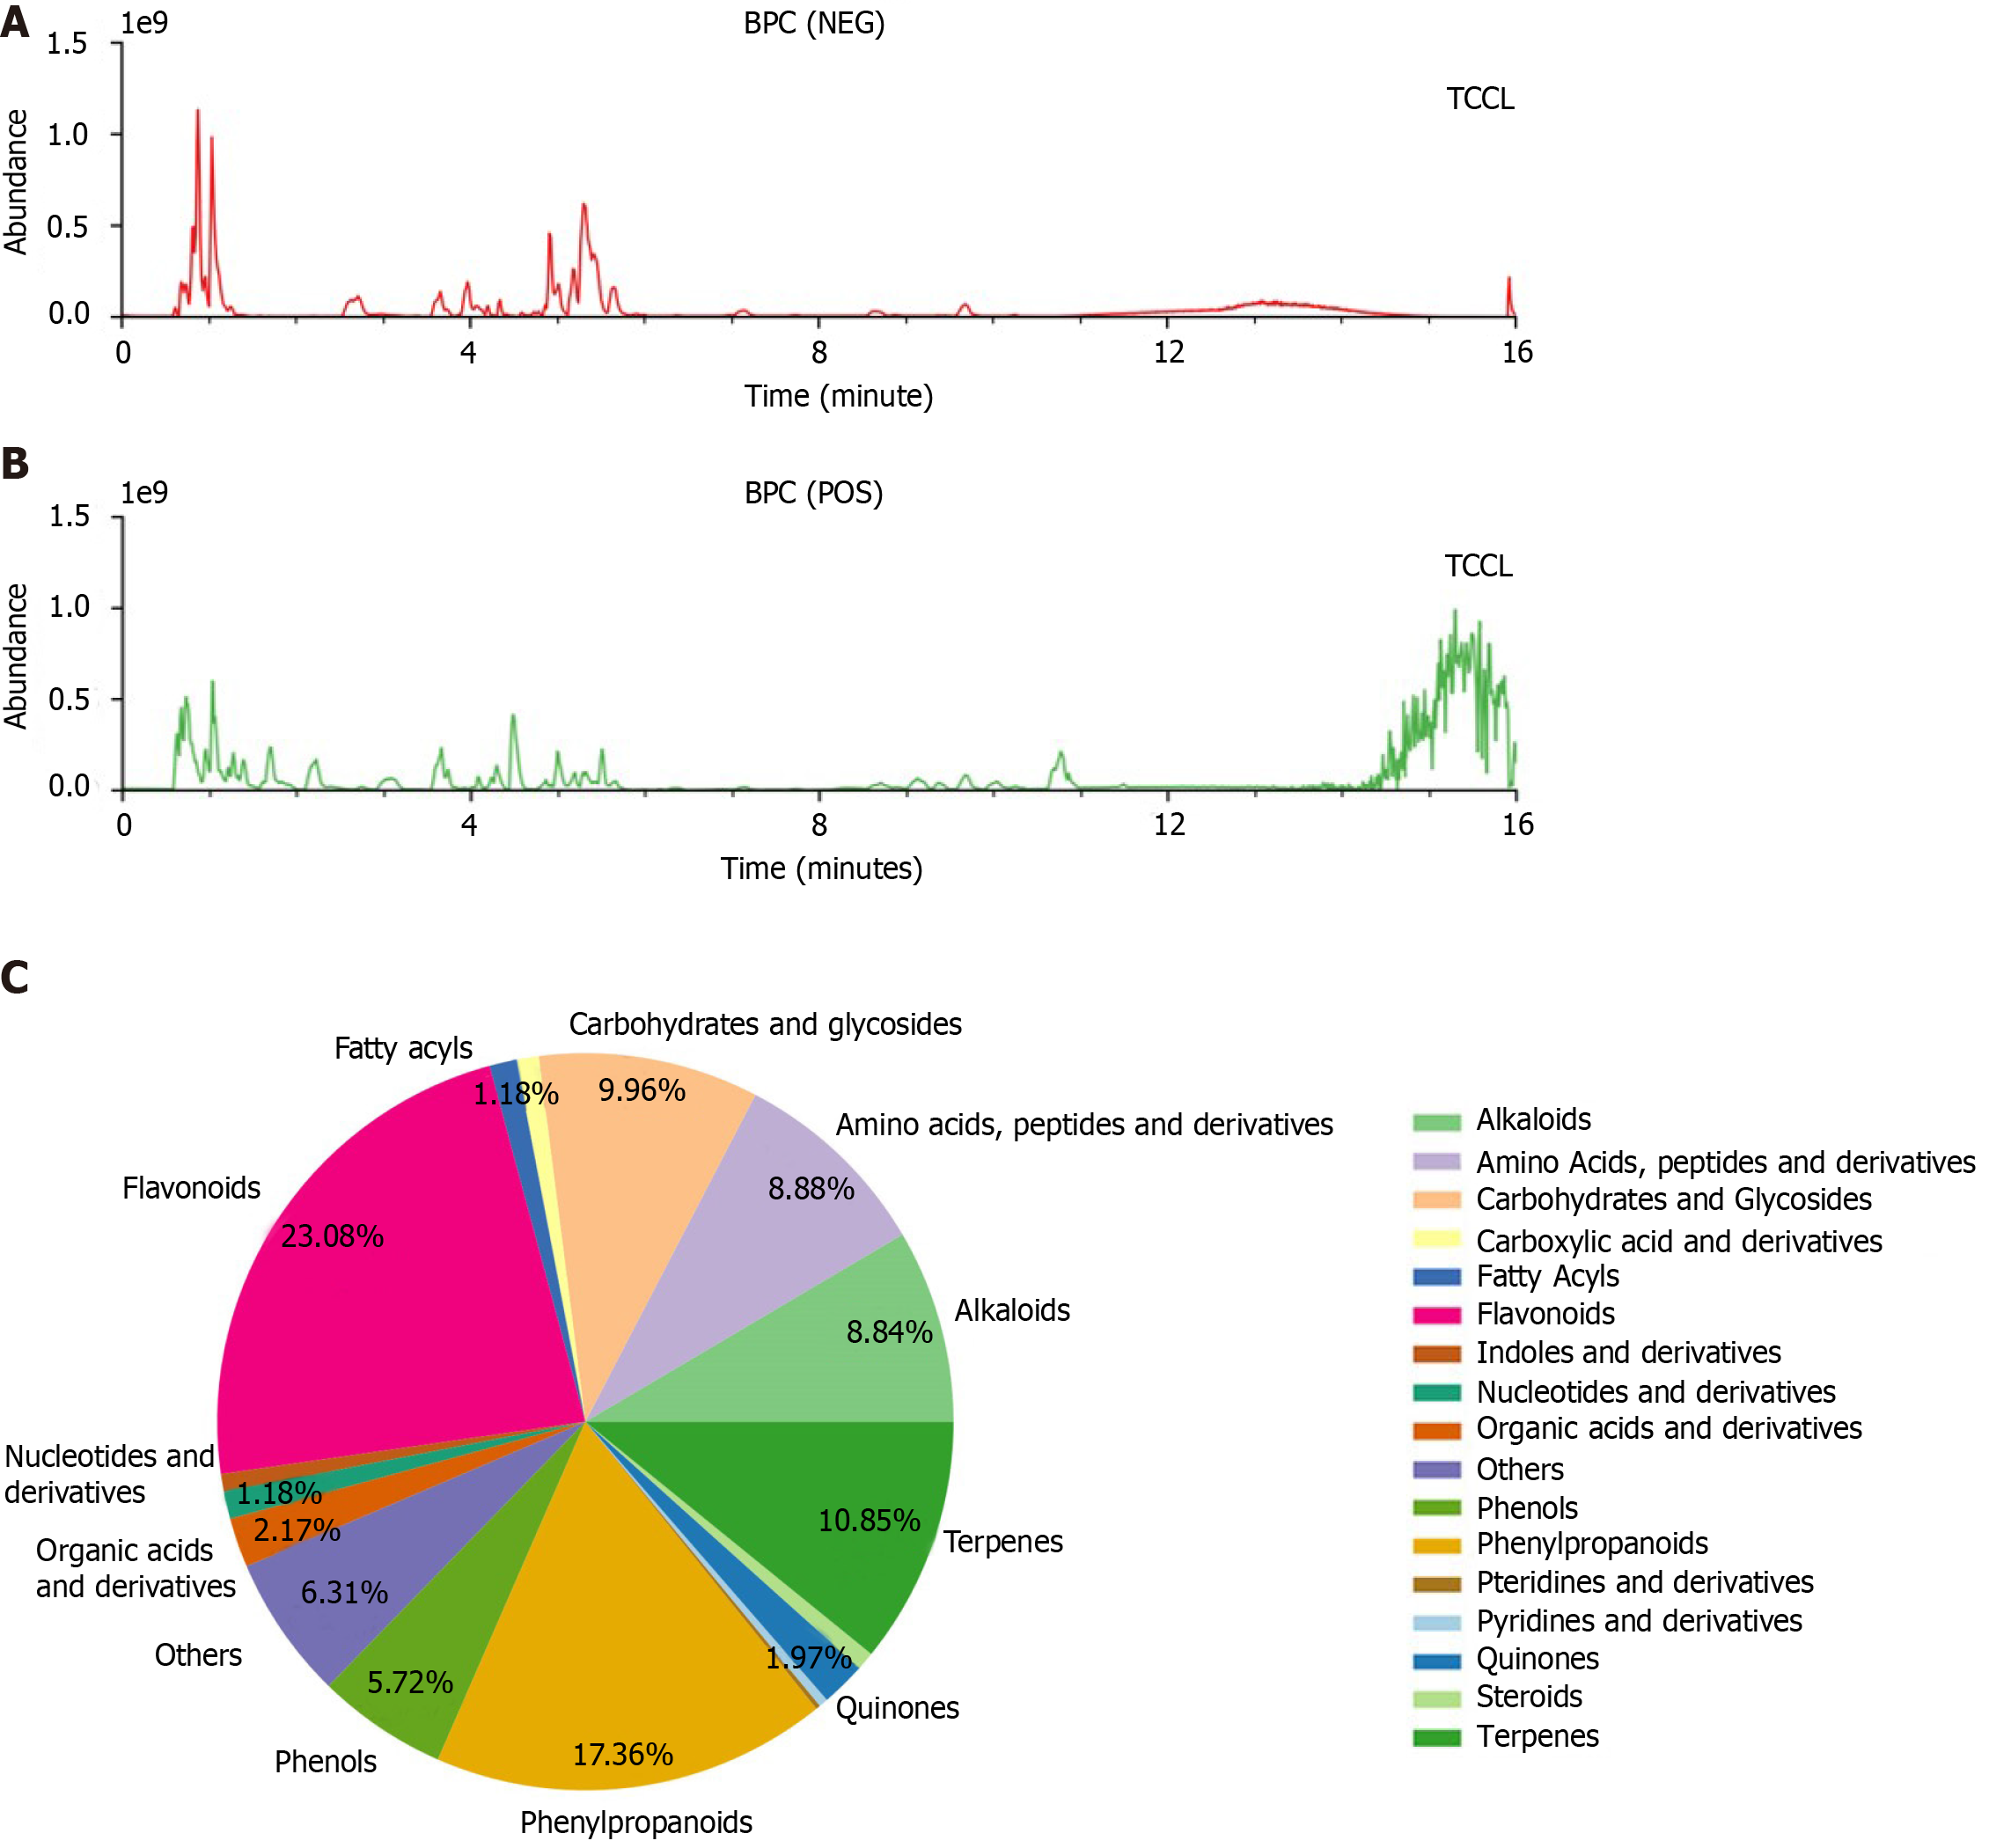
Figure 1 Base peak chromatograms of Tzu-Chi cancer-antagonizing & life-protecting II decoction.
A: Negative ion mode; B: Positive ion mode; C: Classification and quantity distribution of Tzu-Chi cancer-antagonizing & life-protecting II decoction components (C). BPC: Base peak chromatogram; TCCL: Tzu-Chi cancer-antagonizing & life-protecting II decoction; NEG: Negative; POS: Positive.
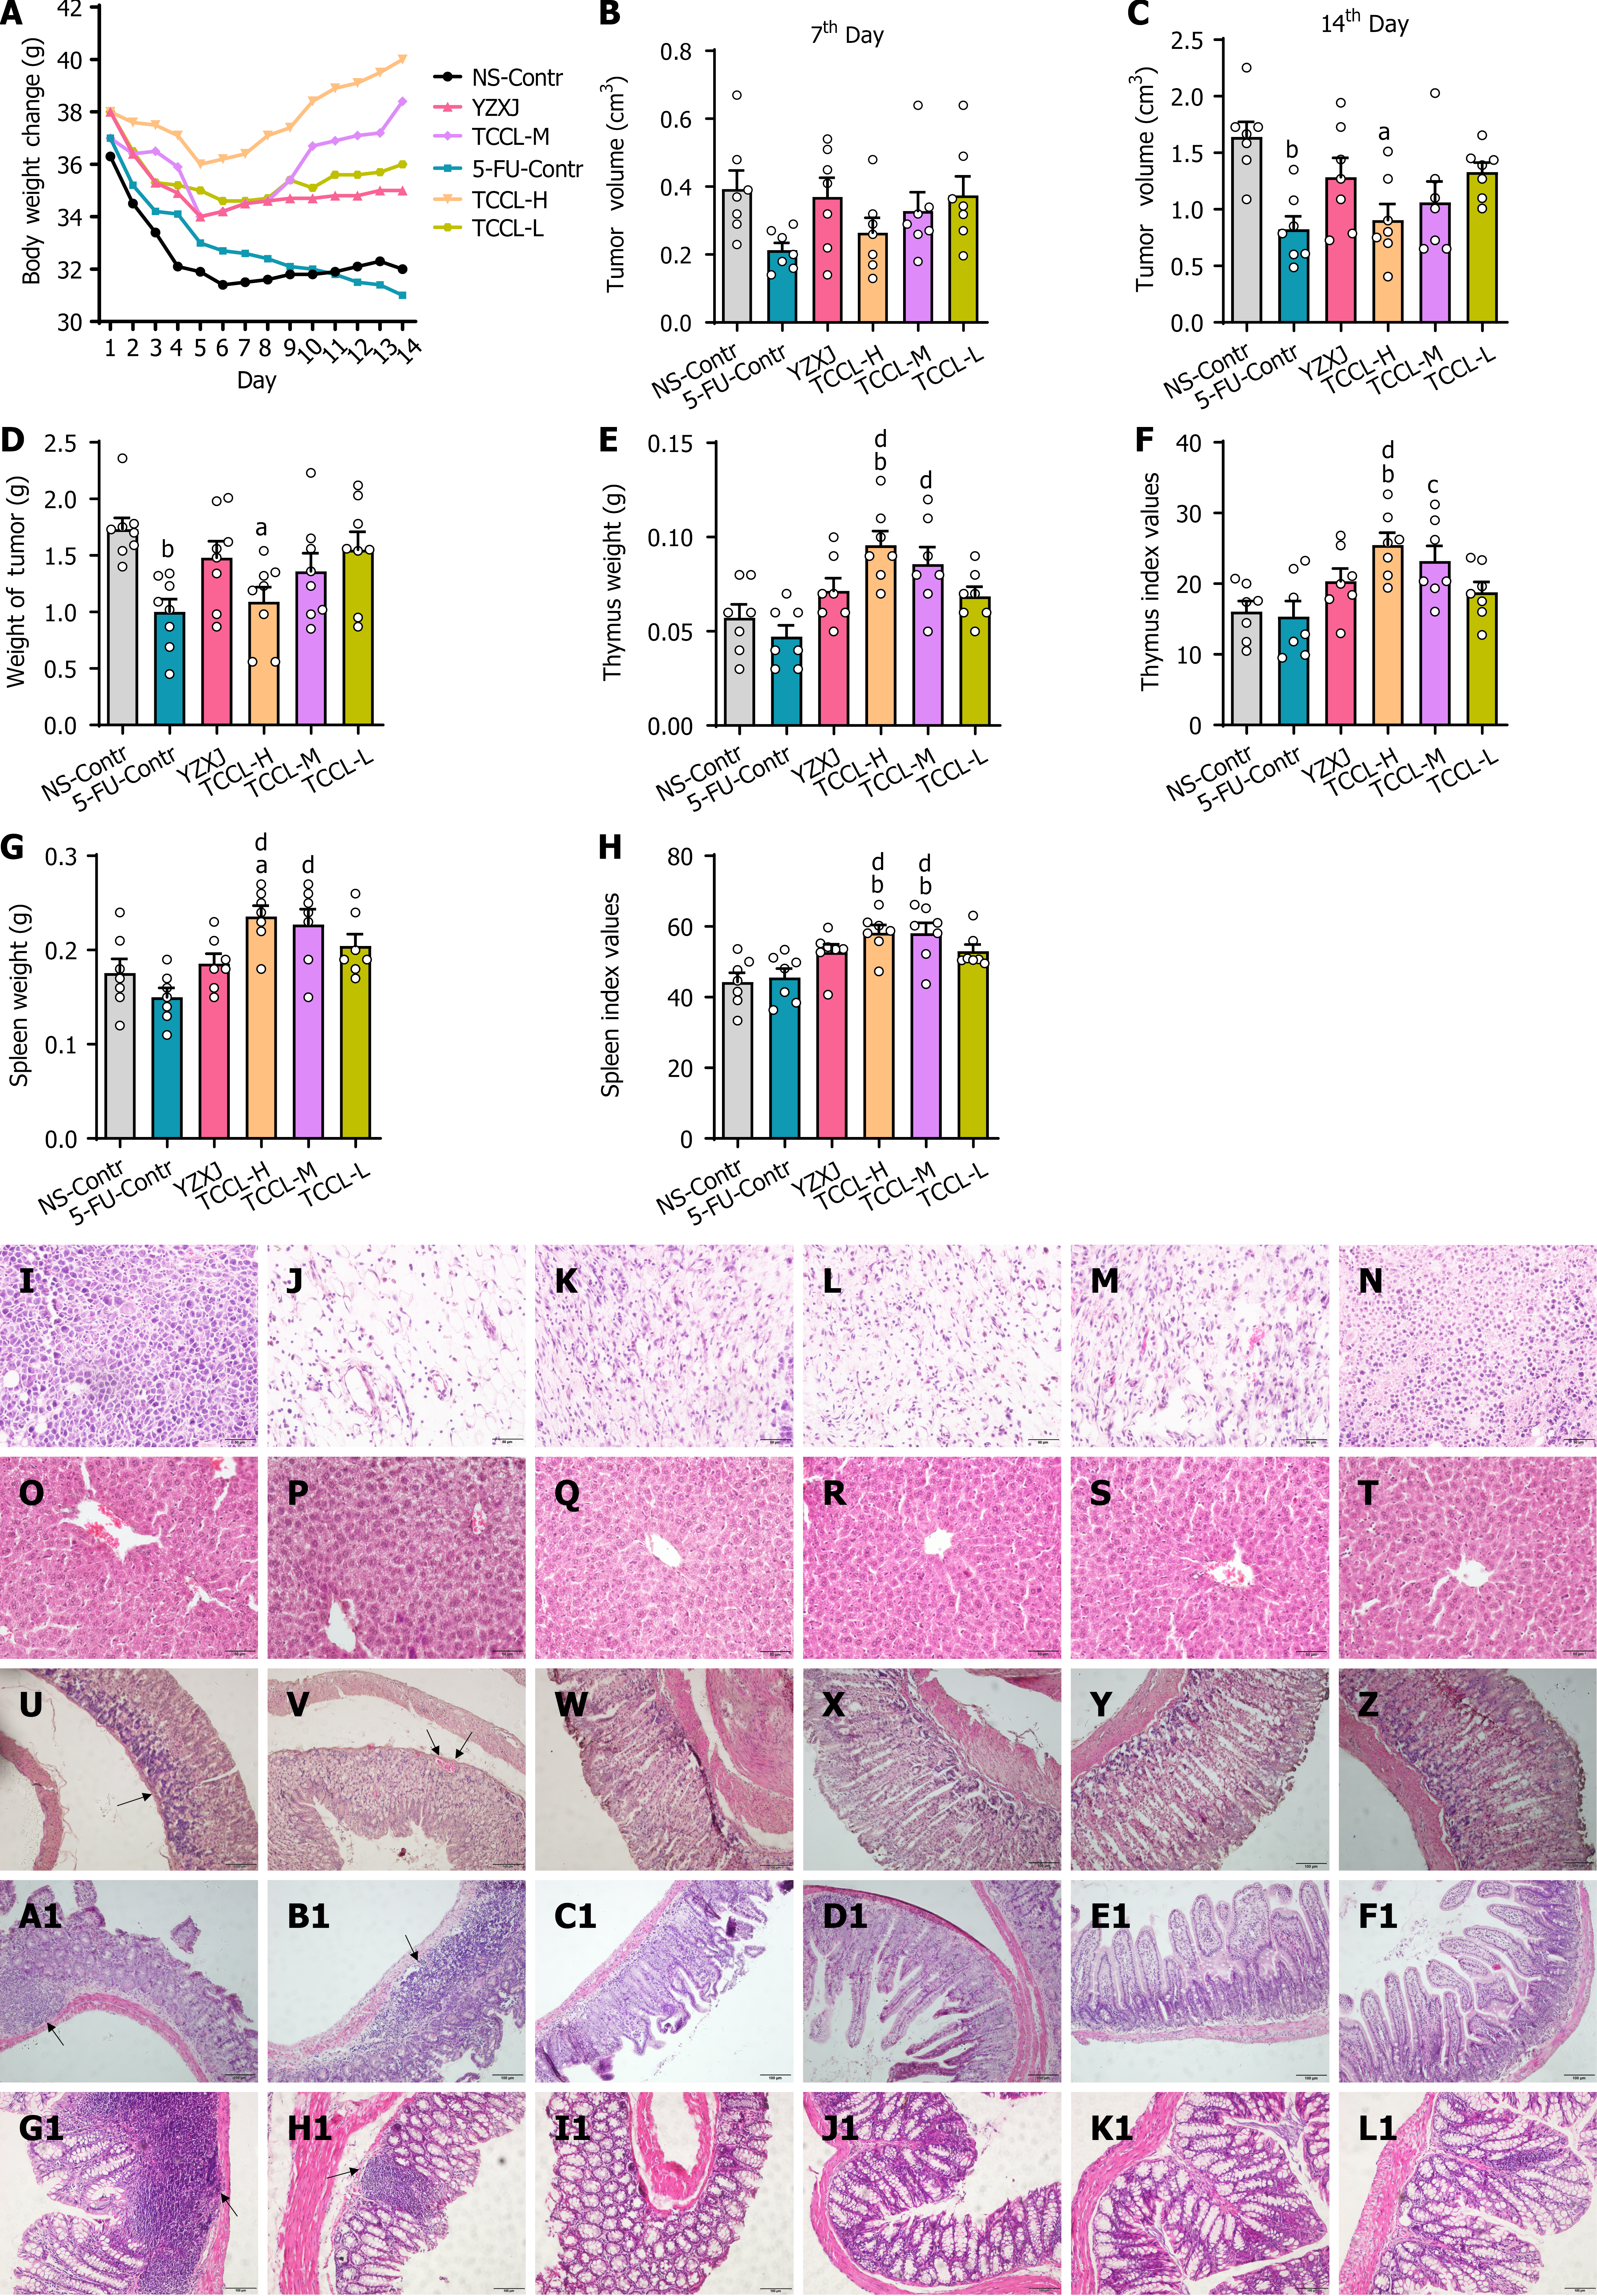
Figure 2 Tzu-Chi cancer-antagonizing & life-protecting II decoction effectively improves body weight, tumor weight/volume, pathological changes in tumors and the liver, thymus and spleen weight, thymus and spleen indexes, and pathological changes in the stomach, ileum, and colon of H22 hepatocellular carcinoma mice after chemotherapy.
Hematoxylin/eosin-stained tissue sections were observed by light microscopy (magnification, × 400). A: Body weight change; B: Tumor volume (7th day); C: Tumor volume (14th day); D-H: Analysis of tumor weight (D), thymus weight (E), thymus index (F), spleen weight (G), and spleen index (H); I-L1: Pathological changes of tumor tissue (I-N), liver tissue (O-T), stomach tissue (U-Z), ileum tissue (A1-F1), and colon tissue (G1-L1) in different groups; I, O, U, A1 and G1: NS-Contr (saline-treated control); J, P, V, B1, and H1: 5-FU-Contr (25 mg/kg); K, Q, W, C1, and I1: Yangzhengxiaoji capsules (0.78 g/kg); L, R, X, D1, and J1: Tzu-Chi cancer-antagonizing & life-protecting II decoction (TCCL)-H (17.6 g/kg); M, S, Y, E1, and K1: TCCL-M (8.8 g/kg); N, T, Z, F1, and L1: TCCL-L (4.4 g/kg). The scale bars for I to T are 50 μm. The scale bars for U to Z and A1 to L1 are 100 μm. Data with error bars are represented as the mean ± SD (n = 6 or 7). aP < 0.05 vs NS-Contr; bP < 0.01 vs NS-Contr; cP < 0.05 vs 5-fluorouracil (FU)-Contr; dP < 0.01 vs 5-FU-Contr, one-way ANOVA. 5-FU: 5-fluorouracil; YZXJ: Yangzhengxiaoji capsules; TCCL-H: High-dose Tzu-Chi cancer-antagonizing & life-protecting II decoction; TCCL-M: Medium-dose Tzu-Chi cancer-antagonizing & life-protecting II decoction; TCCL-L: Low-dose Tzu-Chi cancer-antagonizing & life-protecting II decoction.
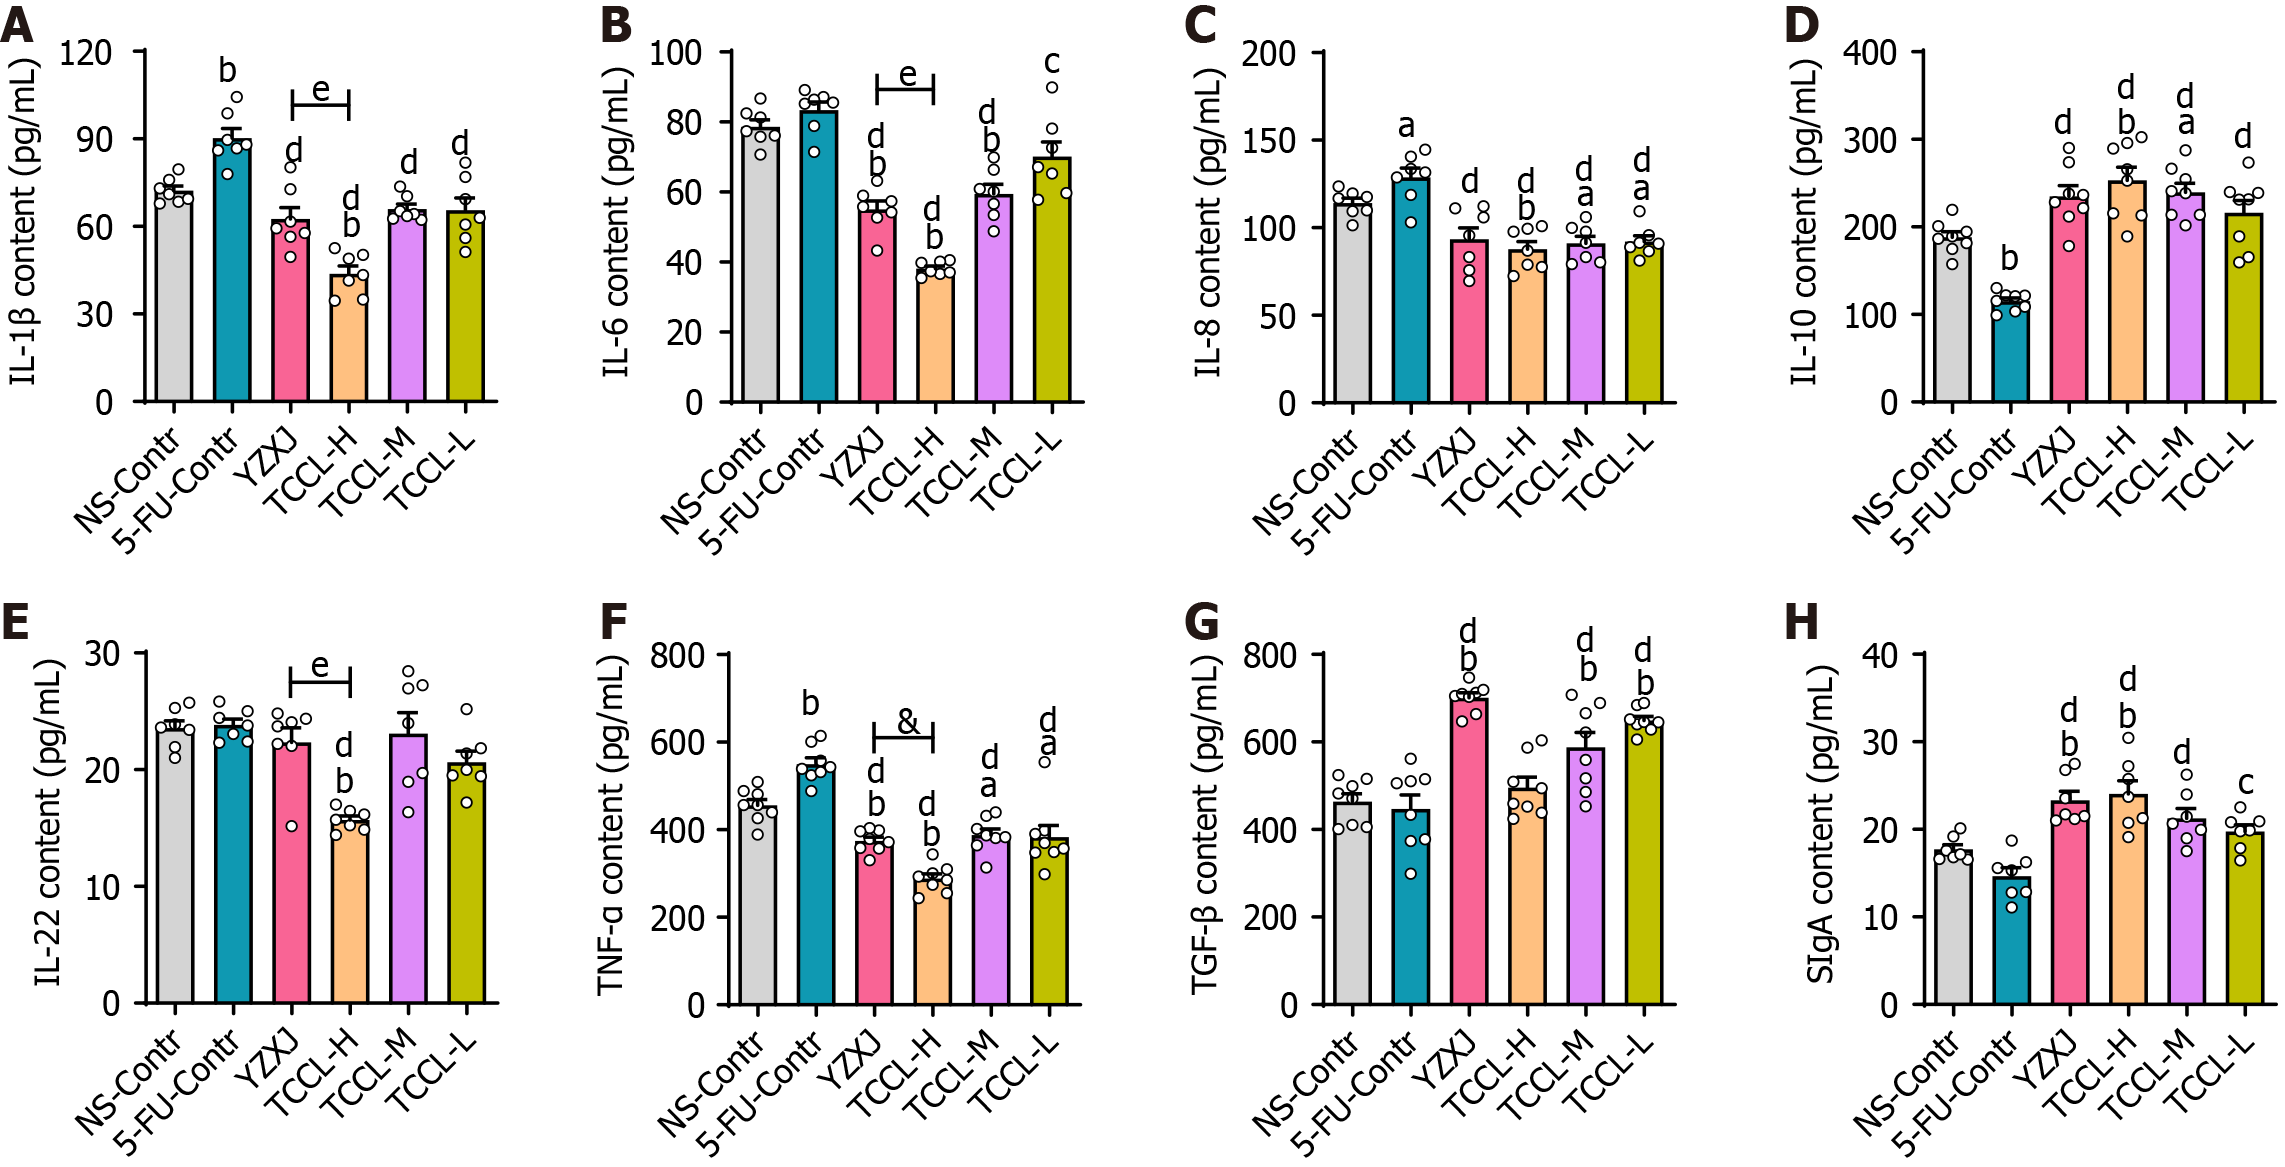
Figure 3 Effects of Tzu-Chi cancer-antagonizing & life-protecting II decoction on serum IL-1β, IL-6, IL-8, IL-22, IL-10, TNF-α, and TGF-β and intestinal SIgA in chemotherapy-treated H22 hepatocellular carcinoma mice.
A-G: Contents of serum IL-1β (A), IL-6 (B), IL-8 (C), IL-10 (D), IL-22 (E), TNF-α(F), and TGF-β (G); H: Intestinal SIgA content. Data with error bars are represented as the mean ± SD (n = 6 or 7). aP < 0.05 vs NS-Contr; bP < 0.01 vs NS-Contr; cP < 0.05 vs 5-fluorouracil (FU)-Contr; dP < 0.01 vs 5-FU-Contr, one-way ANOVA. 5-FU: 5-fluorouracil; YZXJ: Yangzhengxiaoji capsules; TCCL-H: High-dose Tzu-Chi cancer-antagonizing & life-protecting II decoction; TCCL-M: Medium-dose Tzu-Chi cancer-antagonizing & life-protecting II decoction; TCCL-L: Low-dose Tzu-Chi cancer-antagonizing & life-protecting II decoction.
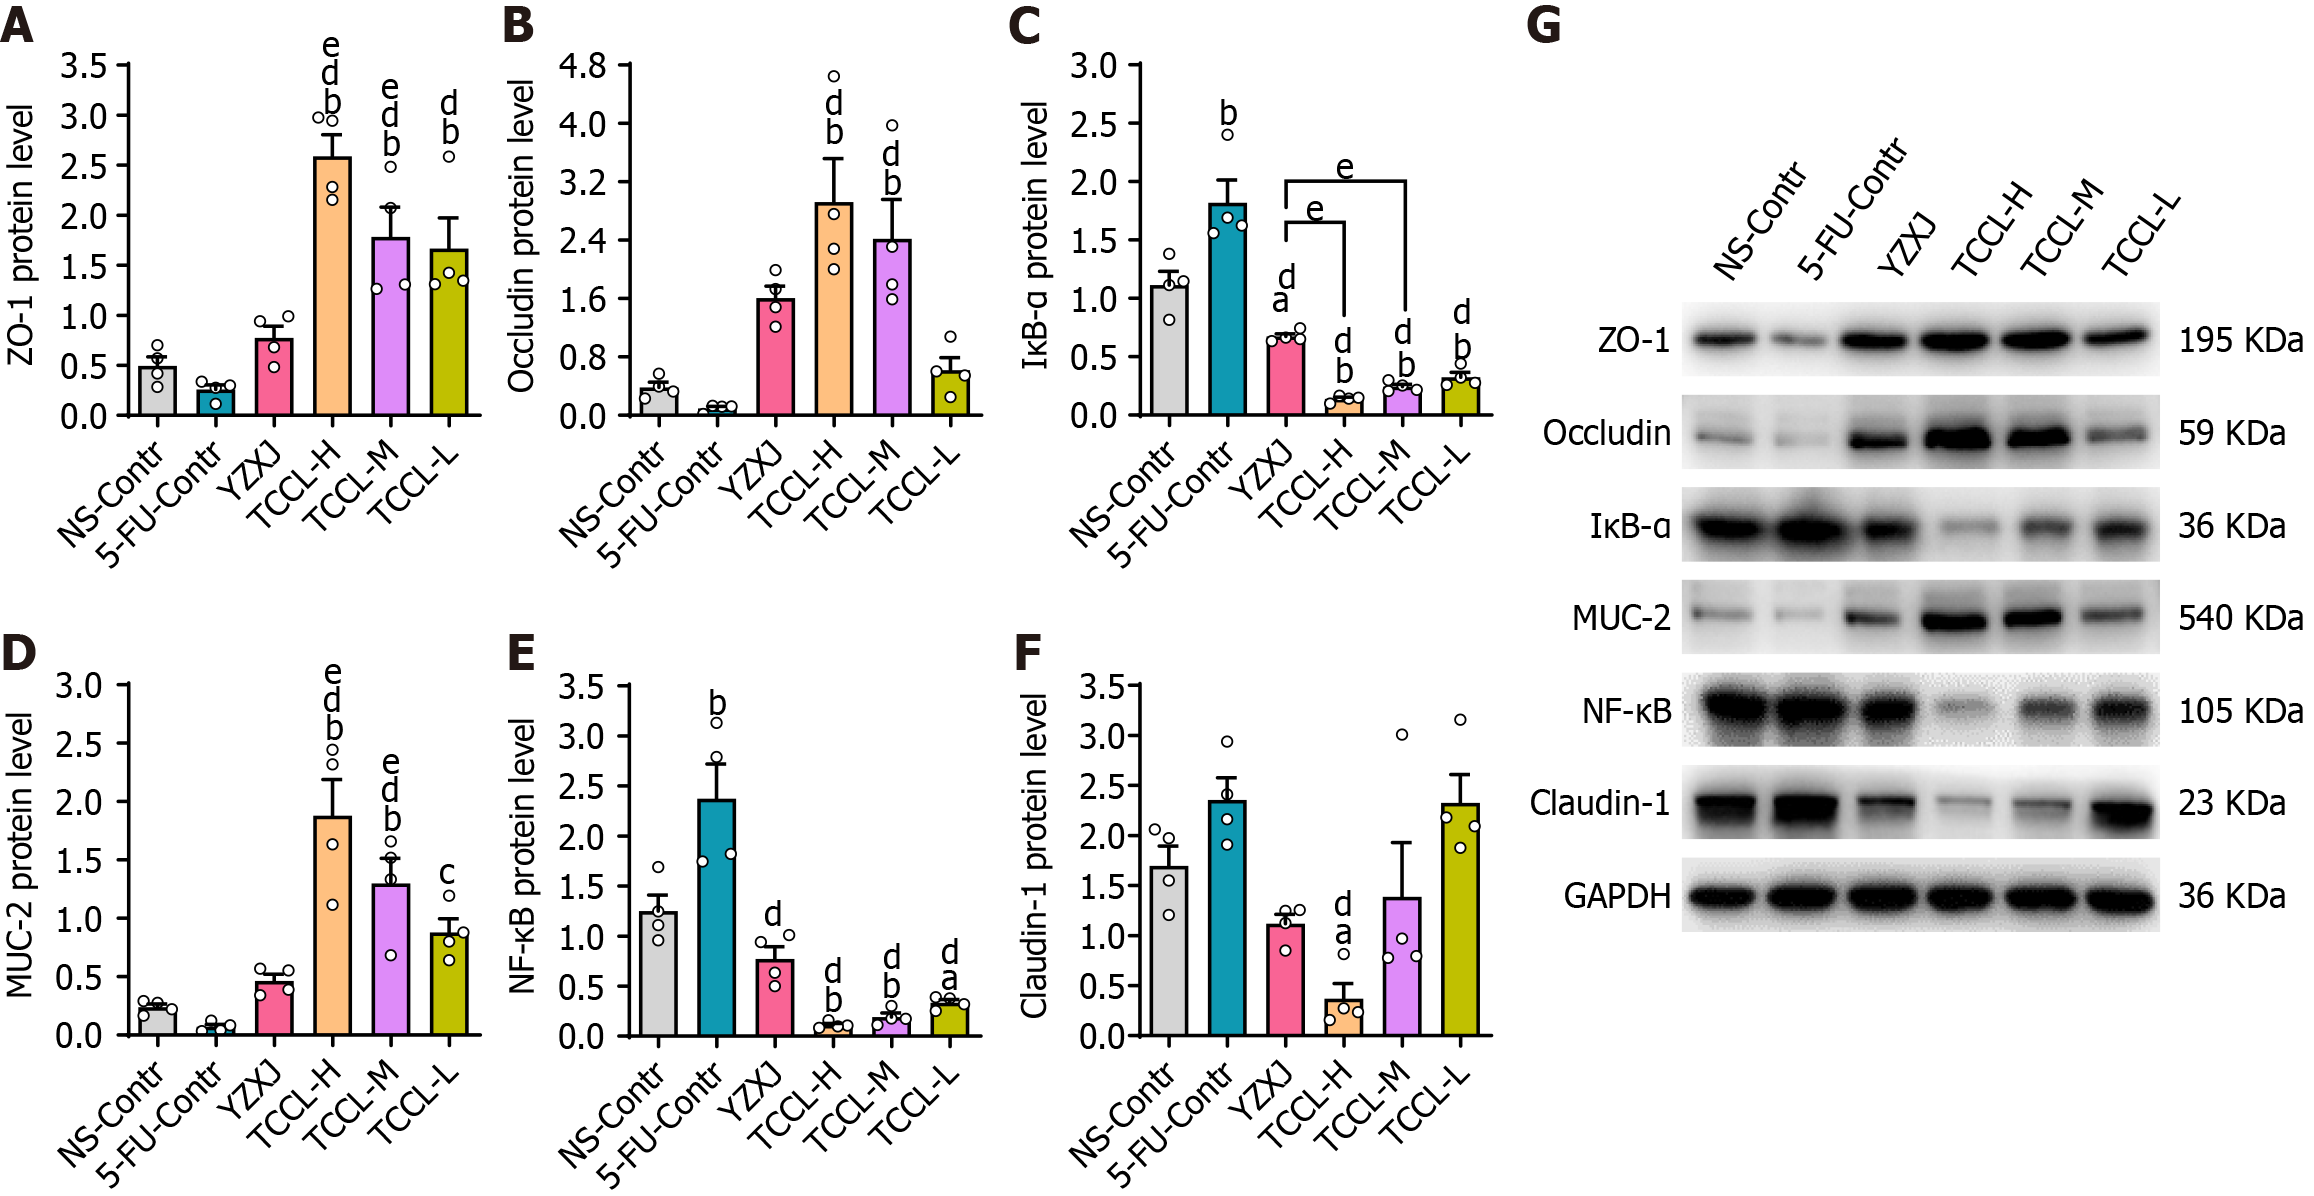
Figure 4 Effects of Tzu-Chi cancer-antagonizing & life-protecting II decoction on protein expression of colonic ZO-1, NF-κB, Occludin, MUC-2, Claudin-1, and IκB-α in H22 hepatocellular carcinoma mice after chemotherapy.
A-G: Protein expression of ZO-1 (A), Occludin (B), IκB-α(C), MUC-2 (D), NF-κB (E), and Claudin-1 (F) and band map (G) of each protein by Western blot. Data with error bars are represented as the mean ± SD (n = 4). aP < 0.05 vs NS-Contr; bP < 0.01 vs NS-Contr; cP < 0.05 vs 5-fluorouracil (FU)-Contr; dP < 0.01 vs 5-FU-Contr; eP < 0.05 vs Yangzhengxiaoji capsules, one-way ANOVA. 5-FU: 5-fluorouracil; YZXJ: Yangzhengxiaoji capsules; TCCL-H: High-dose Tzu-Chi cancer-antagonizing & life-protecting II decoction; TCCL-M: Medium-dose Tzu-Chi cancer-antagonizing & life-protecting II decoction; TCCL-L: Low-dose Tzu-Chi cancer-antagonizing & life-protecting II decoction.
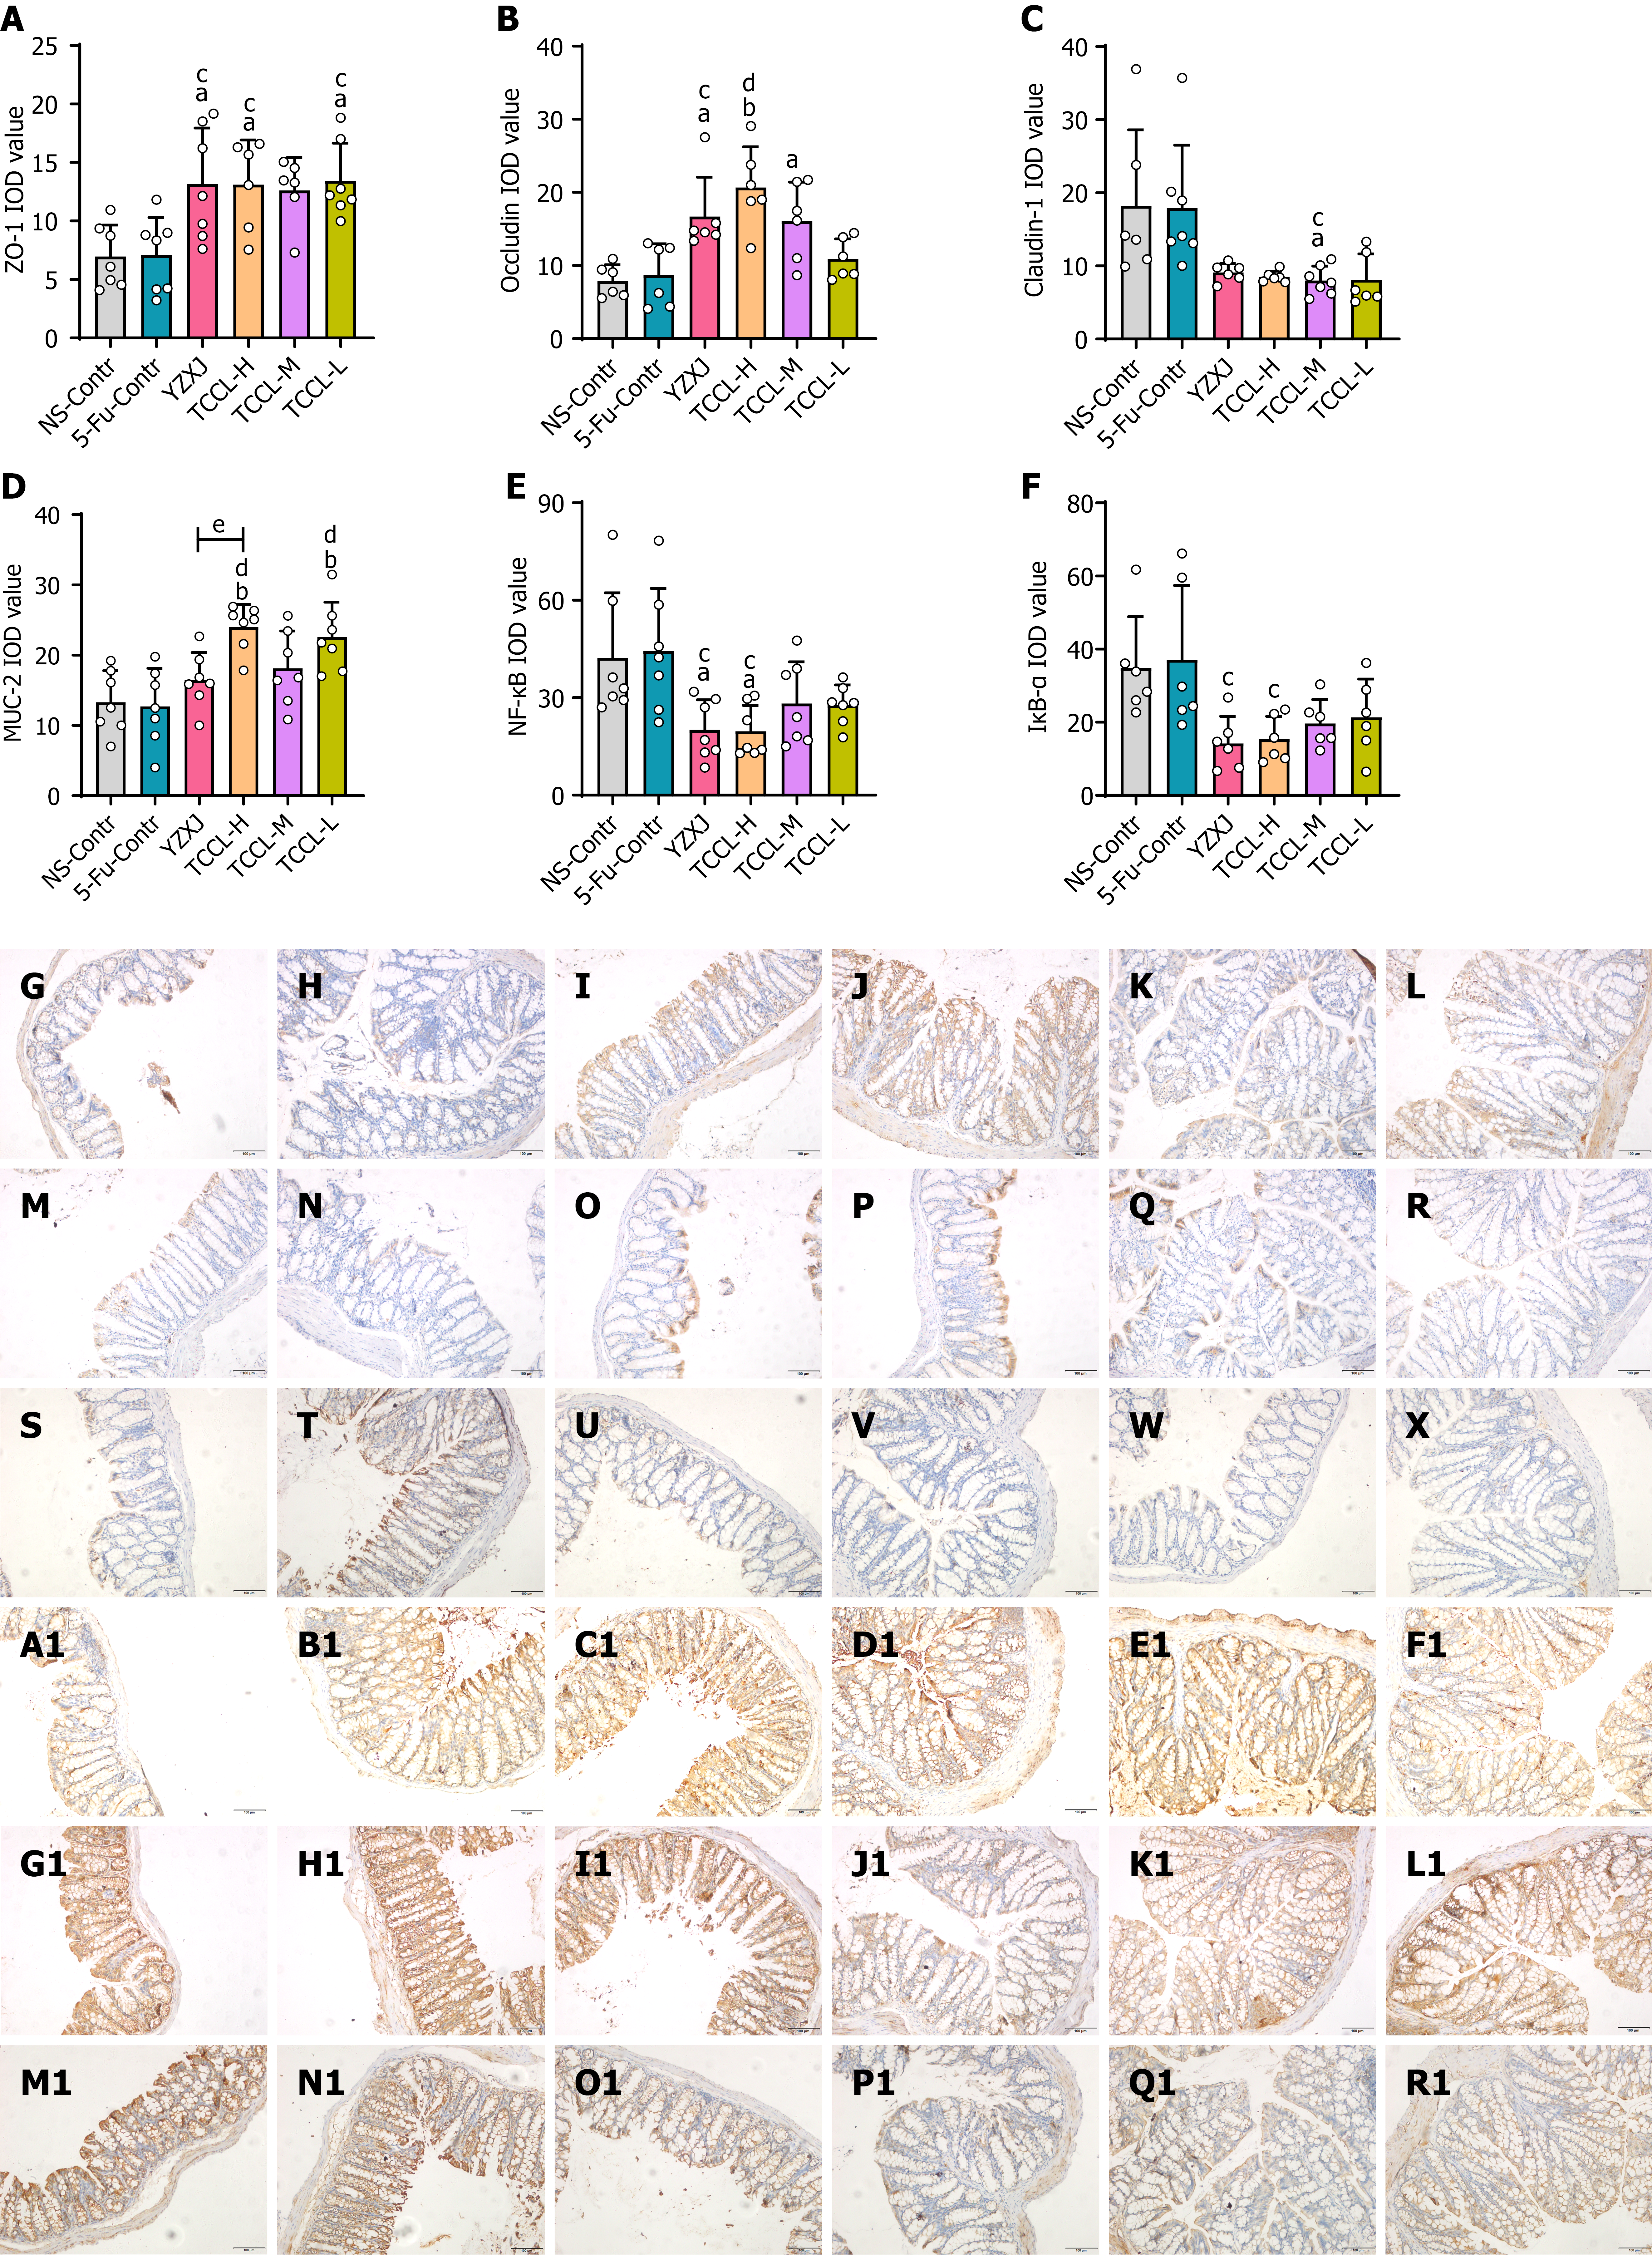
Figure 5 Tzu-Chi cancer-antagonizing & life-protecting II decoction regulates protein expression levels of colonic ZO-1, MUC-2, NF-κB, Occludin, Claudin-1, and IκB-α in H22 hepatocellular carcinoma mice after chemotherapy.
A-F: Immunohistochemical analysis of ZO-1 (A), Occludin (B), Claudin-1 (C), MUC-2 (D), NF-κB (E), and IκB-α (F) expression; G-R1: Immunohistochemical images of ZO-1 (G-L), Occludin (M-R), Claudin-1 (S-X), MUC-2 (A1-F1), NF-κB (G1-L1), and IκB-α (M1-R1) in different groups. G, M, S, A1, G1, and M1: NS-Contr (saline-treated control); H, N, T, B1, H1, and N1: 5-fluorouracil (FU)-Contr (25 mg/kg); I, O, U, C1, I1, and O1: Yangzhengxiaoji (YZXJ) capsules (0.78 g/kg); J, P, V, D1, J1, and P1: Tzu-Chi cancer-antagonizing & life-protecting II decoction (TCCL)-H (17.6 g/kg); K, Q, W, E1, K1 and Q1: TCCL-M (8.8 g/kg); L, R, X, F1, L1 and R1: TCCL-L (4.4 g/kg). The scale bars for G to R1 are 100 μm. Data with error bars are represented as the mean ± SD (n = 6 or 7). aP< 0.05 vs NS-Contr; bP < 0.01 vs NS-Contr; cP < 0.05 vs 5-FU-Contr; dP < 0.01 vs 5-FU-Contr; eP < 0.05 vs YZXJ capsules, one-way ANOVA. 5-FU: 5-fluorouracil; YZXJ: Yangzhengxiaoji capsules; TCCL-H: High-dose Tzu-Chi cancer-antagonizing & life-protecting II decoction; TCCL-M: Medium-dose Tzu-Chi cancer-antagonizing & life-protecting II decoction; TCCL-L: Low-dose Tzu-Chi cancer-antagonizing & life-protecting II decoction.
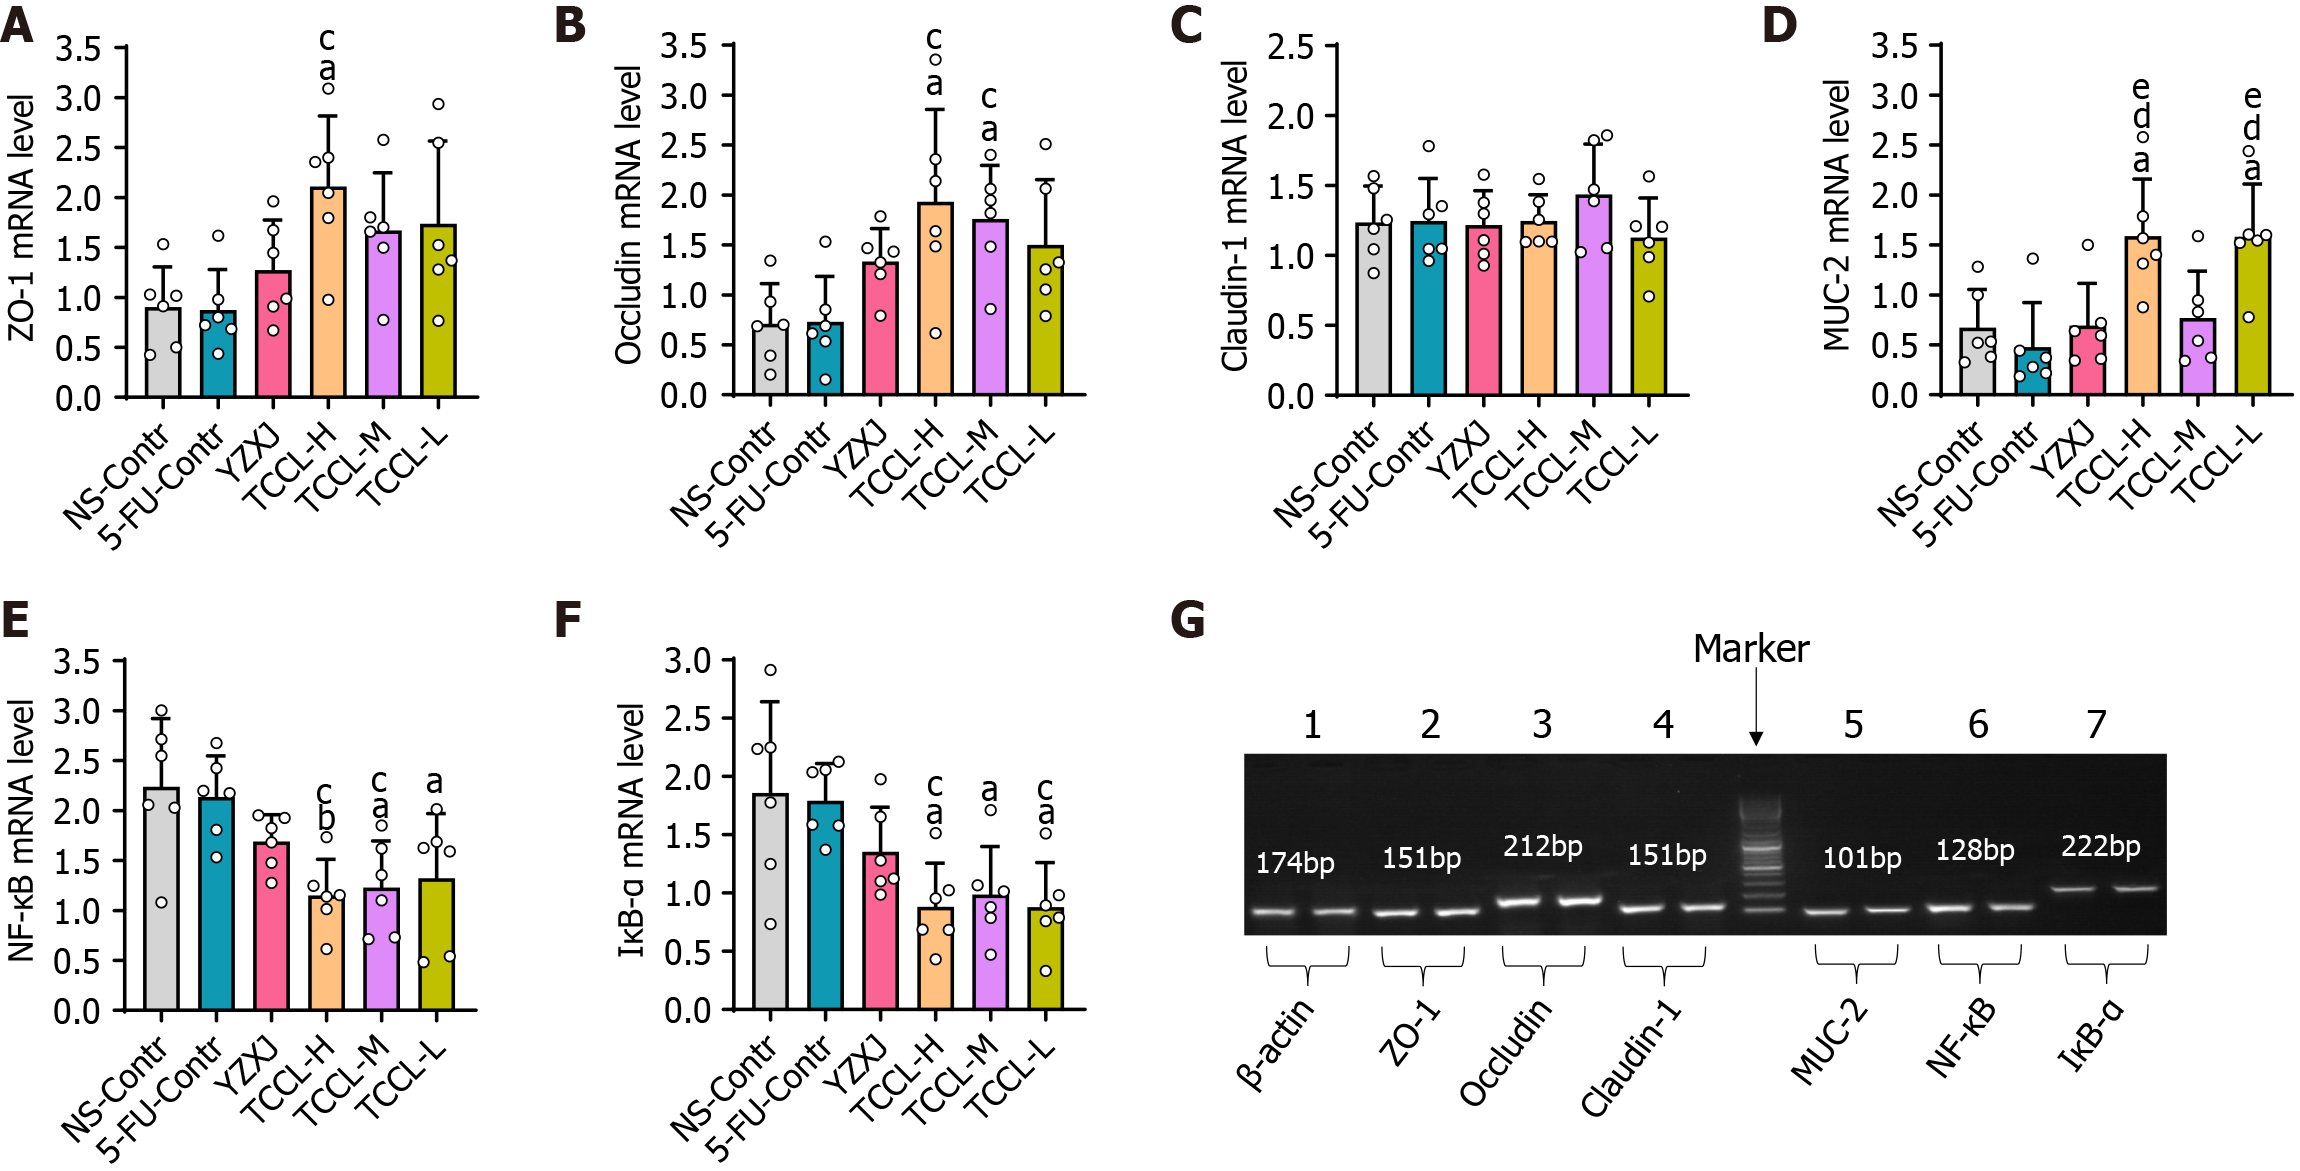
Figure 6 Tzu-Chi cancer-antagonizing & life-protecting II decoction regulates mRNA expression of colonic ZO-1, Occludin, Claudin-1, MUC-2, NF-κB, and IκB-α in H22 tumor mice receiving chemotherapy.
A-F: The mRNA expression analysis of ZO-1 (A), Occludin (B), Claudin-1 (C), MUC-2 (D), NF-κB (E), and IκB-α (F). G: Gel electrophoretograms of the amplification products of ZO-1, NF-κB, Occludin, Claudin-1, IκB-α, MUC-2, and β-actin obtained after real-time PCR. Data with error bars are represented as the mean ± SD (n = 6). aP < 0.05 vs NS-Contr; bP < 0.01 vs NS-Contr; cP < 0.05 vs 5-fluorouracil (FU)-Contr; dP < 0.01 vs 5-FU-Contr; eP < 0.05 vs Yangzhengxiaoji capsules, one-way ANOVA. 5-FU: 5-fluorouracil; YZXJ: Yangzhengxiaoji capsules; TCCL-H: High-dose Tzu-Chi cancer-antagonizing & life-protecting II decoction; TCCL-M: Medium-dose Tzu-Chi cancer-antagonizing & life-protecting II decoction; TCCL-L: Low-dose Tzu-Chi cancer-antagonizing & life-protecting II decoction.
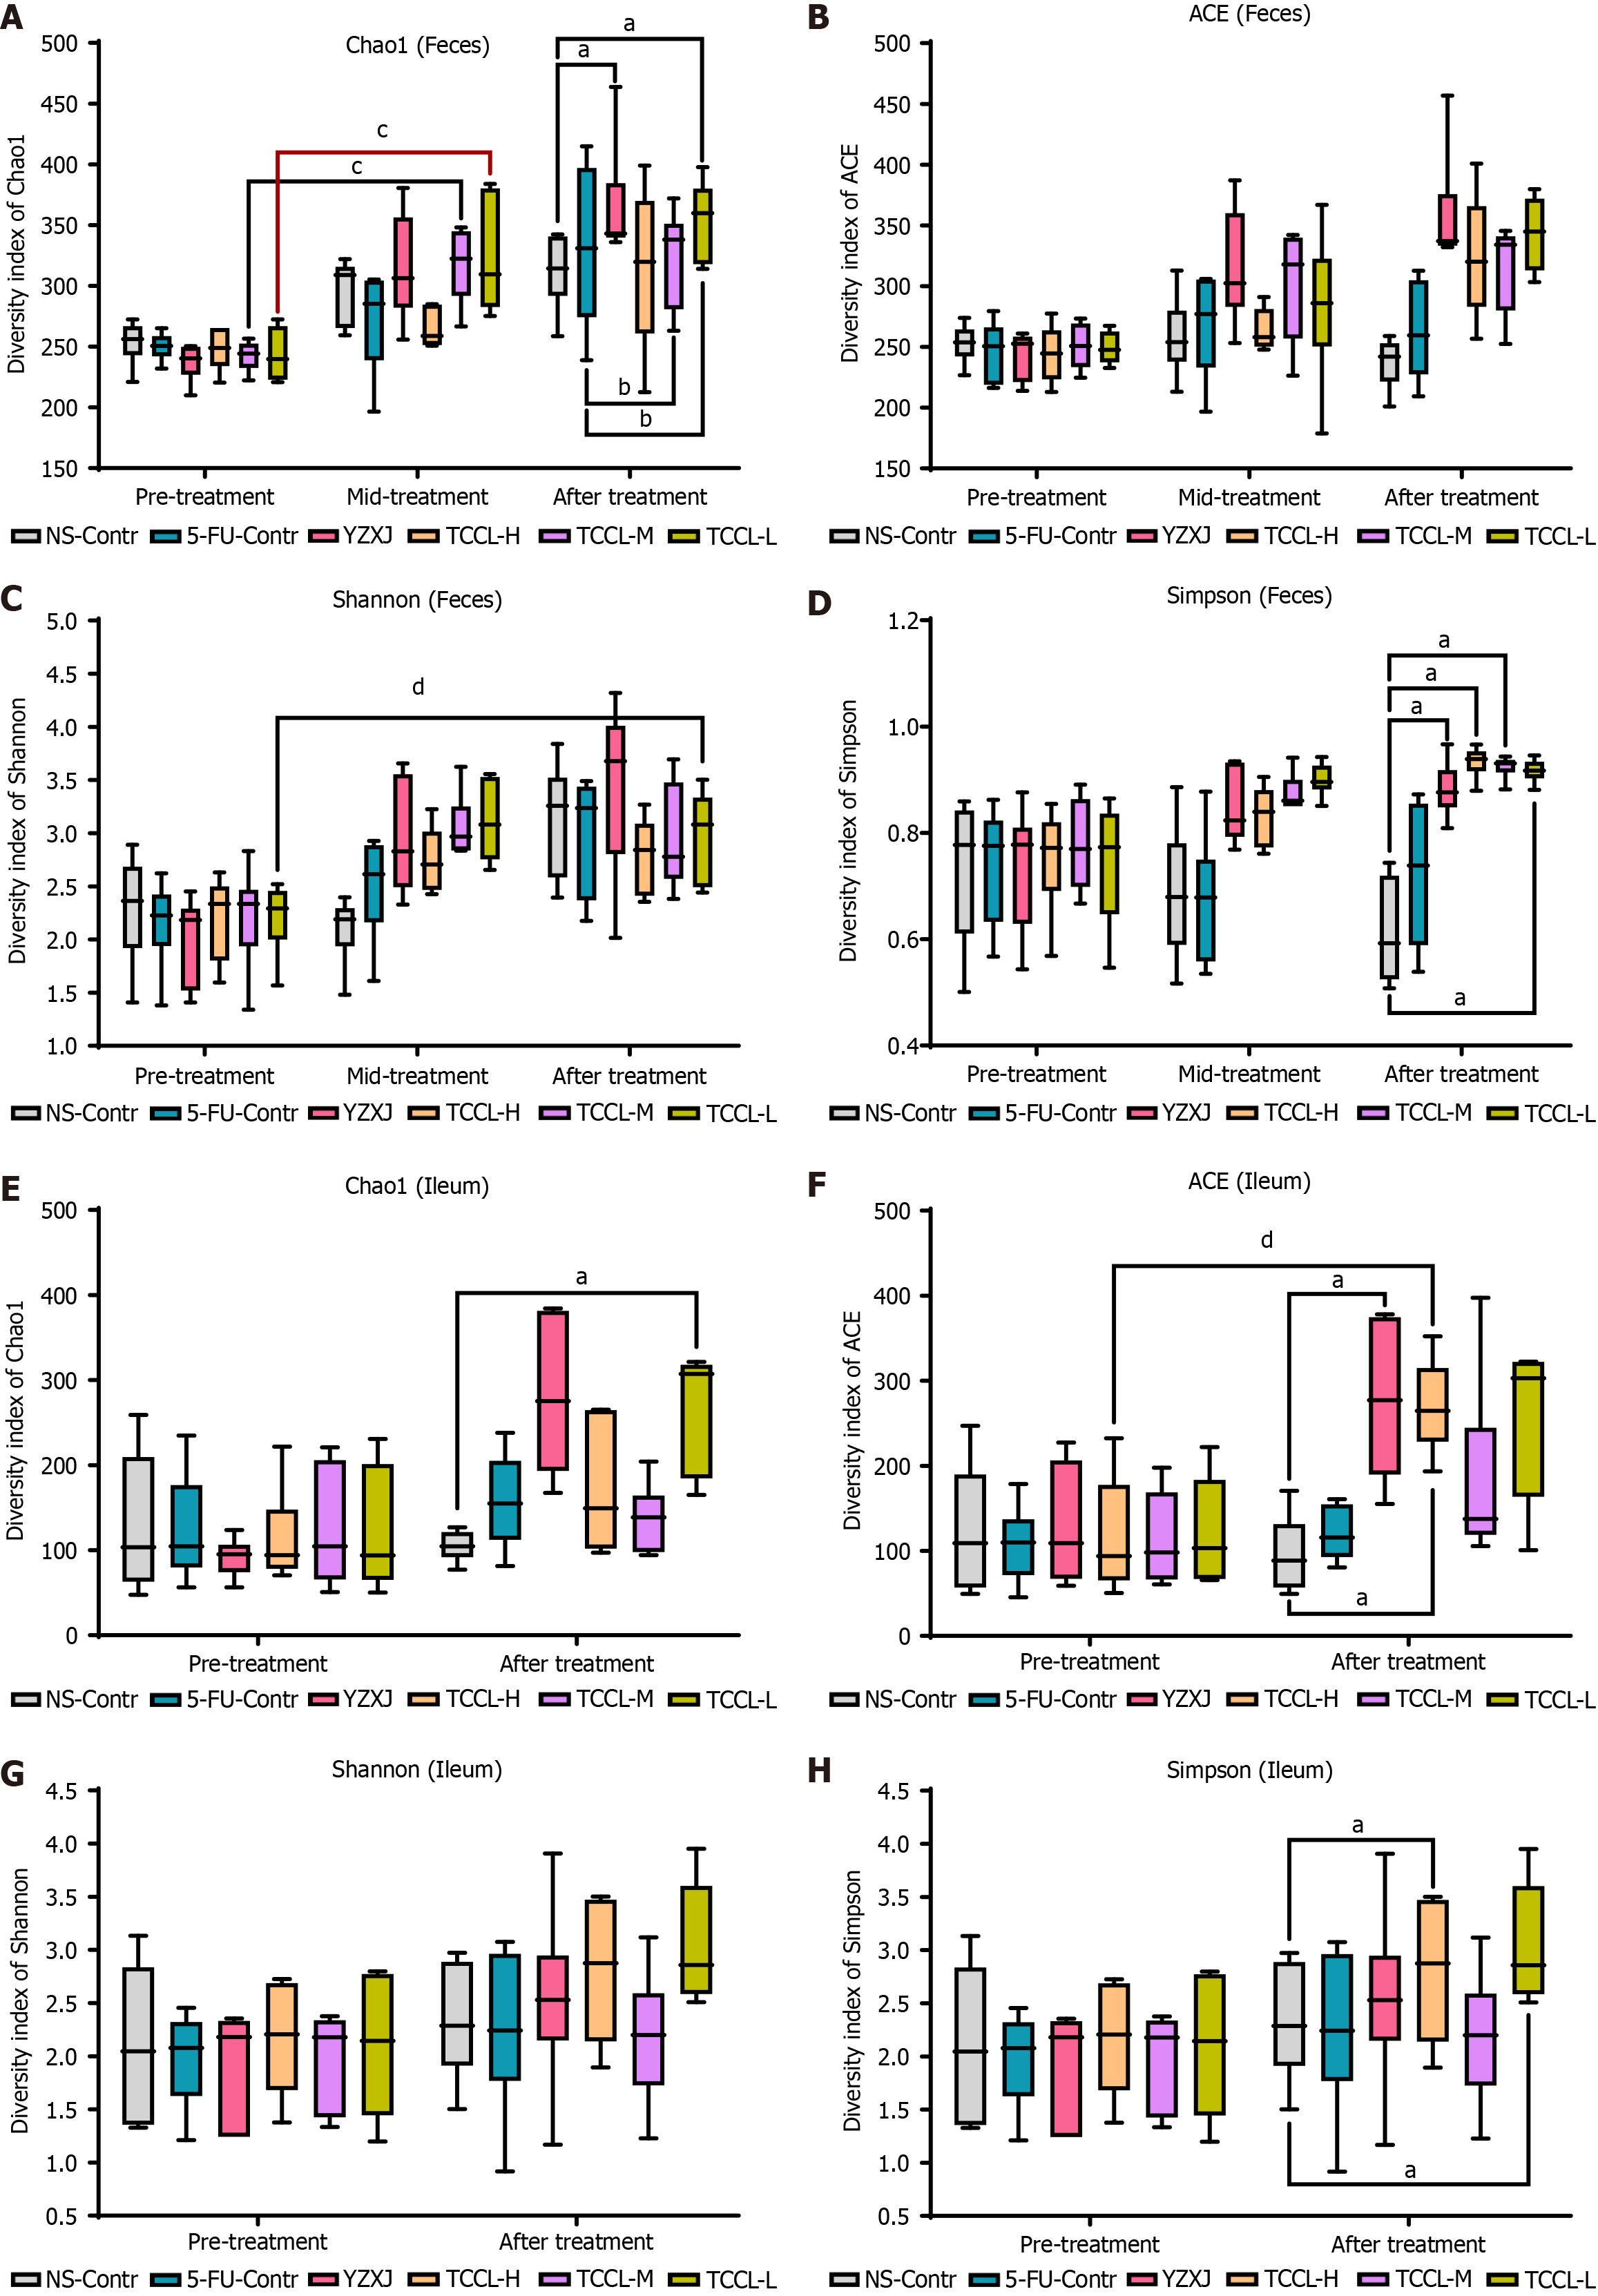
Figure 7 Effects of Tzu-Chi cancer-antagonizing & life-protecting II decoction on microbial community richness, evenness, and diversity in fecal samples and ileal contents.
The horizontal axis represents the groups and the different treatment periods and the vertical axis represents the various alpha indices. A-D: Fecal flora values of Chao1 (A), ACE (B), Shannon (C), and Simpson (D); E-H: Ileum microflora values of Chao1 (E), ACE (F), Shannon (G), and Simpson (H). Data with error bars are represented as the mean ± SD (n = 6). aP< 0.05 vs NS-Contr; bP < 0.05 vs 5-fluorouracil-Contr; cP < 0.05 pre-treatment vs mid-treatment; dP < 0.05 pre-treatment vs after treatment, one-way ANOVA. 5-FU: 5-fluorouracil; YZXJ: Yangzhengxiaoji capsules; TCCL-H: High-dose Tzu-Chi cancer-antagonizing & life-protecting II decoction; TCCL-M: Medium-dose Tzu-Chi cancer-antagonizing & life-protecting II decoction; TCCL-L: Low-dose Tzu-Chi cancer-antagonizing & life-protecting II decoction.
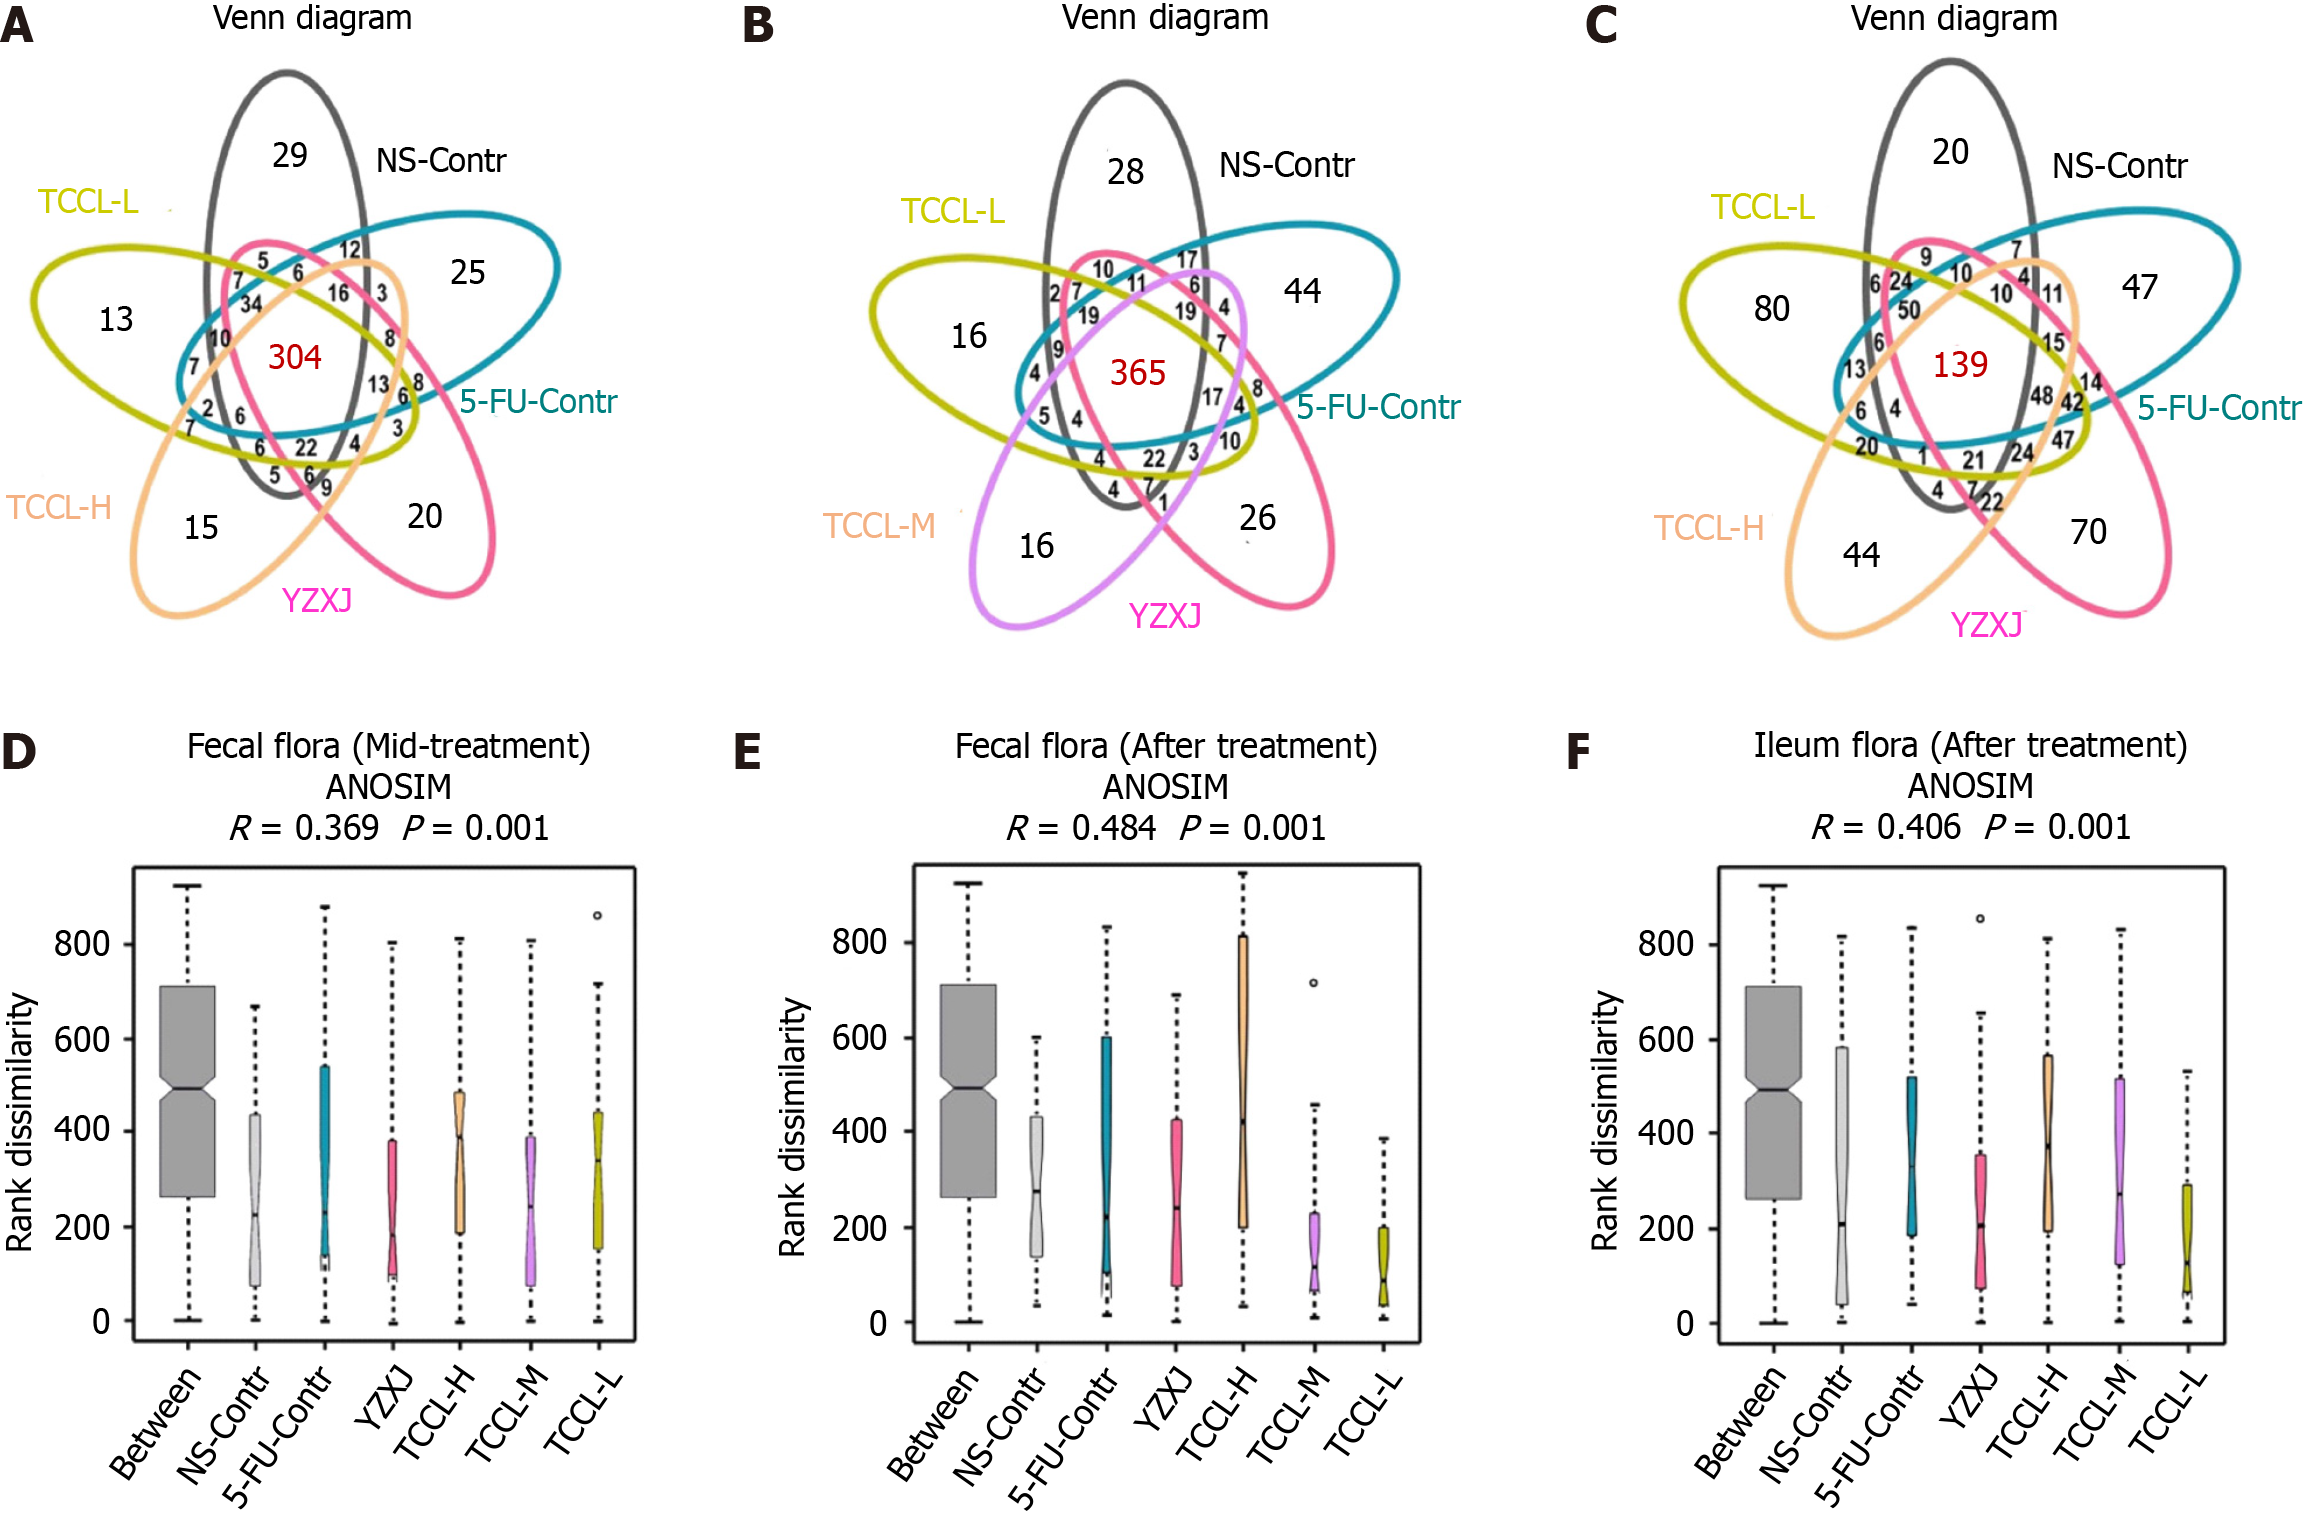
Figure 8 Venn diagrams and analysis of similarities in mid-treatment stage or after Tzu-Chi cancer-antagonizing & life-protecting II decoction treatment.
A-C: Venn diagrams of mice feces in the mid-treatment stage (A), mice feces after treatment (B), and mice ileal contents after treatment (C); D-F: Venn diagrams showing the unique and shared operational taxonomic units (OTUs). Different colors indicate different groups, and the number in the middle of the graph represents the number of OTUs. The overlapping areas represent the core microbiome. Analysis of similarities in mice feces in the mid-treatment stage (D), in mice feces after treatment (E), and in mice ileal contents after treatment (F). Data with error bars are represented as the mean ± SD (n = 6 or 7). The x-coordinate represents all samples (between) and each group and the y-coordinate represents the rank of the distance.
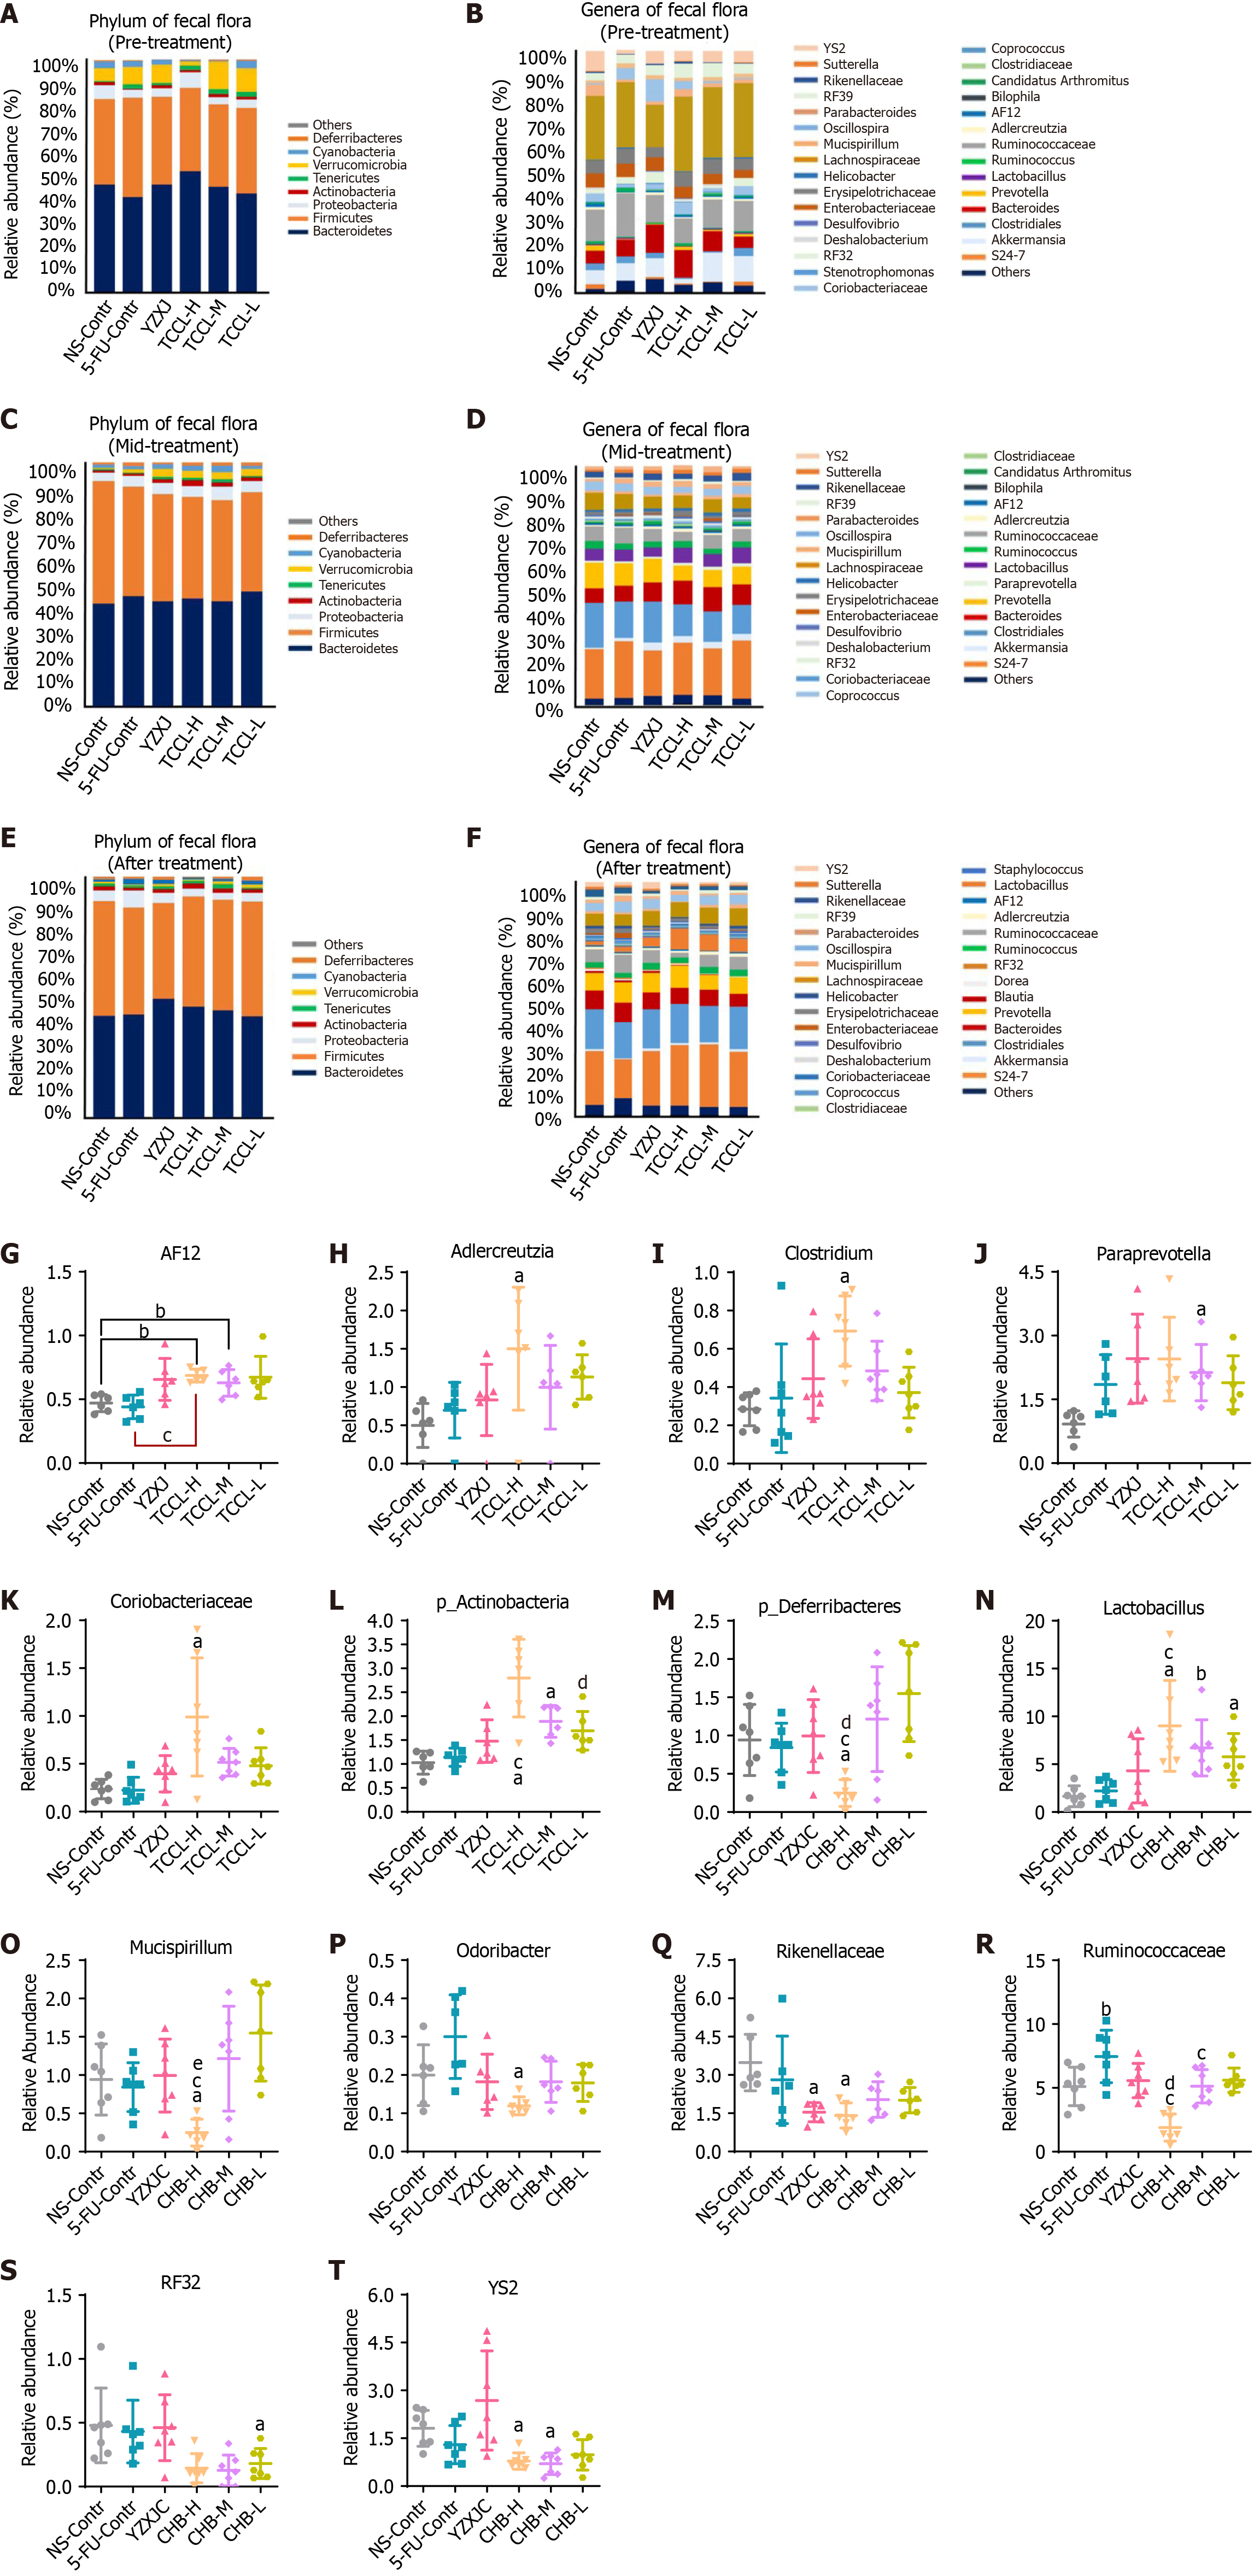
Figure 9 Histograms showing the flora structure of the top eight taxonomic dominant species and the top 30 genus dominant species in fecal samples (with other species having a relative abundance < 1%).
A-F: Different microbial species are represented by different colors; the horizontal axis denotes the experimental groups and the vertical axis represents the relative abundance of each species. The histograms highlight the significantly different microbiota between groups in fecal samples during the mid-treatment stage or after treatment. Fecal flora at the phylum level pre-treatment (A), genus level pre-treatment (B), phylum level mid-treatment (C), genus level mid-treatment (D), phylum level after treatment (E), and genus level after treatment (F); G-L: Relative abundance of AF12 (G), Adlercreutzia (H), Clostridium (I), Paraprevotella (J), Coriobacteriaceae (K) and p_Actinobacteria (L) in different groups mid-treatment; M-T: Relative abundance of p_Deferribacteres (M), Lactobacillus (N), Mucispirillum (O), Odoribacter (P), Rikenellaceae (Q), Ruminococcaceae (R), RF32 (S), and YS2 (T) in different groups after treatment. Data with error bars are represented as the mean ± SD (n = 6 or 7). aP< 0.05 vs NS-Contr; bP < 0.01 vs NS-Contr; cP < 0.05 vs 5-fluorouracil-Contr; eP < 0.05 vs Yangzhengxiaoji capsules, one-way ANOVA. 5-FU: 5-fluorouracil; YZXJ: Yangzhengxiaoji capsules; TCCL-H: High-dose Tzu-Chi cancer-antagonizing & life-protecting II decoction; TCCL-M: Medium-dose Tzu-Chi cancer-antagonizing & life-protecting II decoction; TCCL-L: Low-dose Tzu-Chi cancer-antagonizing & life-protecting II decoction.
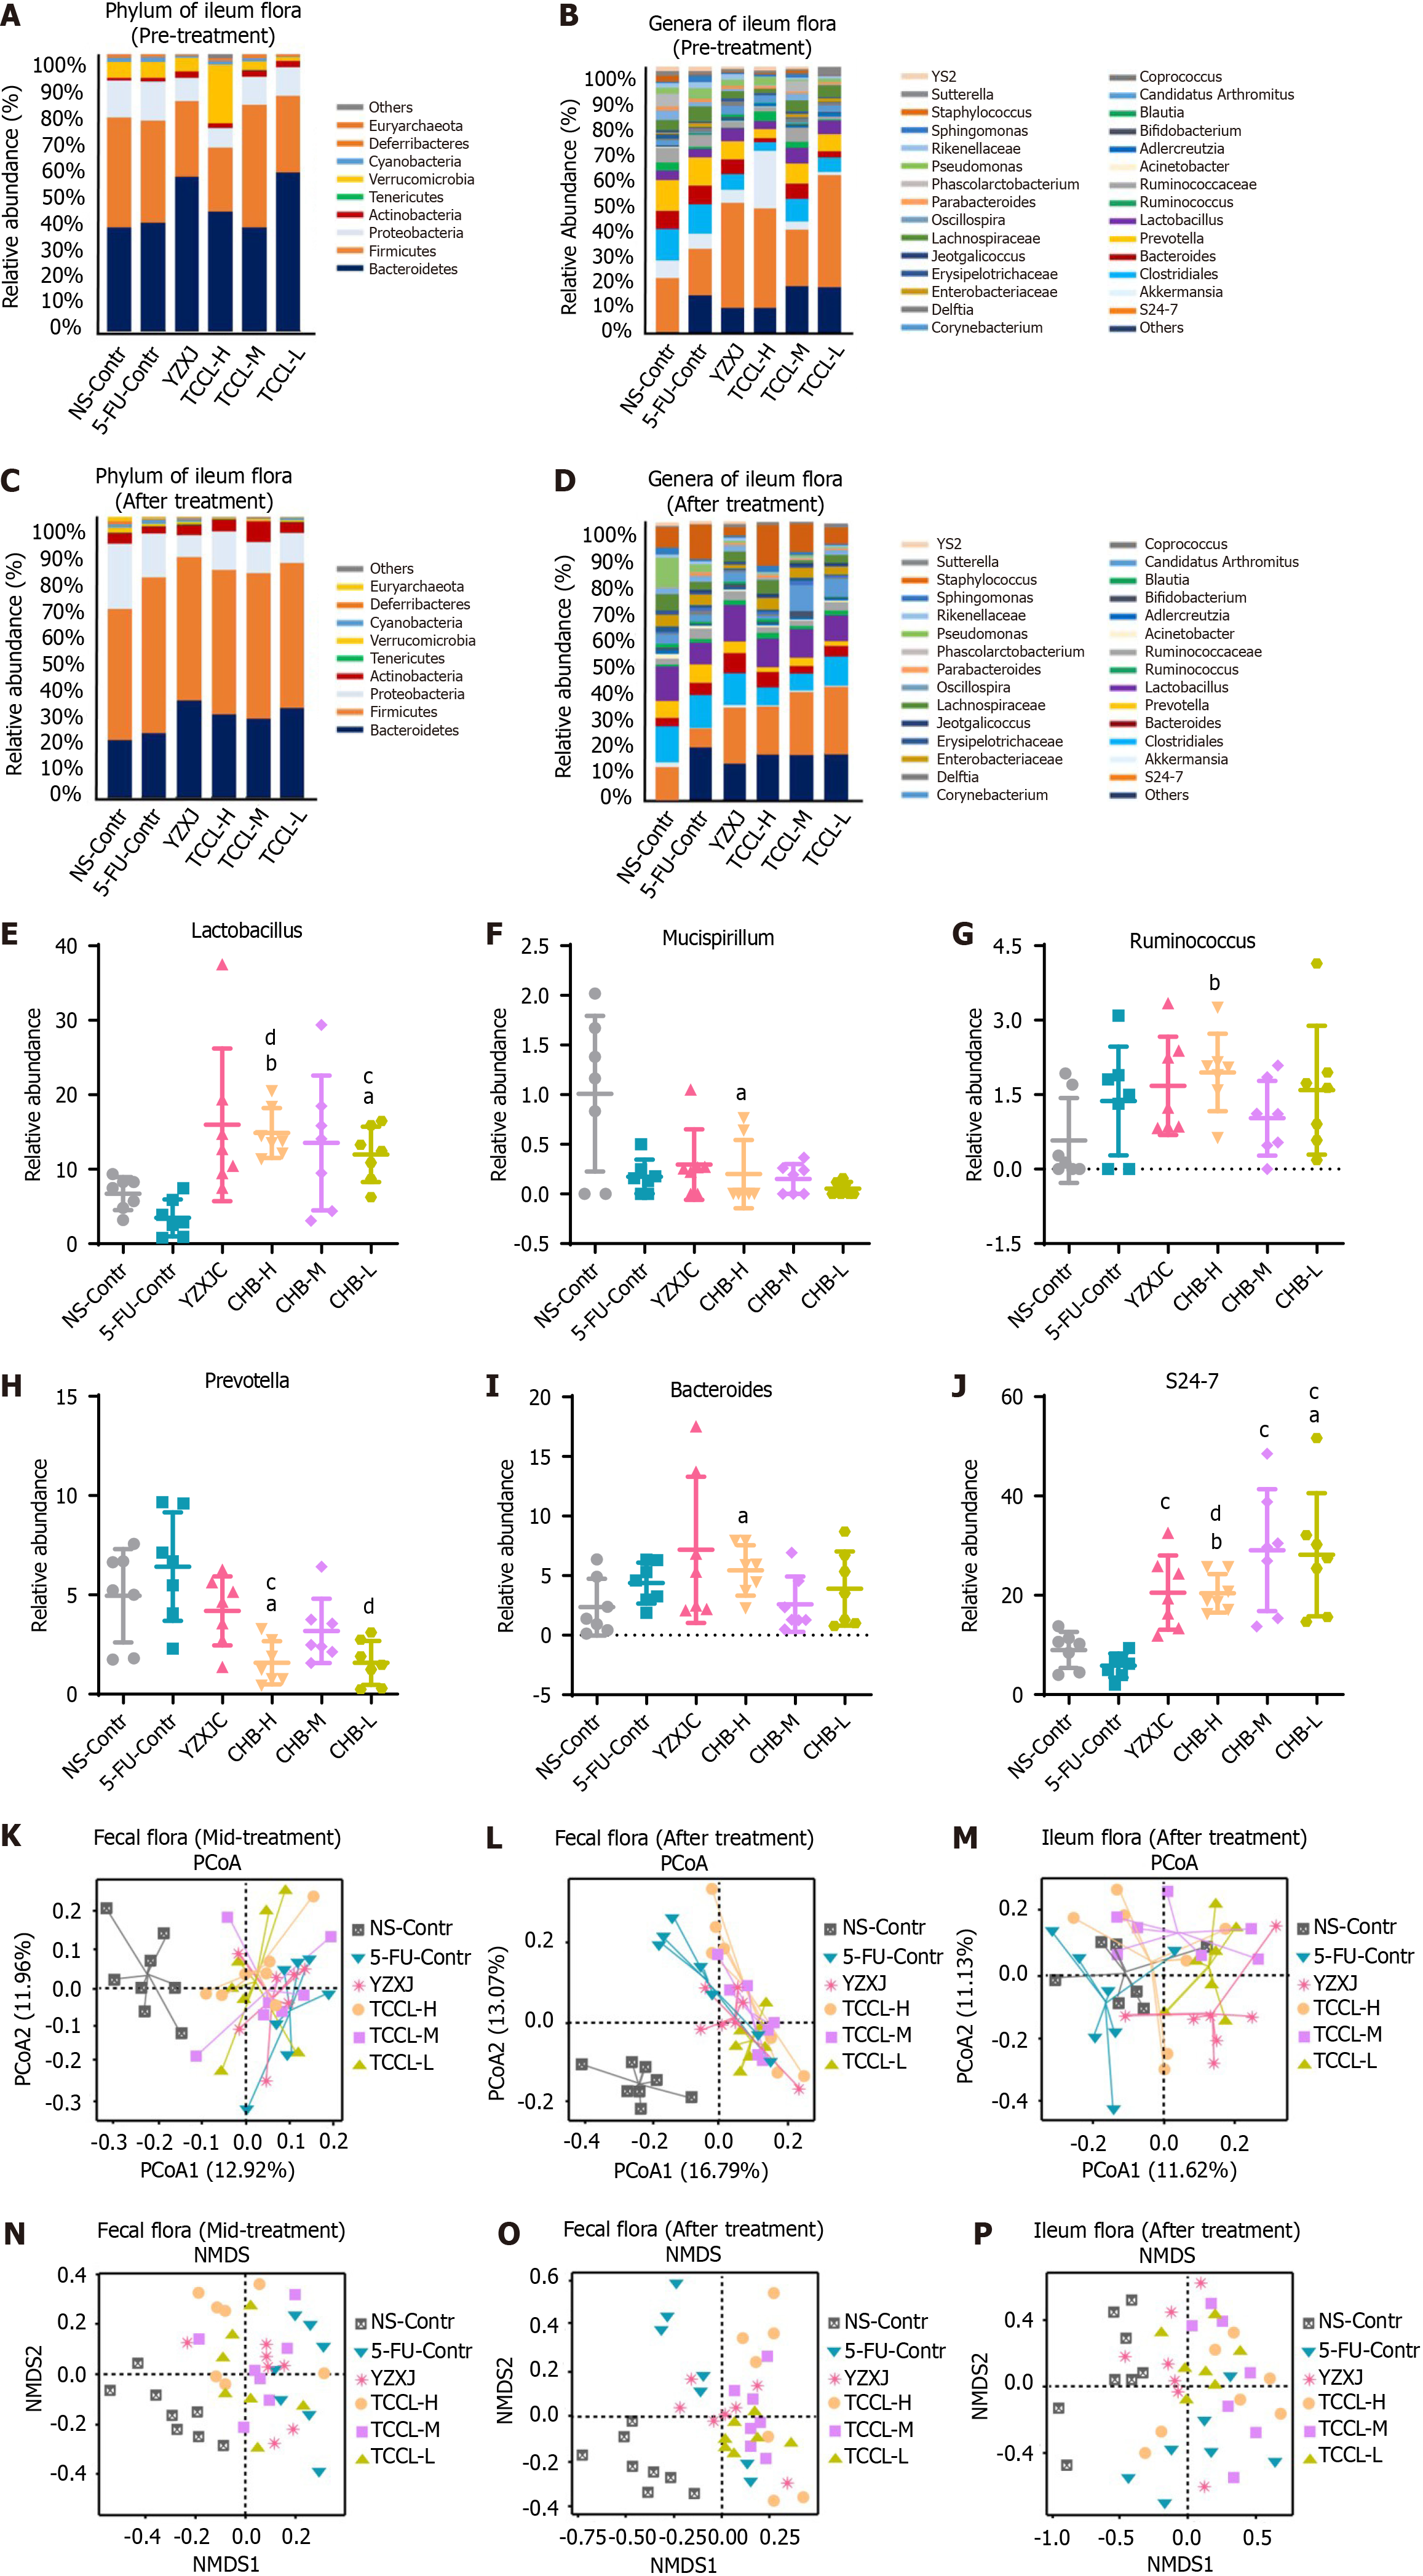
Figure 10 Histograms illustrating the flora structure of the top eight taxonomic dominant species and the top 30 genus dominant species in ileal contents.
Species with a relative abundance < 1% are categorized as "others," and different microbial species are represented by distinct colors. The histograms highlight the significantly different microbiota in ileal contents between groups after treatment. Additionally, principal coordinates analysis (PCoA) and nonmetric multidimensional scaling (NMDS) analyses of microflora in both feces and ileal contents are presented. Each point in these analyses represents a sample, with different colors indicating different experimental groups. A-D: Flora in ileal contents at the phylum level before treatment (A), genus level before treatment (B), phylum level after treatment (C), and genus level after treatment (D); E-J: Relative abundance of Lactobacillus (E), Mucispirillum (F), Prevotella (G), Bacteroides (H), Ruminococcus (I), and S24-7 (J) in different groups after treatment; K and L: Scatter plots of PCoA analysis results of fecal flora in the mid-treatment stage (K) and after treatment (L). M: Scatter plot of PCoA analysis results of ileal contents after treatment; N and O: Scatter plots of NMDS analysis results of fecal flora in the mid-treatment stage (N) and after treatment (O); P: Scatter plot of NMDS analysis results of ileal contents after treatment. Data with error bars are represented as the mean ± SD (n = 7 or 8). aP< 0.05 vs NS-Contr; bP < 0.01 vs NS-Contr; cP < 0.05 vs 5-fluorouracil (FU)-Contr; dP < 0.01 vs 5-FU-Contr, one-way ANOVA. 5-FU: 5-fluorouracil; YZXJ: Yangzhengxiaoji capsules; TCCL-H: High-dose Tzu-Chi cancer-antagonizing & life-protecting II decoction; TCCL-M: Medium-dose Tzu-Chi cancer-antagonizing & life-protecting II decoction; TCCL-L: Low-dose Tzu-Chi cancer-antagonizing & life-protecting II decoction; PCoA: Principal coordinates analysis; NMDS: Nonmetric multidimensional scaling.
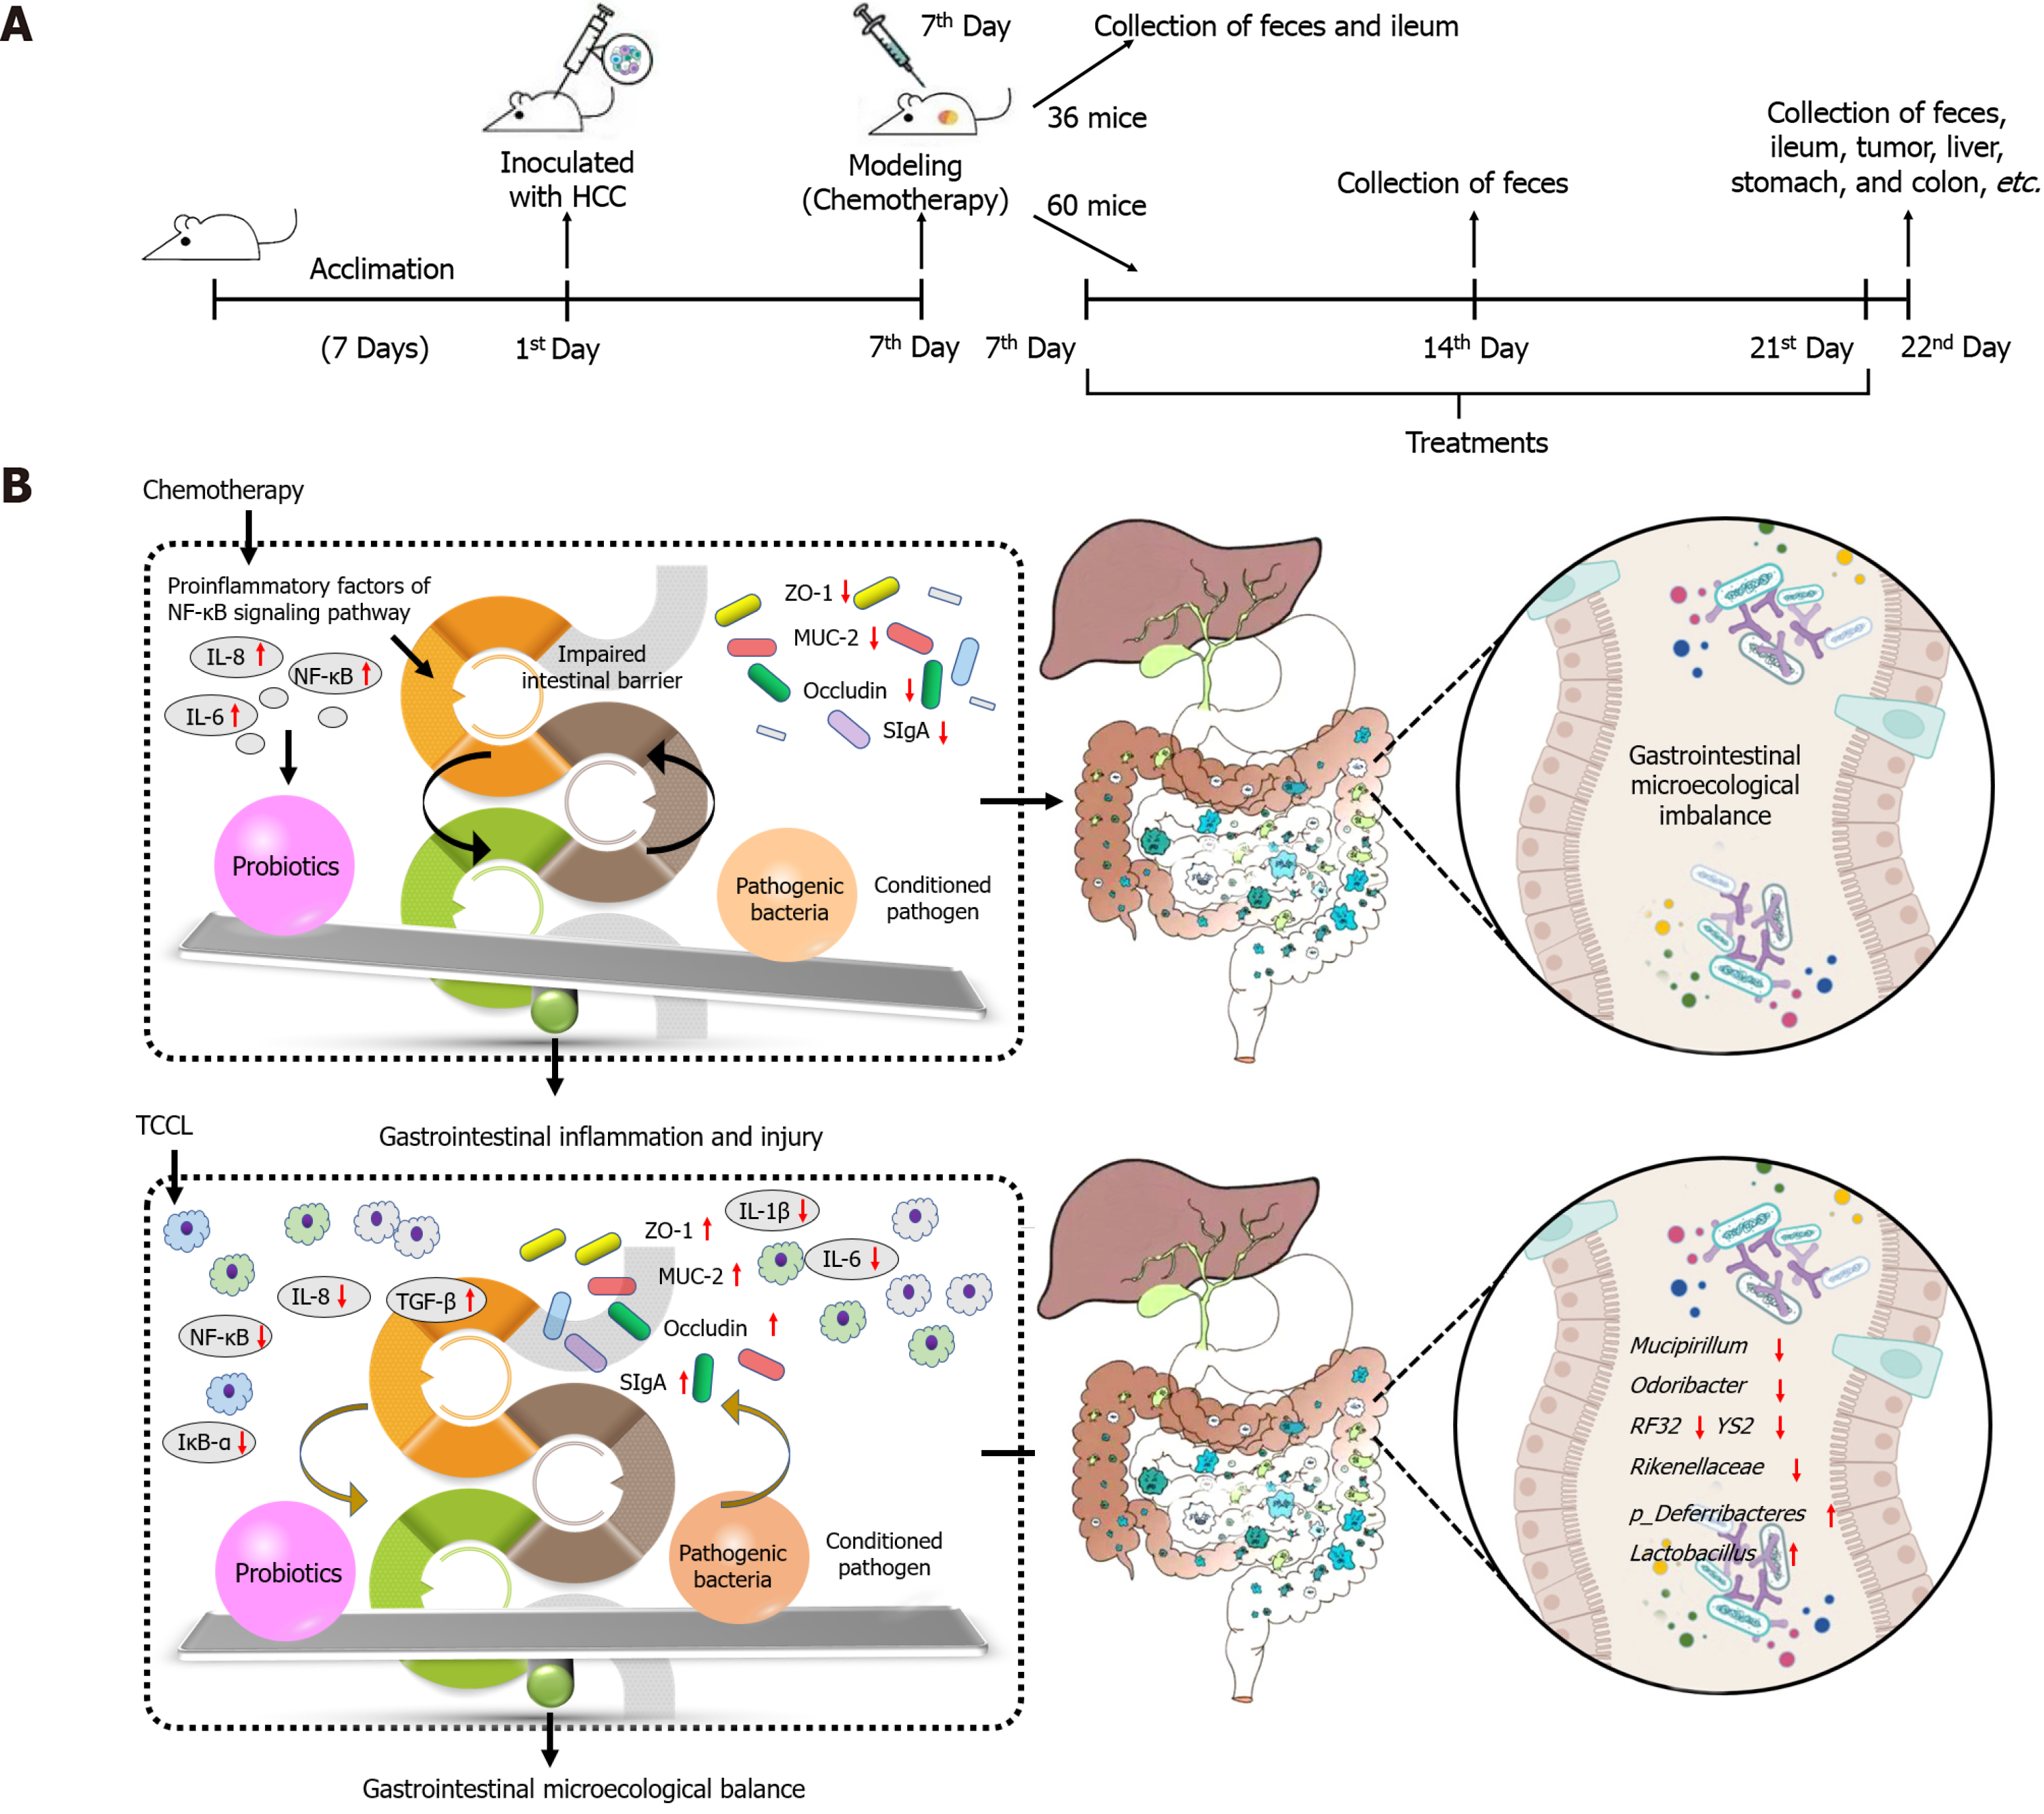
Figure 11 Experimental flow chart and graphical abstract.
A and B: Experimental flow chart (A) and graphical abstract (B) of Tzu-Chi cancer-antagonizing & life-protecting II decoction ameliorating gastrointestinal inflammation and microecology in chemotherapy-treated mice transplanted with H22 hepatocellular carcinoma. TCCL: Tzu-Chi cancer-antagonizing & life-protecting II decoction; HCC: Hepatocellular carcinoma.
- Citation: Wang YN, Zhai XY, Wang Z, Gao CL, Mi SC, Tang WL, Fu XM, Li HB, Yue LF, Li PF, Xi SY. Jianpi-Huatan-Huoxue-Anshen formula ameliorates gastrointestinal inflammation and microecological imbalance in chemotherapy-treated mice transplanted with H22 hepatocellular carcinoma. World J Gastrointest Oncol 2024; 16(10): 4209-4231
- URL: https://www.wjgnet.com/1948-5204/full/v16/i10/4209.htm
- DOI: https://dx.doi.org/10.4251/wjgo.v16.i10.4209


