Copyright
©The Author(s) 2023.
World J Gastrointest Oncol. May 15, 2023; 15(5): 892-901
Published online May 15, 2023. doi: 10.4251/wjgo.v15.i5.892
Published online May 15, 2023. doi: 10.4251/wjgo.v15.i5.892
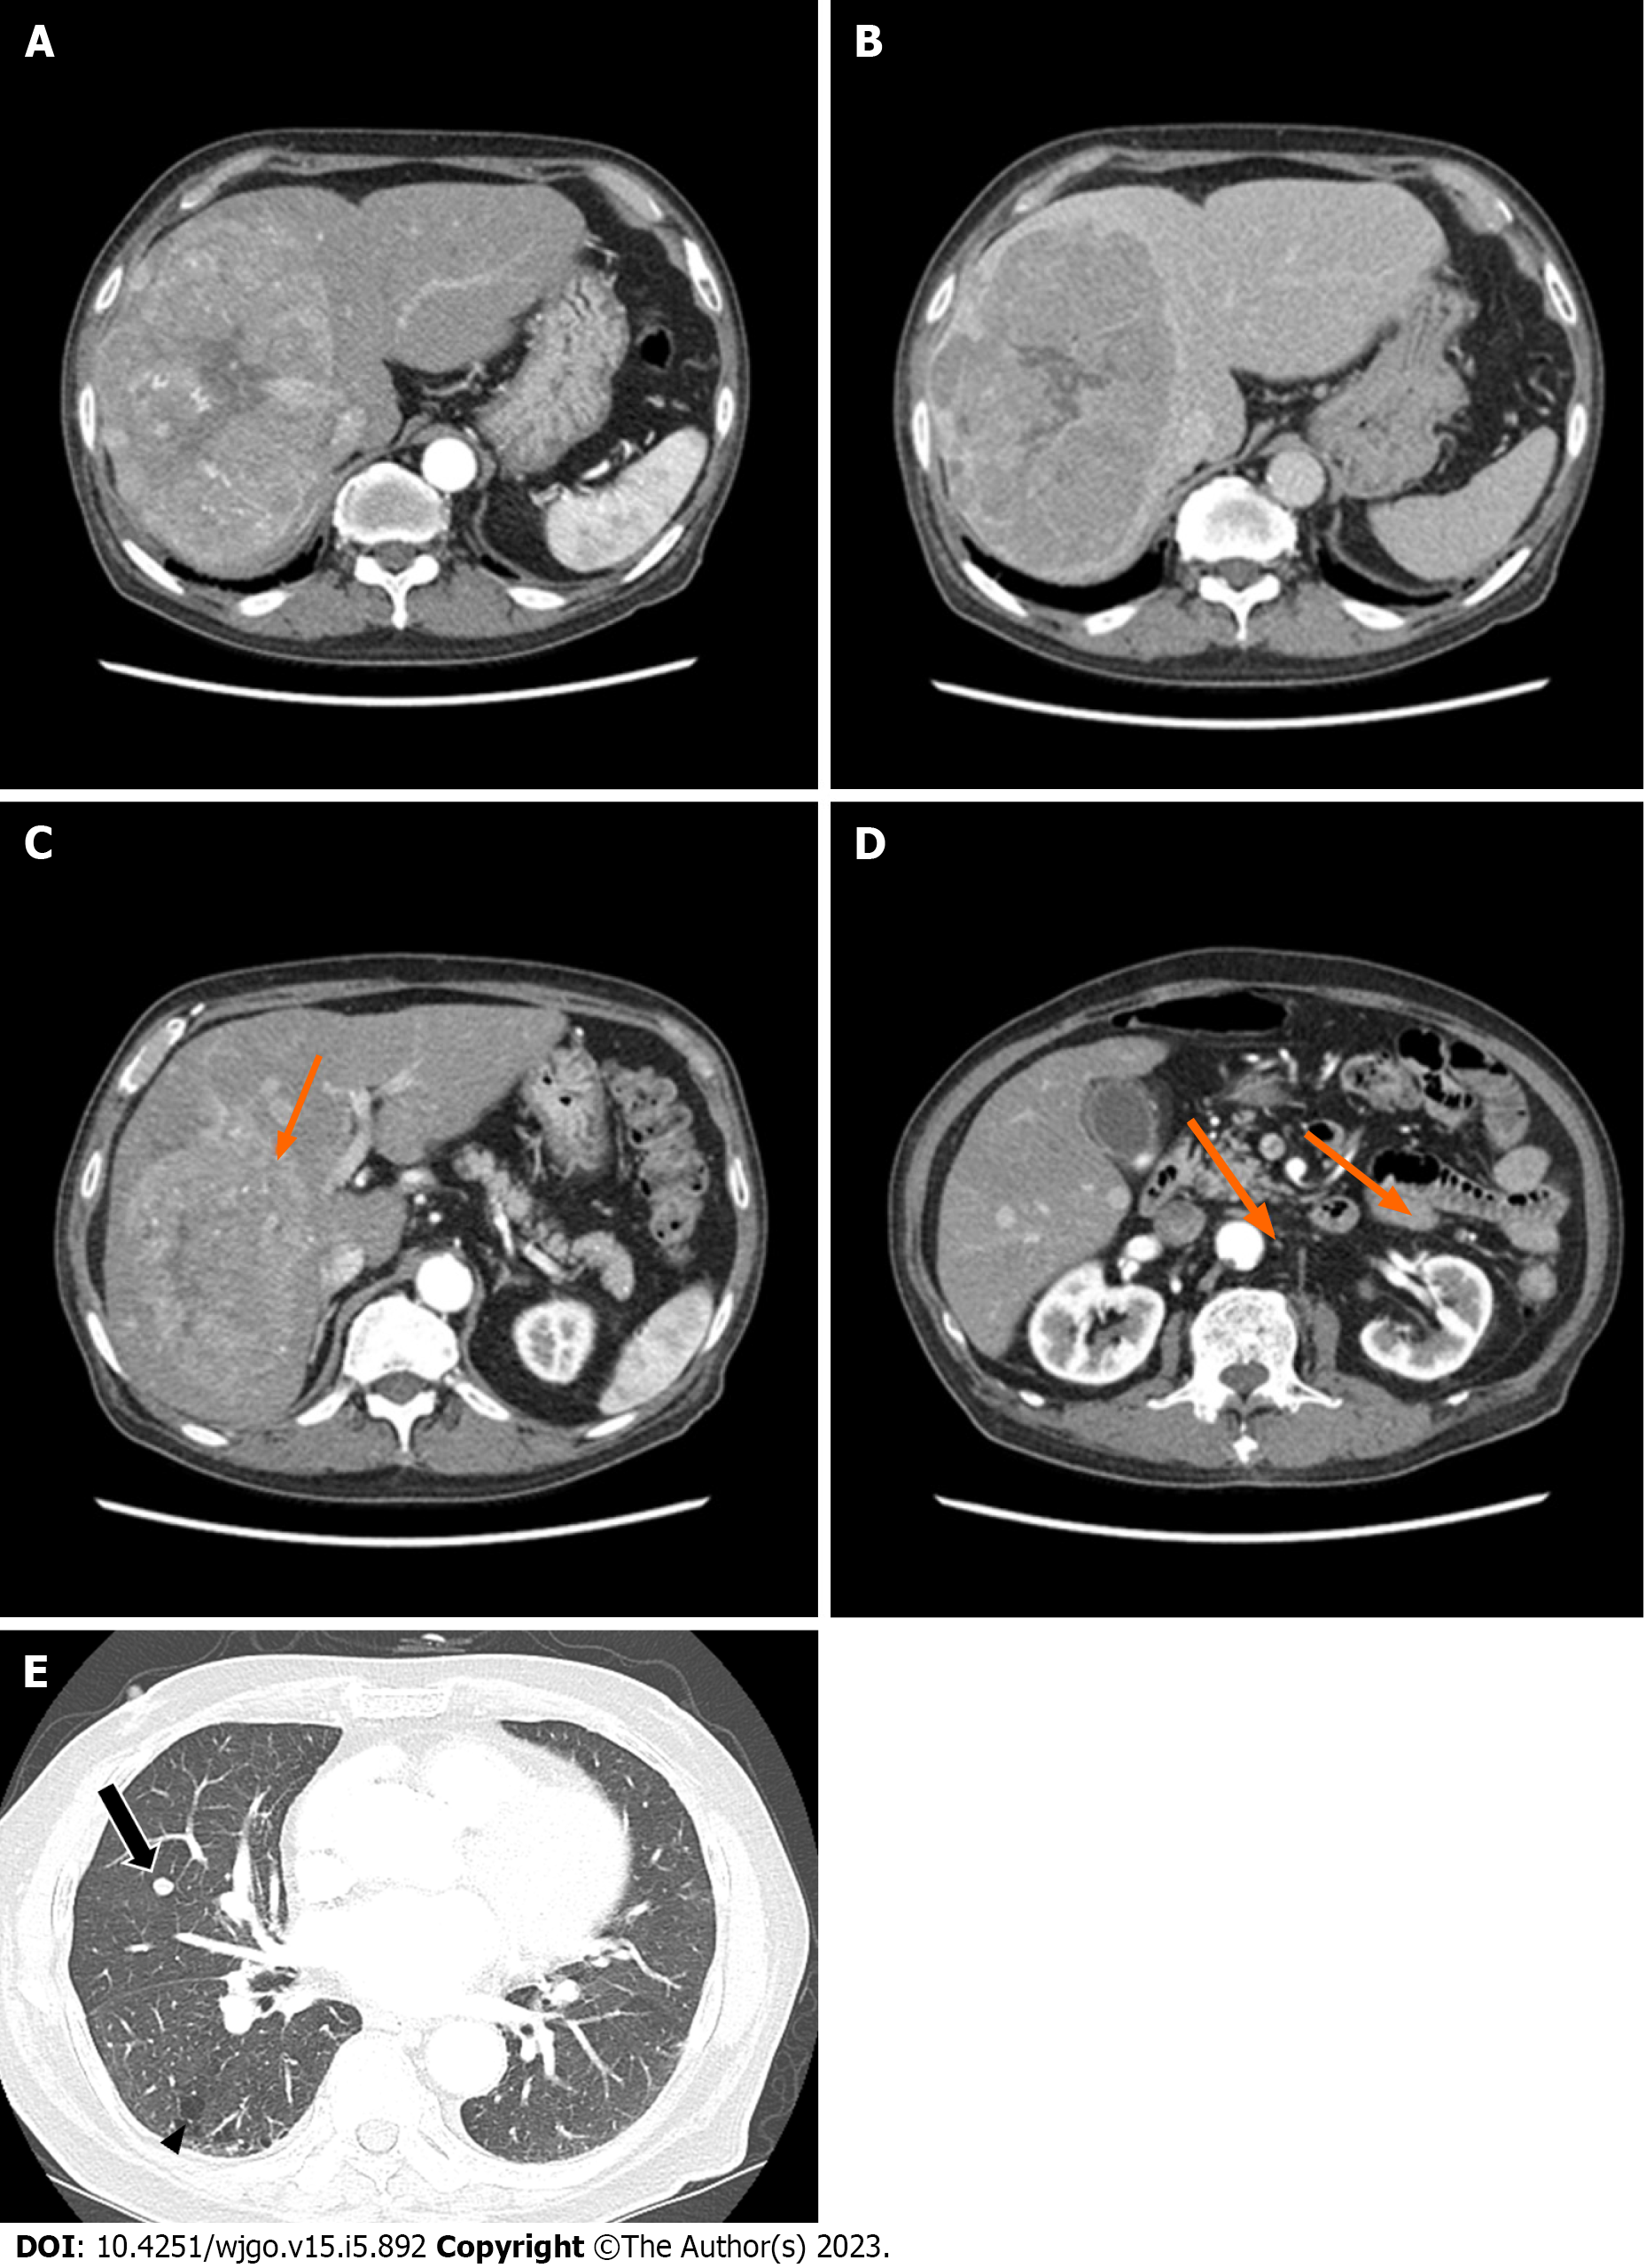
Figure 1 The patient’s abdominal dynamic computed tomography (CT) at the initial diagnosis.
(A, C, D; arterial phase, B; delayed phase). A and B: An oval mass with a size of 16 cm × 11 cm × 10 cm was located in the right hepatic lobe with early enhancement and delayed washout features; C and D: Several satellite nodules were examined in the liver (orange arrows); E: The lung window of the transverse CT scan obtained at the level of the inferior pulmonary veins shows a well-defined round nodule, suspected to be a metastatic nodule, in the right middle lobe (arrow), as well as subpleural reticulation and non-emphysematous cysts (arrowhead).
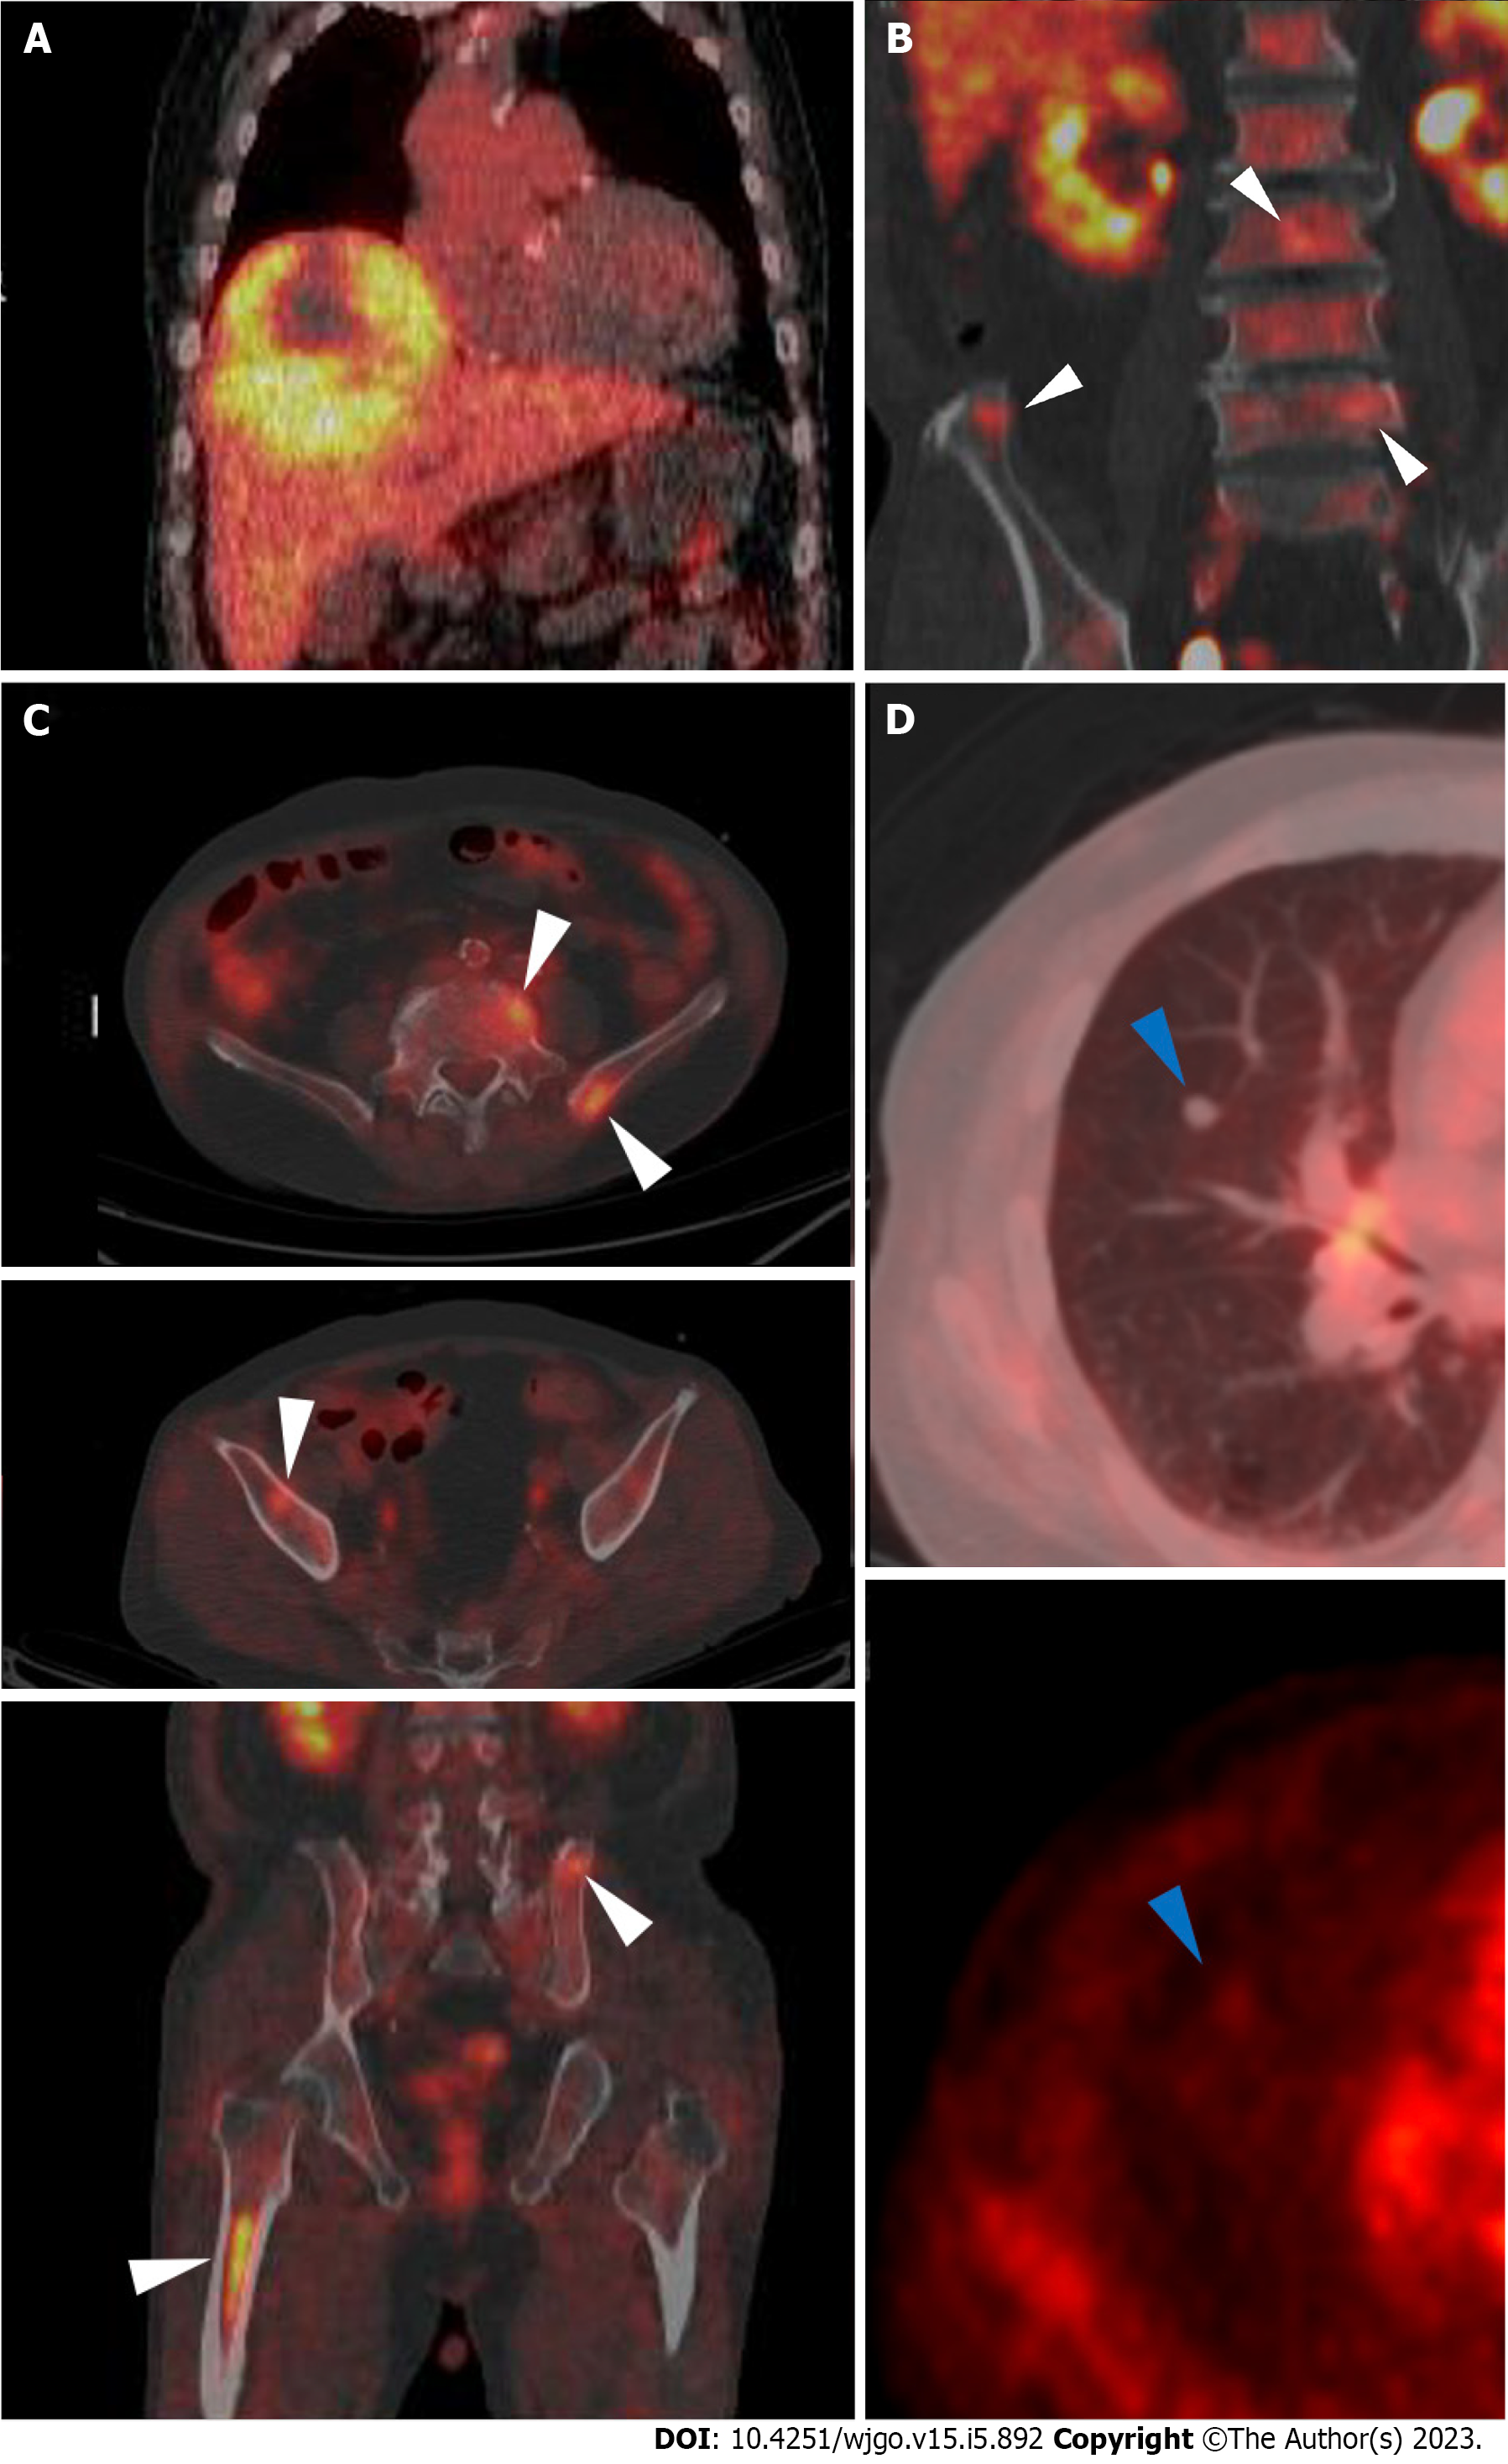
Figure 2 F-18 fluorodeoxyglucose positron emission tomography/computed tomography images.
A: A large hypermetabolic tumor was noted in the right hepatic lobe [maximum standardized uptake value (SUVmax) 5.1]; B and C: Multiple hypermetabolic lesions (SUVmax 4.8) are seen in both iliac bones, lumbar vertebrae, and the right femur (white arrowheads); D: A solid nodule with mild hypermetabolic activity was noted in the right middle lobe (blue arrowheads).
Figure 3 Digital subtraction angiography and completion angiography after transarterial radioembolization and chemoembolization.
A: The common hepatic artery angiogram shows a large hypervascular staining of the main mass. The satellite nodules of the right inferior lobe are not identified in this image. No tumor staining is found at the cranial portion of the tumor; B: The left inferior phrenic artery angiogram shows a hypervascular staining of the cranial portion of the tumor. This branch was embolized with tris-acryl gelatin microspheres and gelatin sponge particles; C: The completion angiogram shows the decreased staining of the main mass and lipiodol-laden tumors (orange arrows) in the right hepatic lobe.
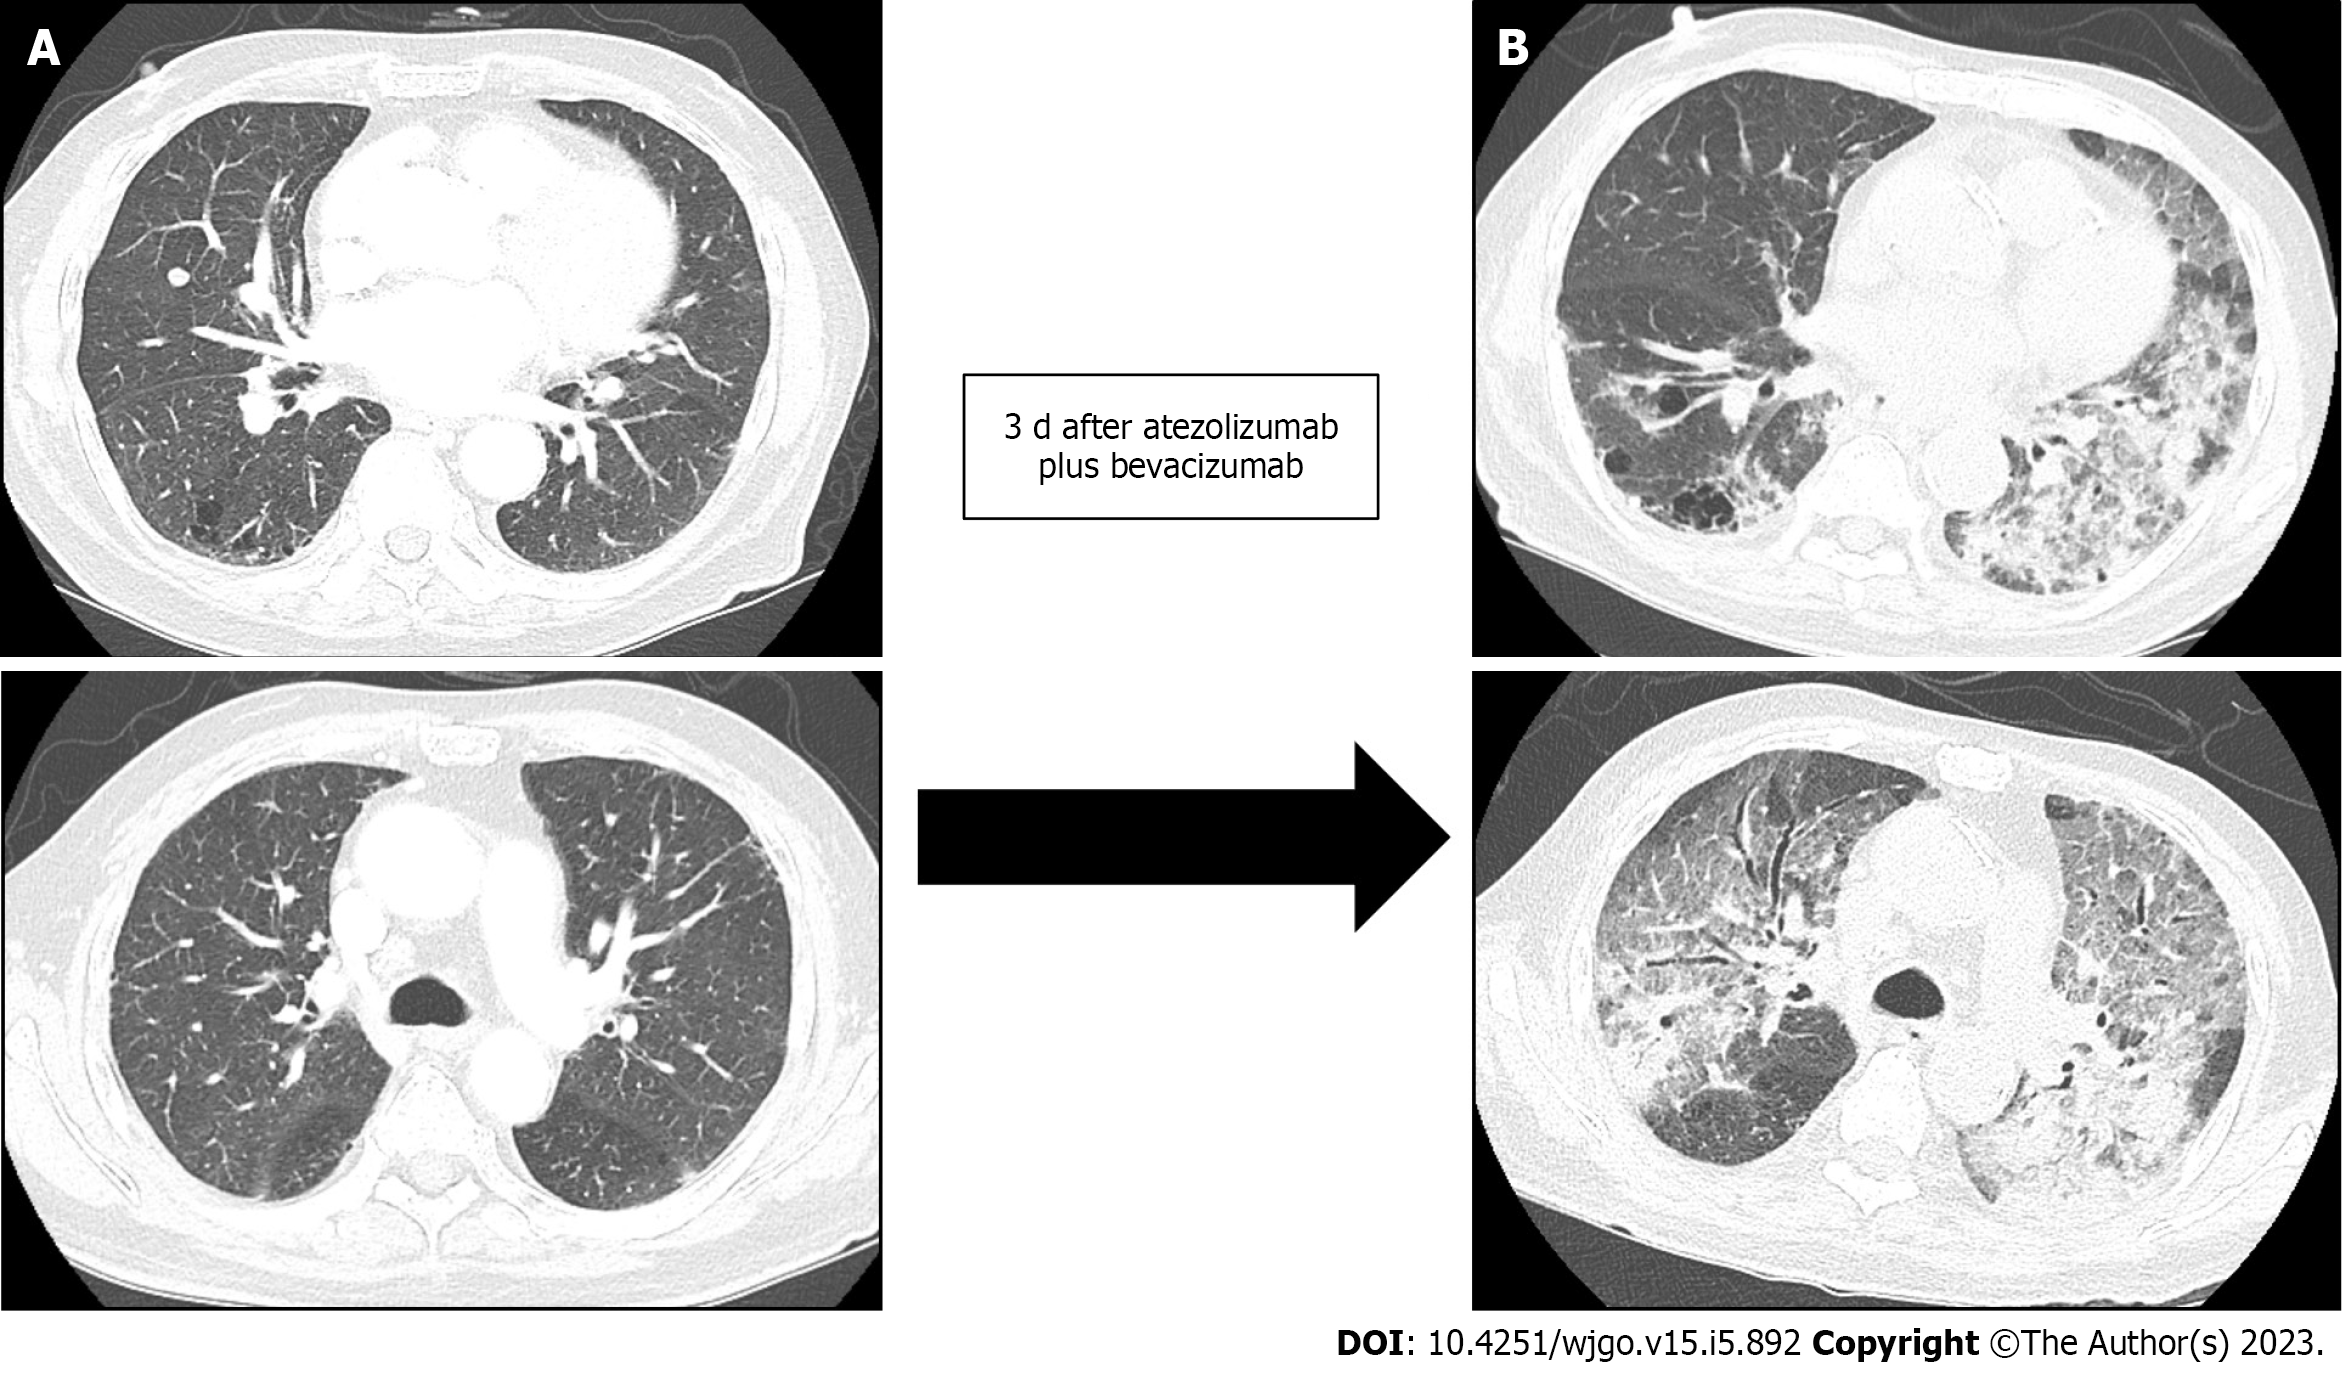
Figure 4 Development of acute respiratory distress syndrome three days after the combination therapy of atezolizumab and beva
- Citation: Cho SH, You GR, Park C, Cho SG, Lee JE, Choi SK, Cho SB, Yoon JH. Acute respiratory distress syndrome and severe pneumonitis after atezolizumab plus bevacizumab for hepatocellular carcinoma treatment: A case report. World J Gastrointest Oncol 2023; 15(5): 892-901
- URL: https://www.wjgnet.com/1948-5204/full/v15/i5/892.htm
- DOI: https://dx.doi.org/10.4251/wjgo.v15.i5.892


