Copyright
©The Author(s) 2023.
World J Gastrointest Oncol. May 15, 2023; 15(5): 843-858
Published online May 15, 2023. doi: 10.4251/wjgo.v15.i5.843
Published online May 15, 2023. doi: 10.4251/wjgo.v15.i5.843
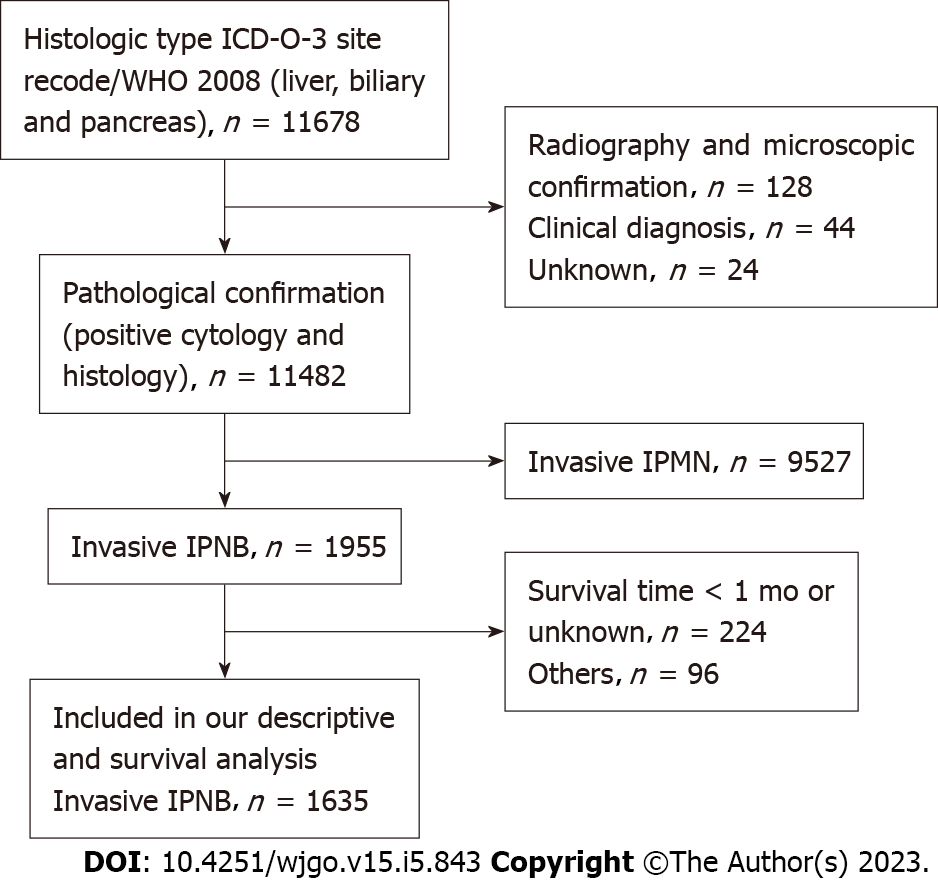
Figure 1 Flow diagram of individual selection from the 11678 individuals identified to have invasive intraductal papillary neoplasm of the bile duct within the Surveillance, Epidemiology, and End Results database from 1975-2016 to identify those who were included in our descriptive (excluding incidence trends) and survival analyses.
IPNB: Intraductal papillary neoplasm of the bile duct.
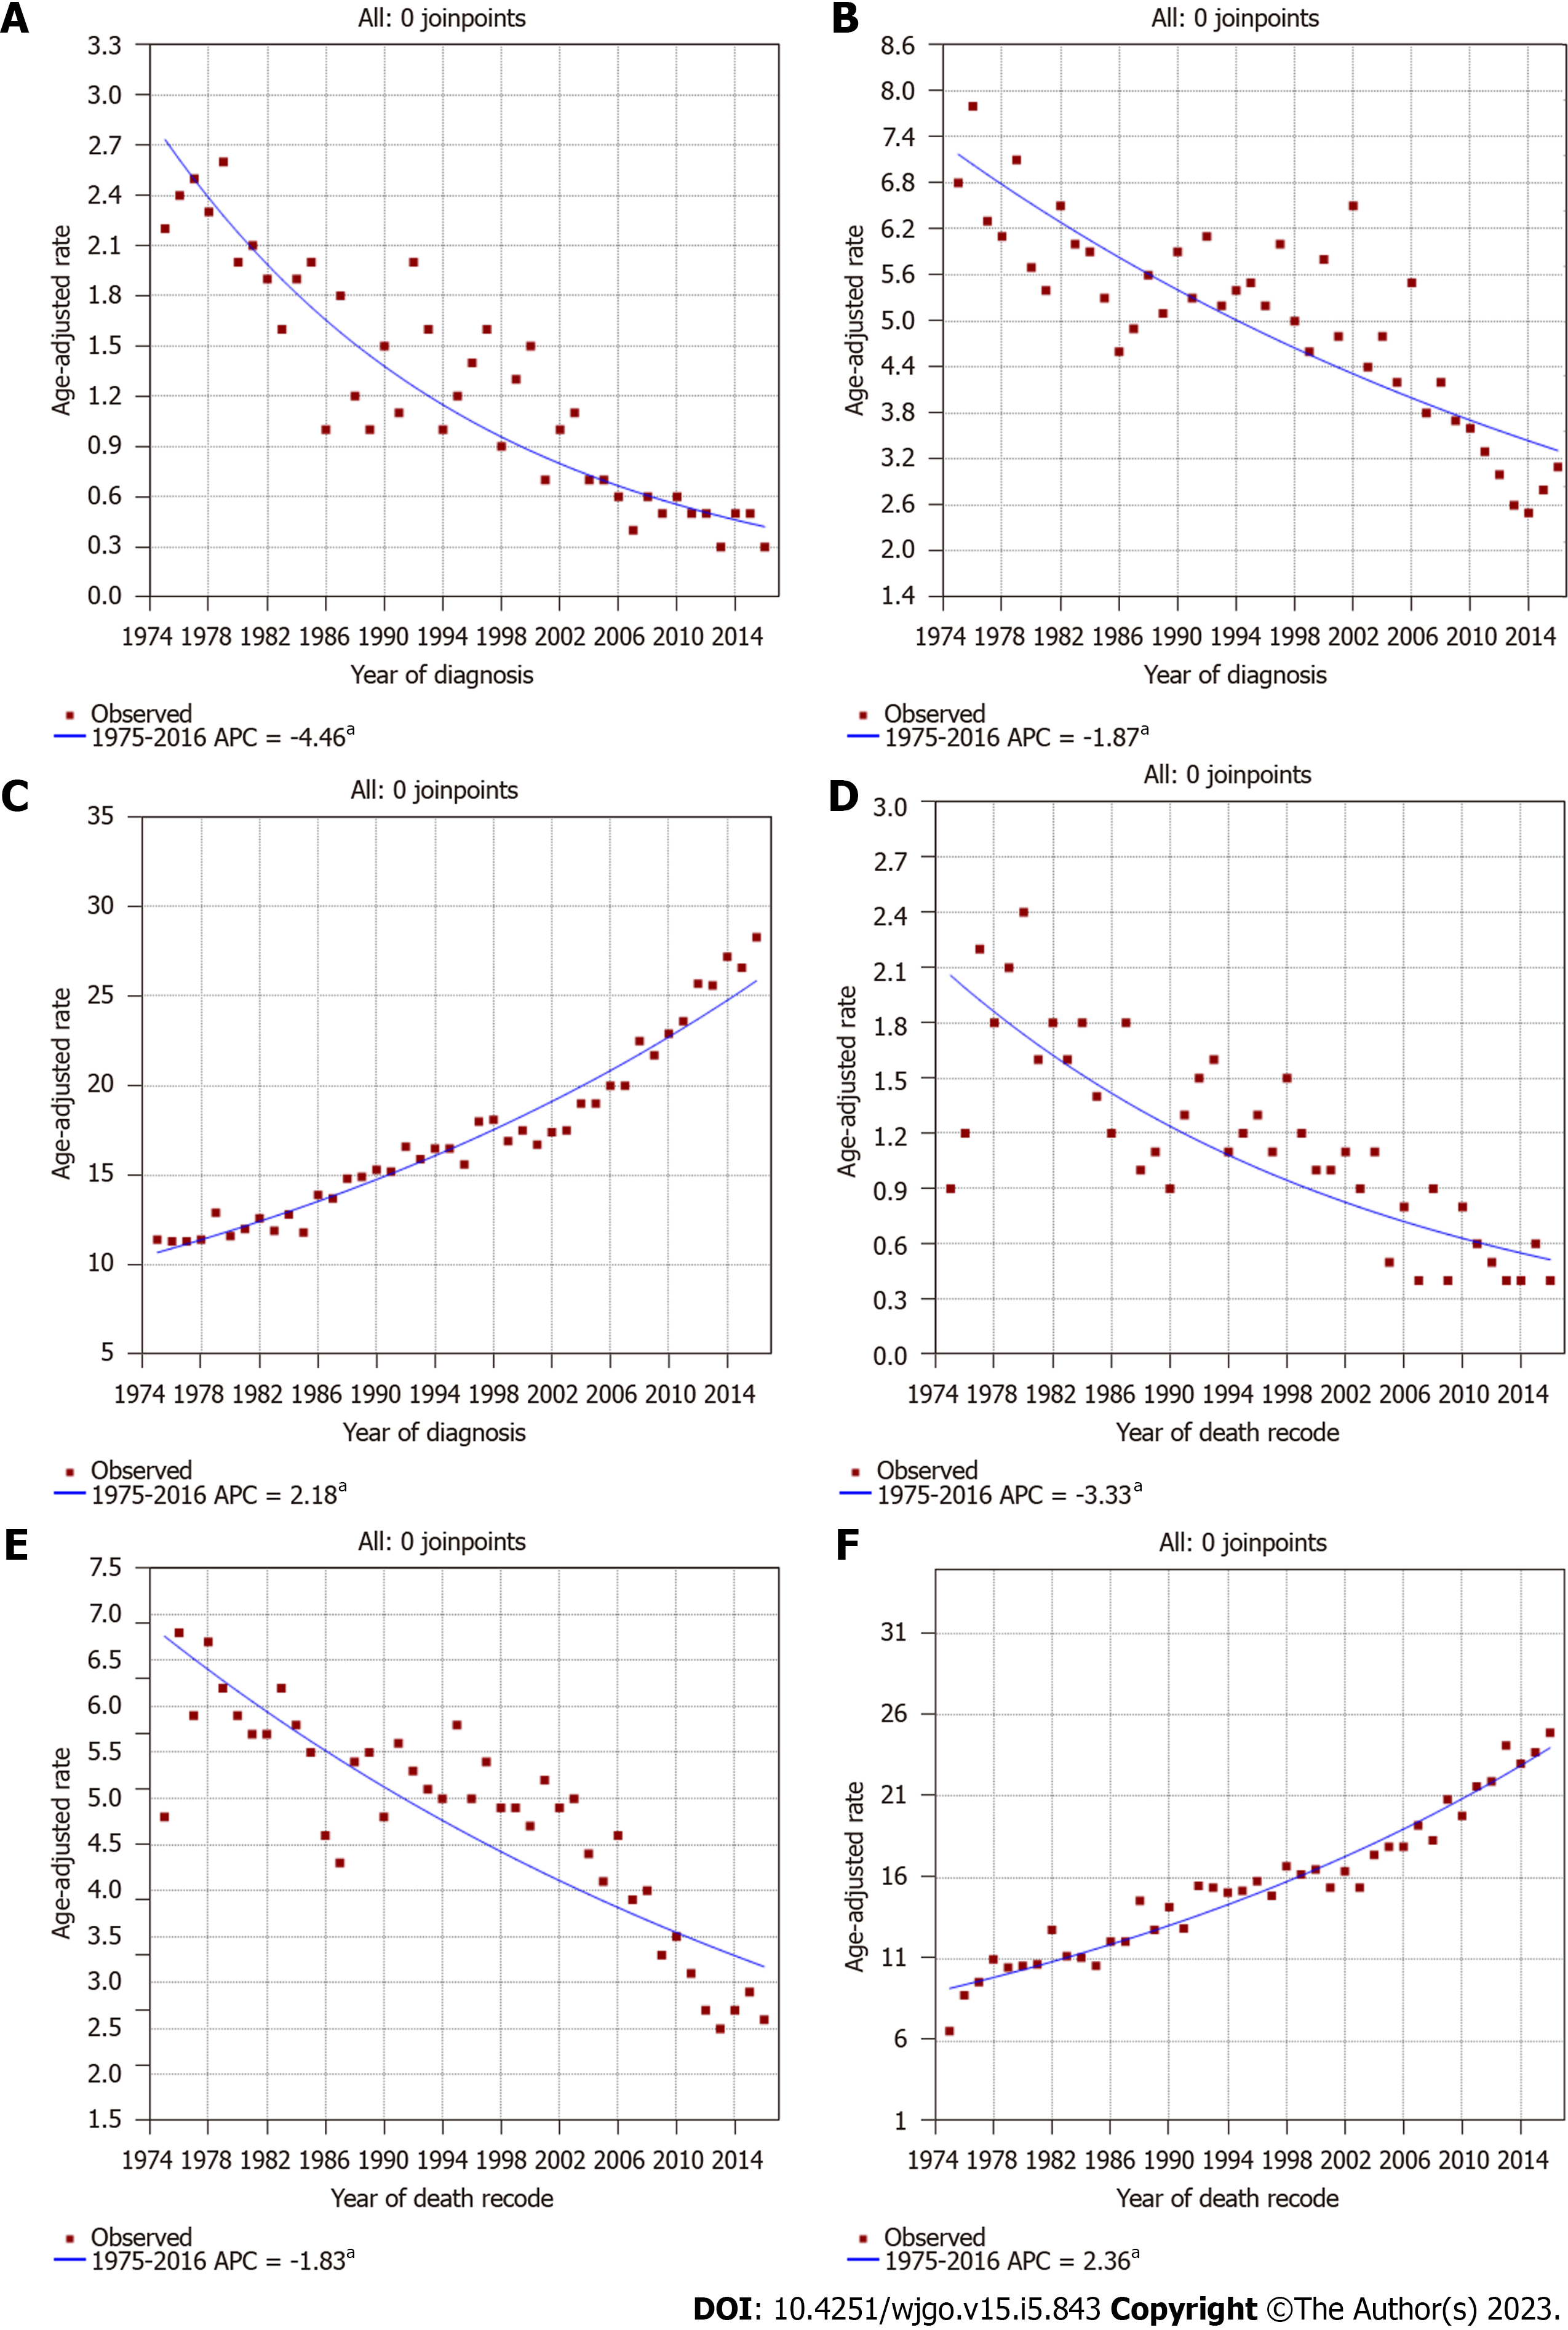
Figure 2 Incidence and incidence-based mortality trends for invasive intraductal papillary neoplasm of the bile duct, invasive intraductal papillary mucinous neoplasm of the pancreas, and traditional cholangiocarcinoma in Surveillance, Epidemiology, and End Results 9 regs research data, Nov 2018 Sub (1975-2016).
aP < 0.05. A: Incidence trends in invasive intraductal papillary neoplasm of the bile duct (IPNB); B: Incidence trends in invasive intraductal papillary mucinous neoplasm of the pancreas (IPMN); C: Incidence trends in traditional cholangiocarcinoma; D: Incidence-based (IB) mortality trends in invasive IPNB; E: IB mortality trends in invasive IPMN; F: IB mortality trends in traditional cholangiocarcinoma.
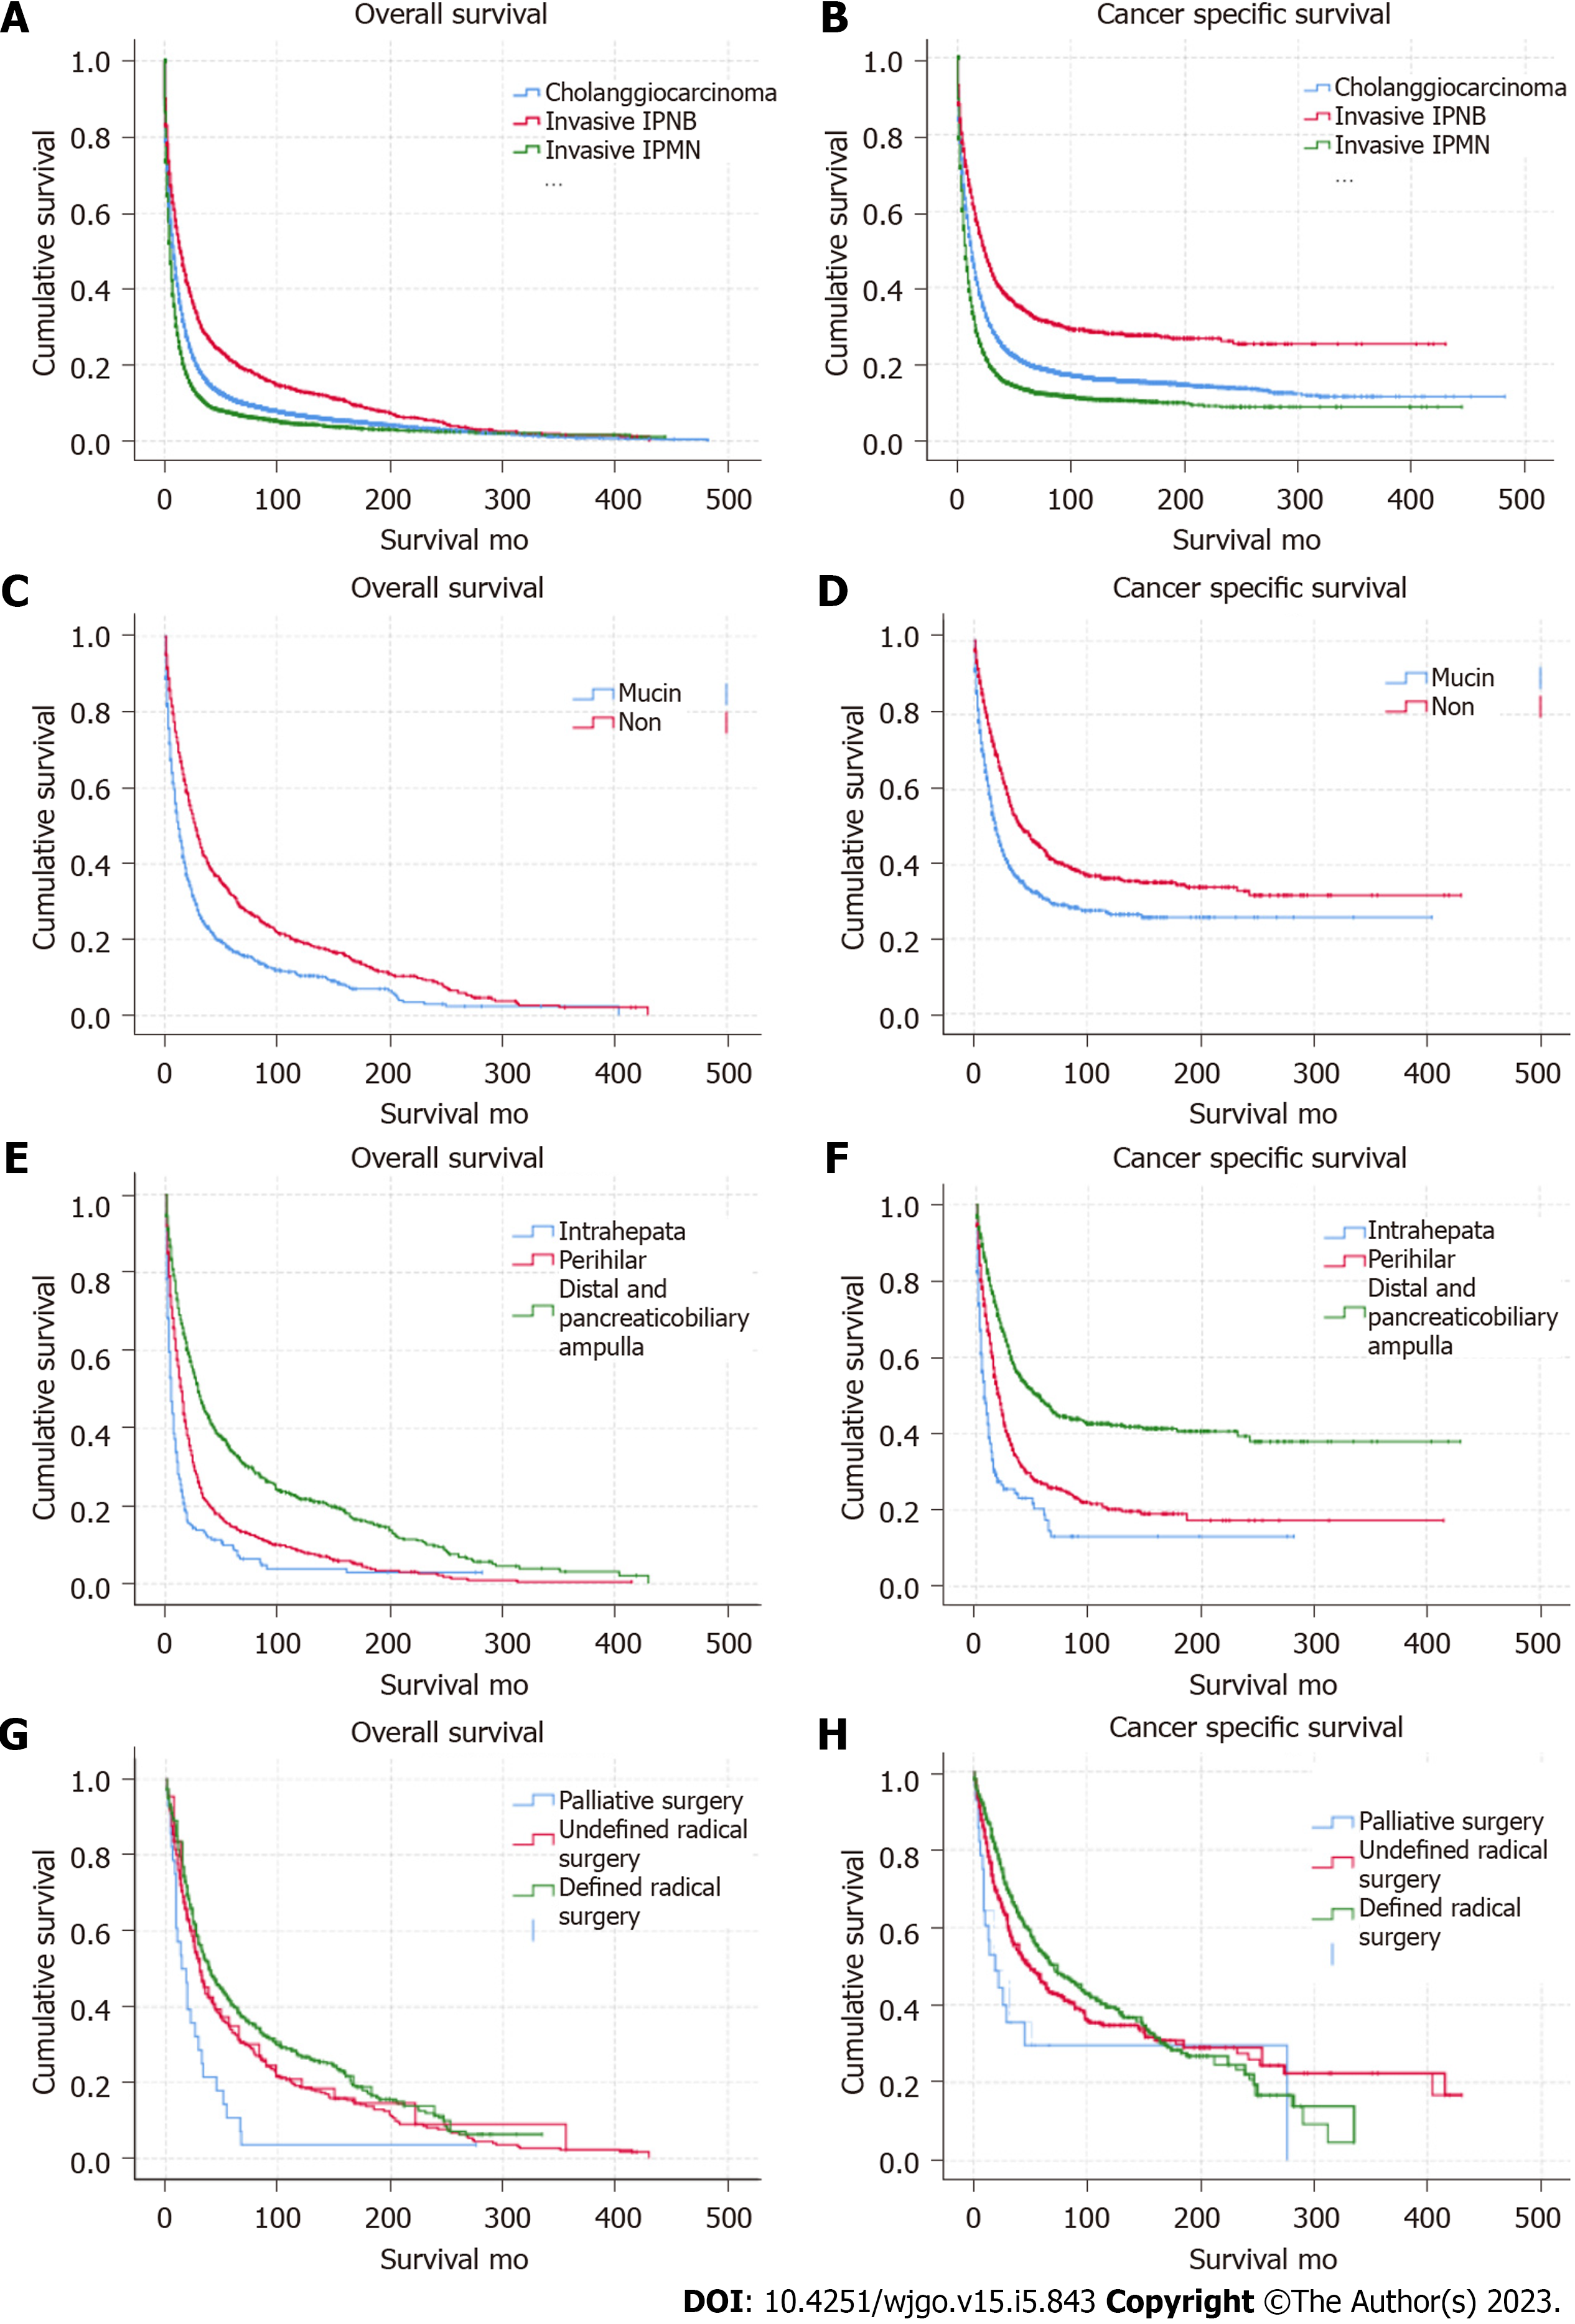
Figure 3 Long-term overall survival and cancer-specific survival outcomes using Kaplan-Meier analysis.
A and B: Overall survival (OS) and cancer-specific survival (CSS) were better for invasive intraductal papillary neoplasm of the bile duct (IPNB) and worse for invasive intraductal papillary mucinous neoplasm of the pancreas (IPMN) compared with traditional cholangiocarcinoma (P < 0.001); C and D: OS and CSS in individuals with the non-mucin subtype of invasive IPNB was better than for the mucin subtype (P < 0.05); E and F: OS and CSS in individuals with invasive IPNB at distal sites and at the pancreaticobiliary ampulla was better than at other sites (P < 0.001); G and H: OS and CSS in individuals with invasive IPNB with defined radical surgery was better than other type of surgical treatment (P < 0.001).
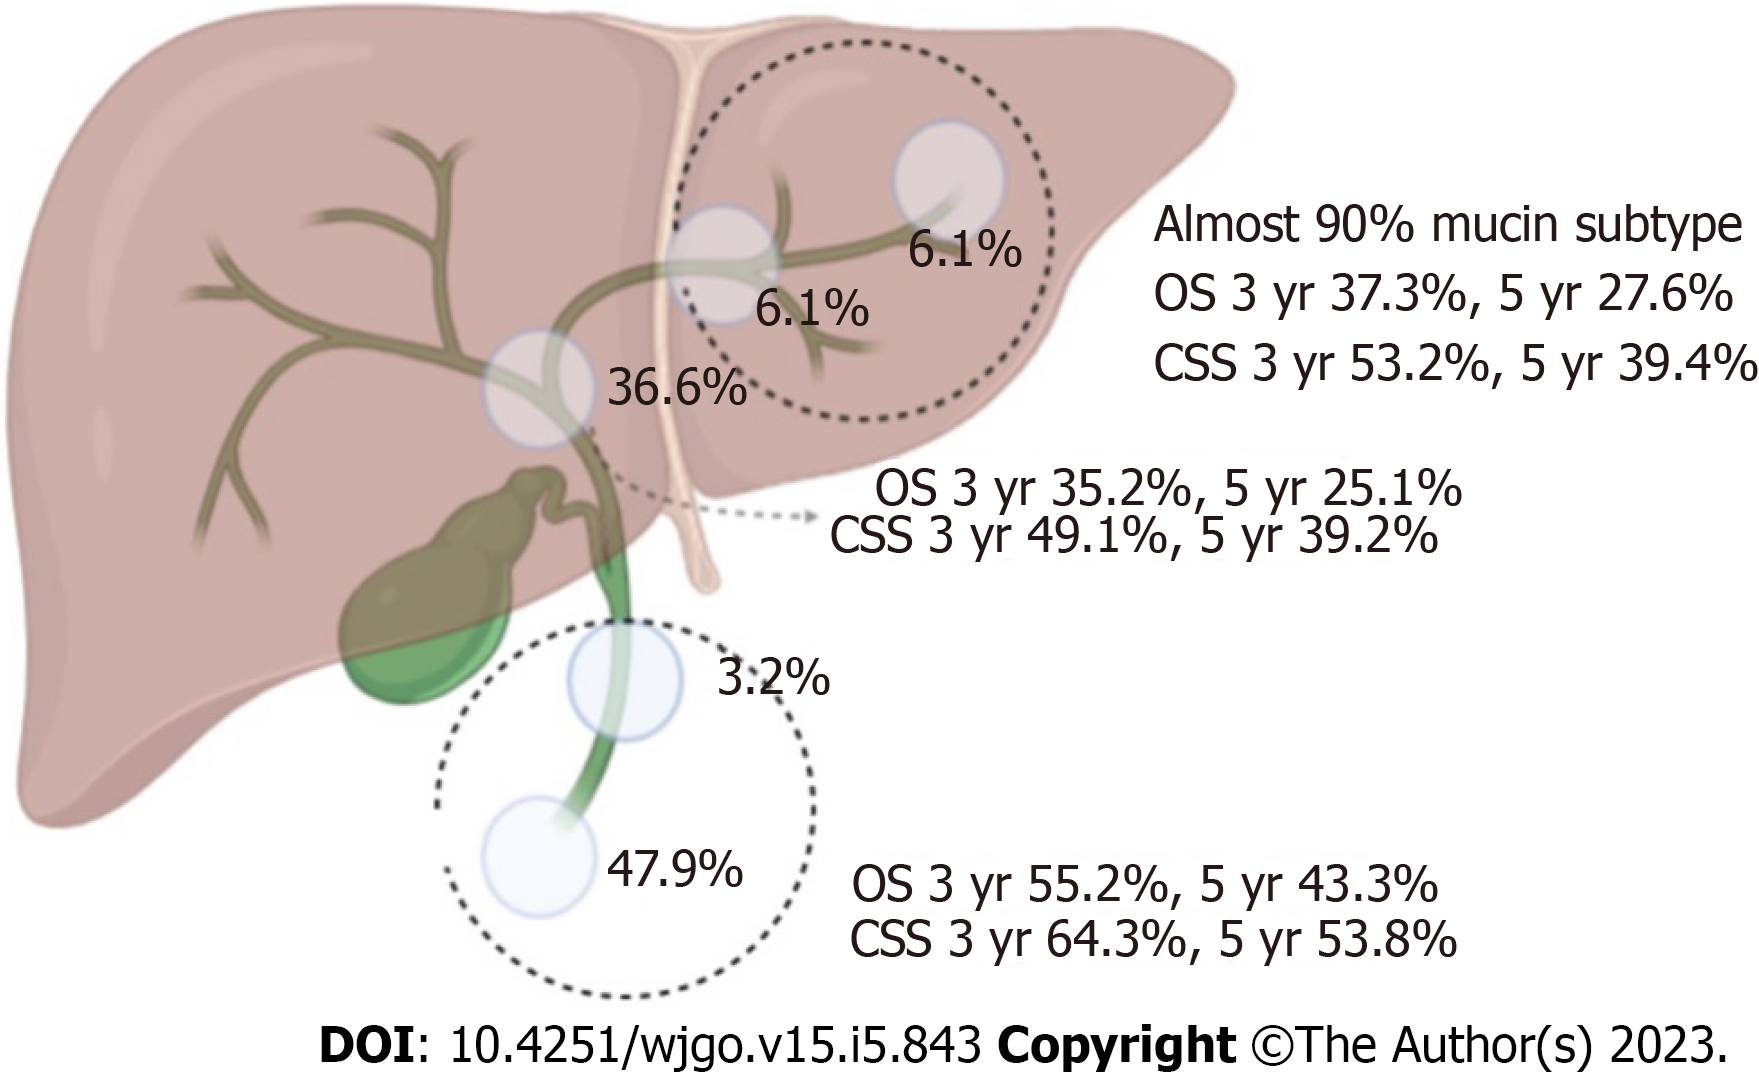
Figure 4 Percentage incidence at different sites, overall survival, and cancer-specific survival of invasive intraductal papillary neoplasm of the bile duct in the surgical group.
OS: Overall survival; CCS: Cancer-specific survival.
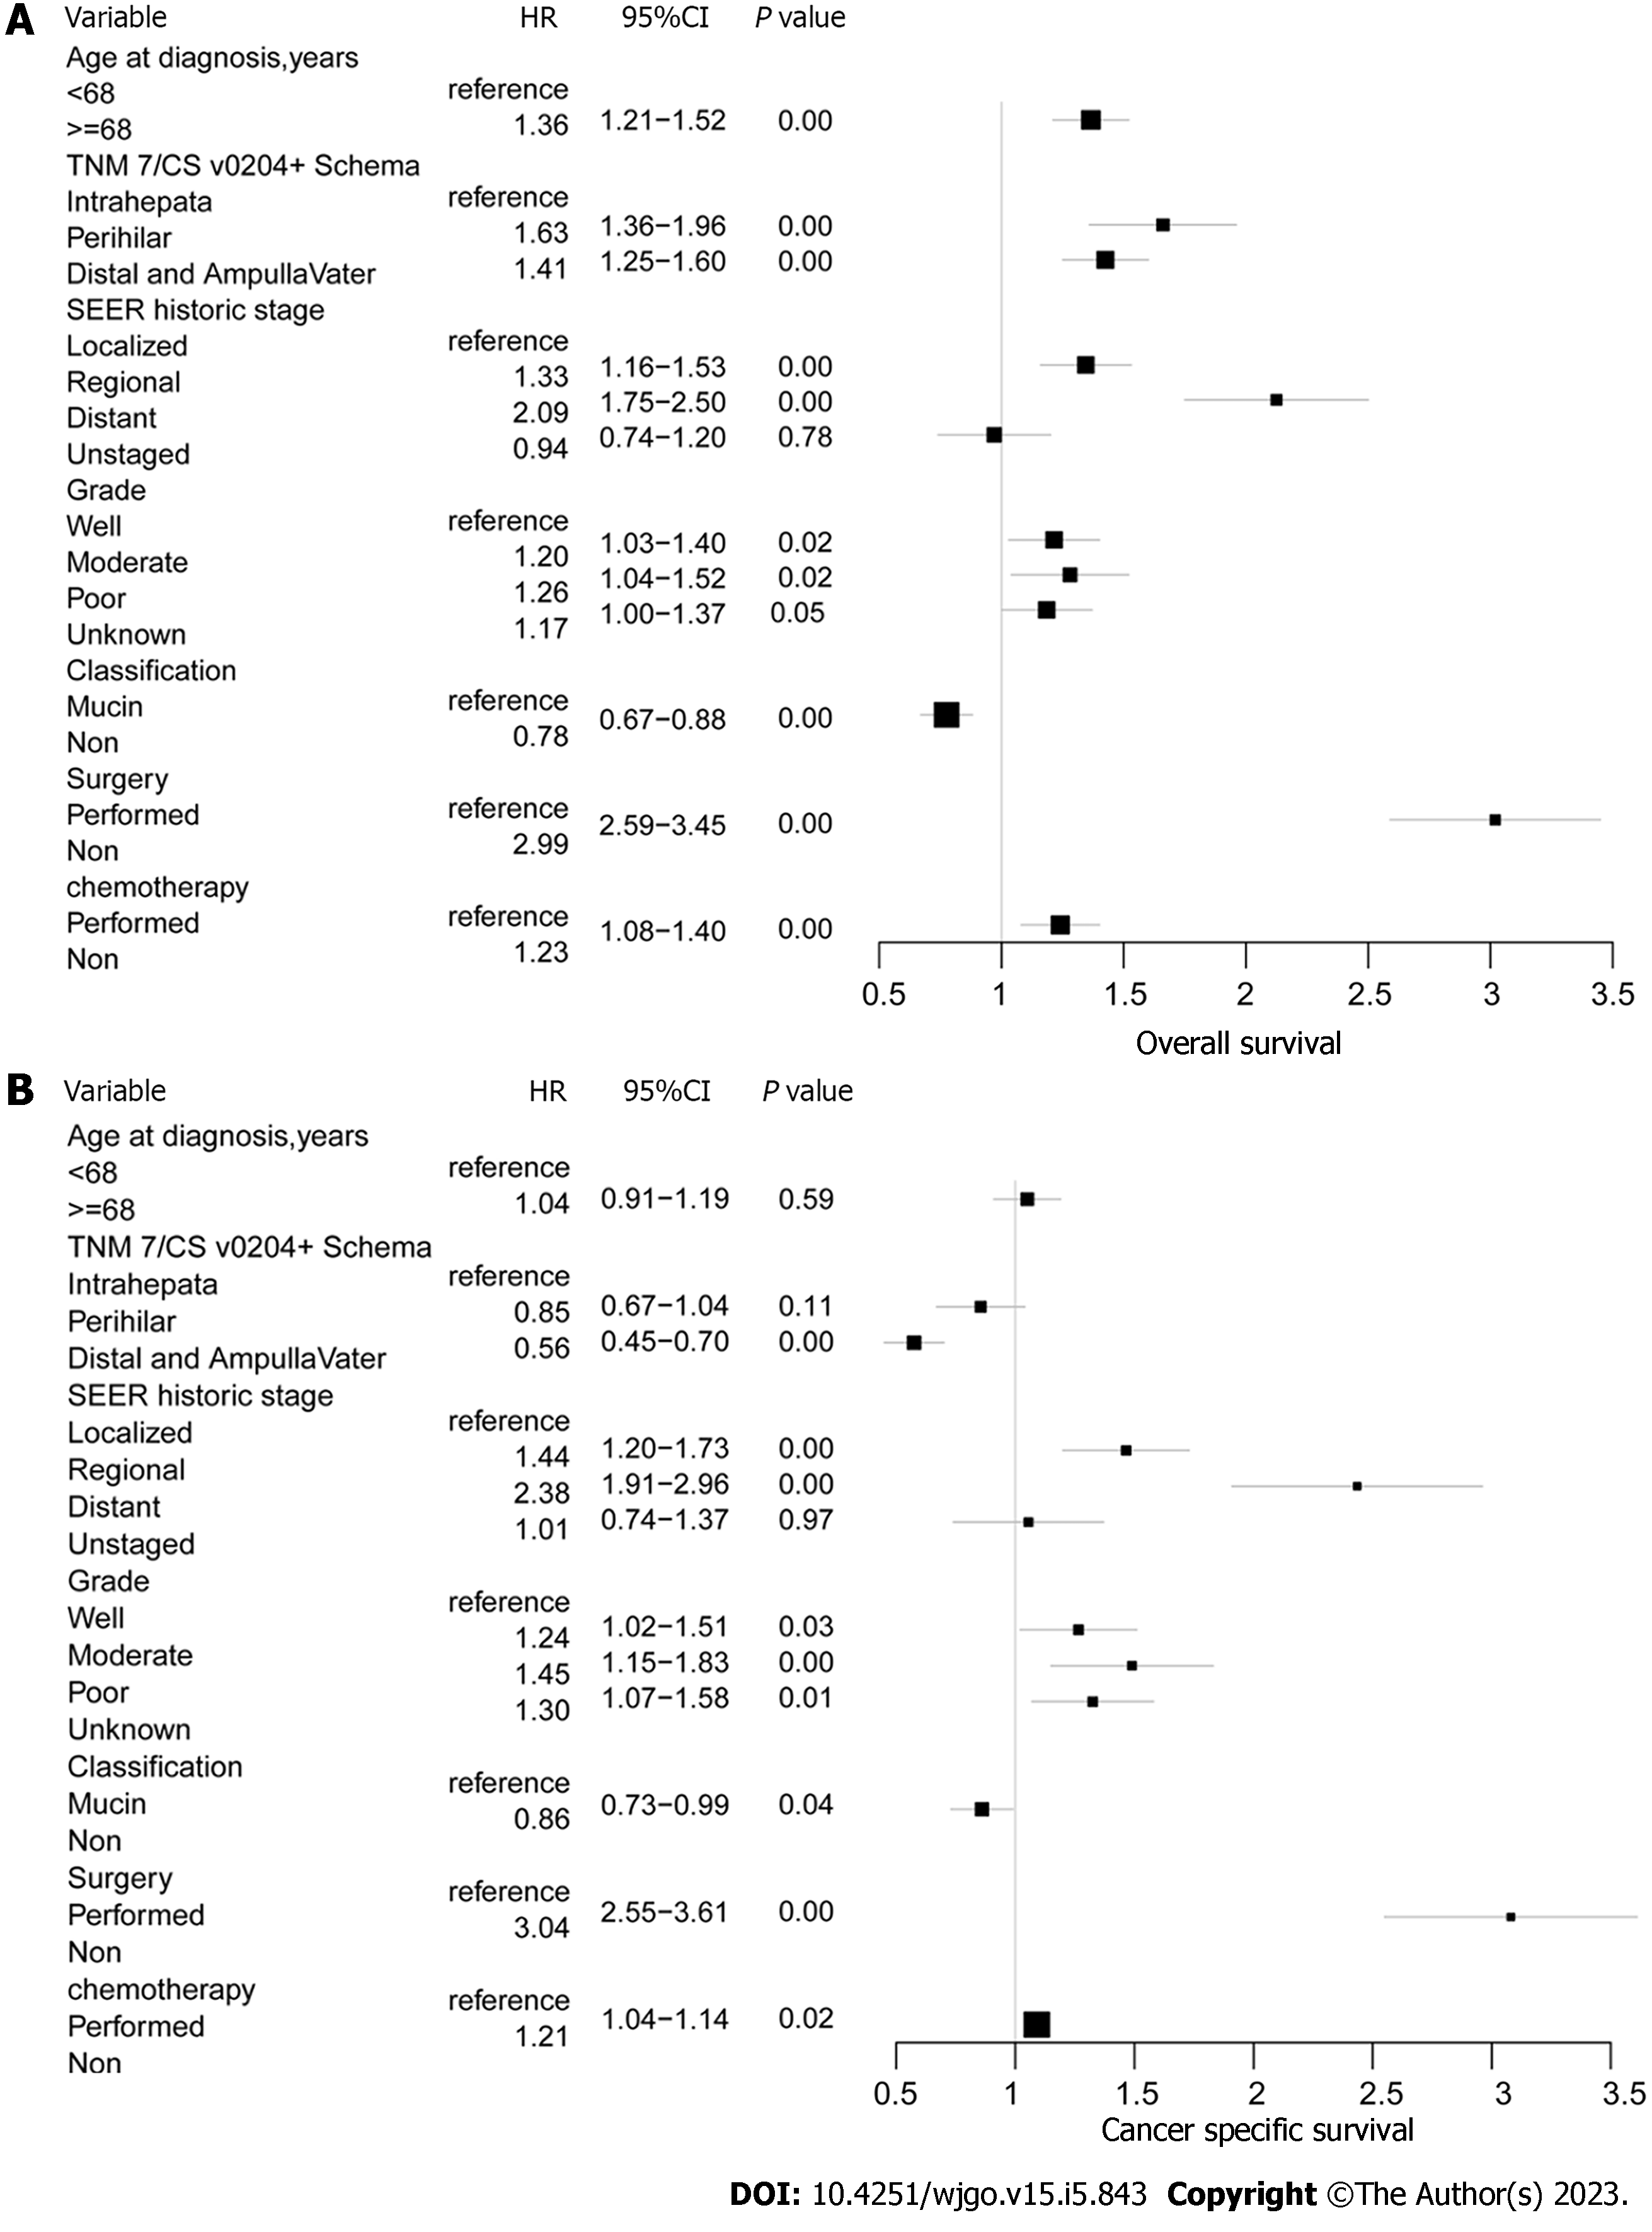
Figure 5 Cox proportional hazard regression analysis of overall survival, and cancer-specific survival for total invasive intraductal papillary neoplasm of the bile duct.
A: Overall survival; B: Cancer-specific survival.
- Citation: Wu RS, Liao WJ, Ma JS, Wang JK, Wu LQ, Hou P. Epidemiology and outcome of individuals with intraductal papillary neoplasms of the bile duct. World J Gastrointest Oncol 2023; 15(5): 843-858
- URL: https://www.wjgnet.com/1948-5204/full/v15/i5/843.htm
- DOI: https://dx.doi.org/10.4251/wjgo.v15.i5.843


