Copyright
©The Author(s) 2023.
World J Gastrointest Oncol. May 15, 2023; 15(5): 810-827
Published online May 15, 2023. doi: 10.4251/wjgo.v15.i5.810
Published online May 15, 2023. doi: 10.4251/wjgo.v15.i5.810
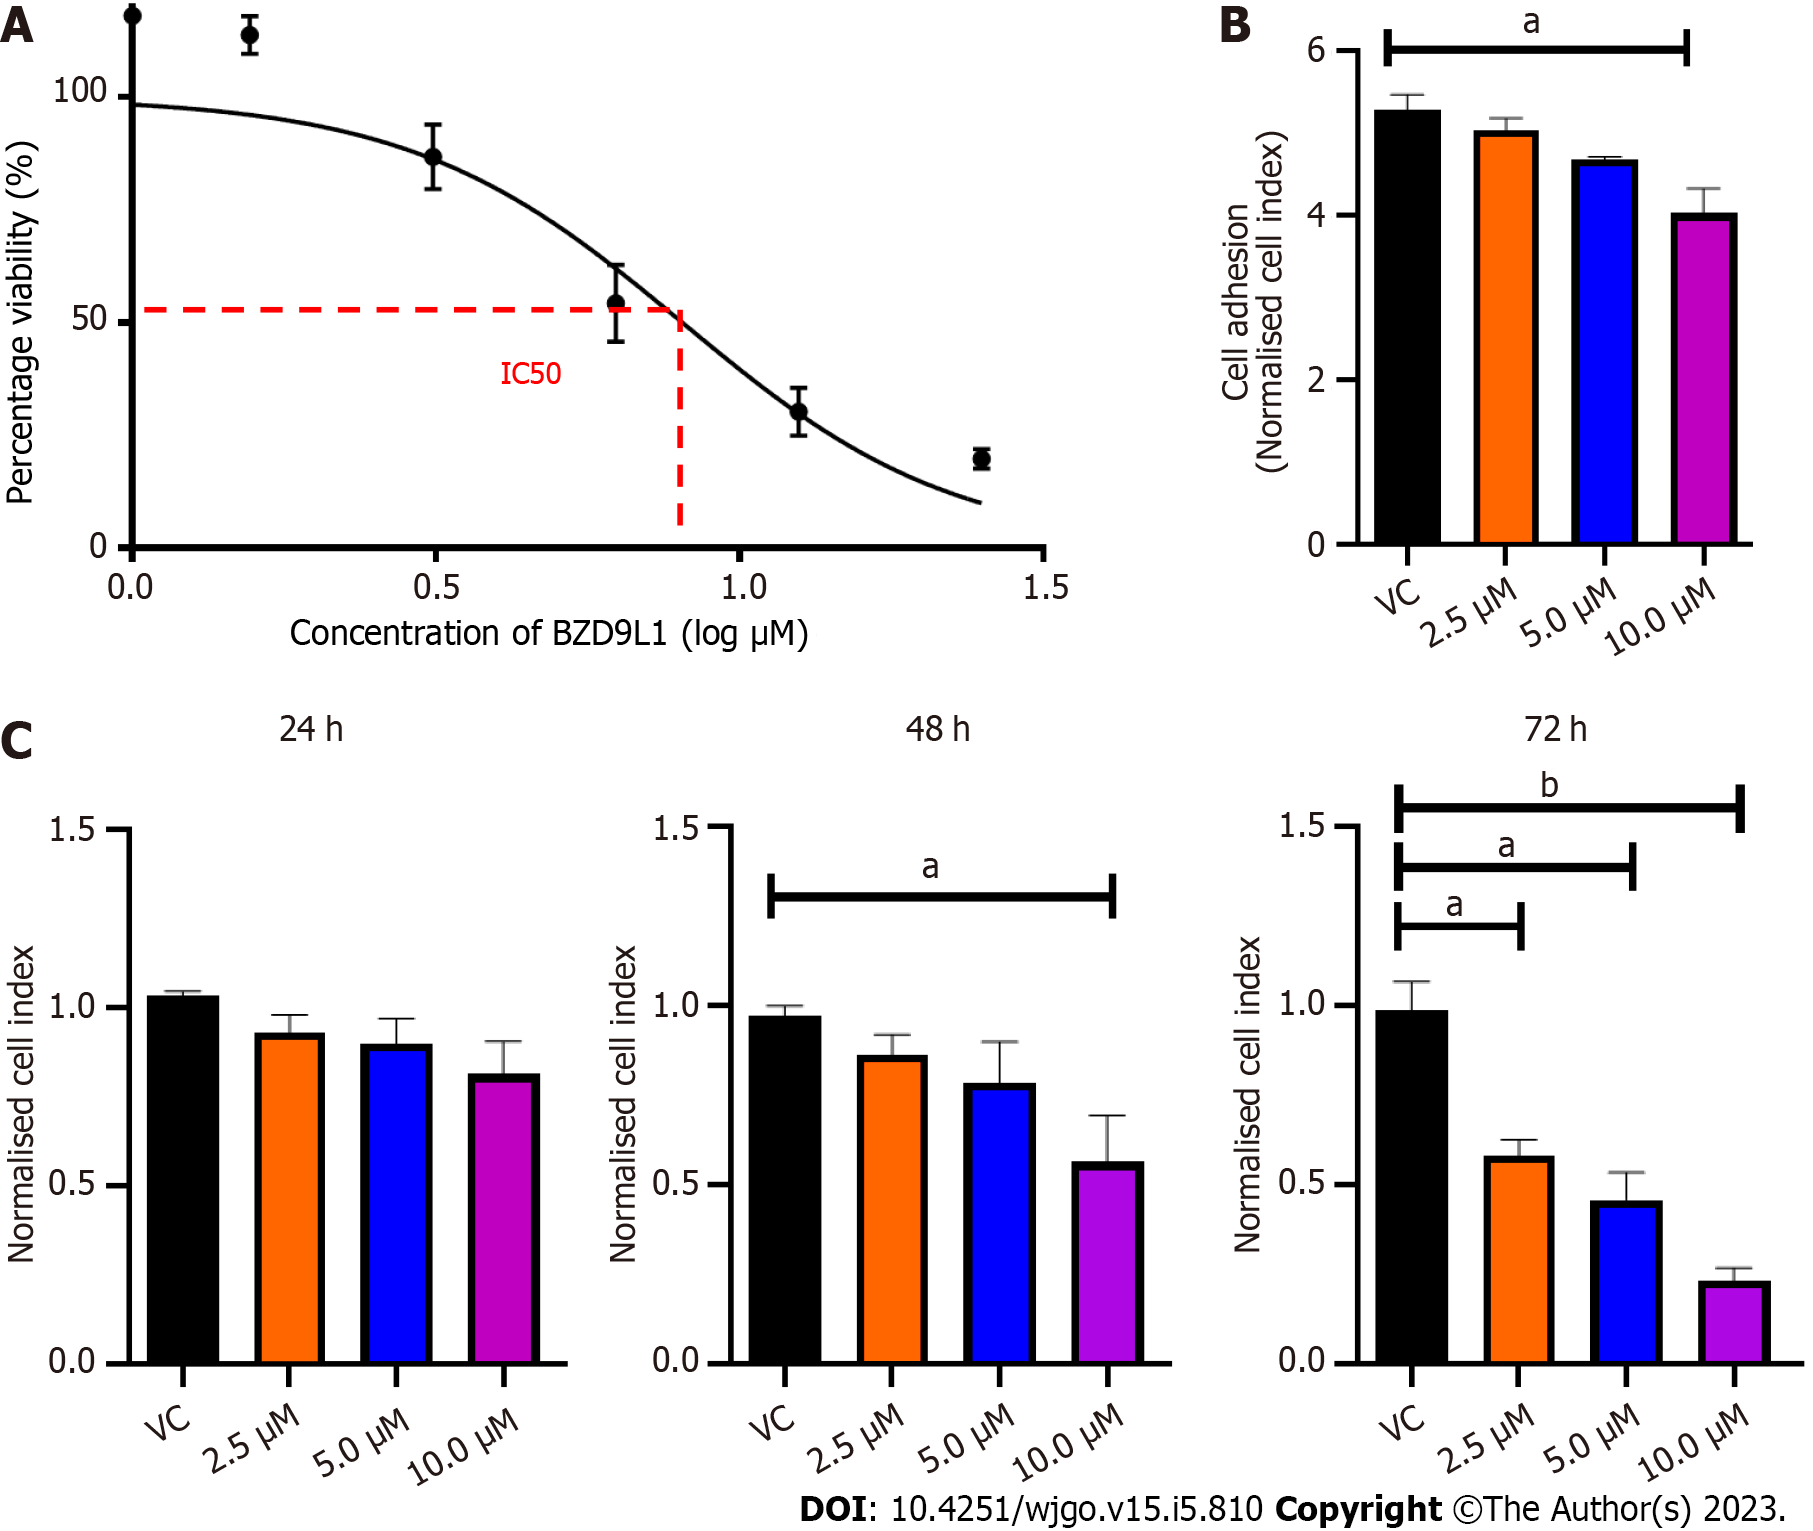
Figure 1 Cell viability and adhesion analyses of Ea.
HY926 endothelial cells treated with different concentrations of BZD9L1. A: Cell viability was determined using the MTT assay. The inhibitory concentration of BZD9L1 in Ea HY926 is 5.20 μm ± 0.38 μm (n = 3) at 72 h; B: Real-time xCELLigence impedance analysis of the area under the curve of BZD9L1-treated Ea.HY926 cells in suspension over 5 h. BZD9L1 at 10 μM reduced the ability of the endothelial cells to adhere to the microtiter plates (E-Plates®); C: Real-time xCELLigence impedance analysis of normalized cell index of BZD9L1-treated Ea.HY926 cells over 72 h. BZD9L1 at 2.5 μM and 5.0 μM had no significant impact on cell proliferation at 24 h and 48 h. Statistical analysis (aP < 0.05; bP < 0.01), one-way ANOVA with Bonferroni posthoc test, n = 3 independent experiments using GraphPad Prism 9.4.0. Error bars represent SEM. VC: Vehicle control.
Figure 2 Quantitative polymerase chain reaction analysis of Ea.
HY926 cells treated with BZD9L1 for 4 h. A: BZD9L1 reduced the gene expression levels of sirtuin 1 (SIRT1) and SIRT 2; B: Intercellular adhesion molecule 1 (ICAM-1), vascular endothelial cadherin (VE-cadherin) and integrin-alpha V (ITGA5) cell adhesion markers including ICAM-1, VE-cadherin and ITGA5, compared to the negative control (NC). Statistical analysis (cP < 0.001), one-way ANOVA with Bonferroni posthoc test, n = 3 independent experiments using GraphPad Prism 9.4.0. Error bars represent SEM. SIRT: Sirtuin; ICAM-1: Intercellular adhesion molecule 1; NC: Negative control; VE-cadherin: Vascular endothelial cadherin; ITGA5: Integrin-alpha V.
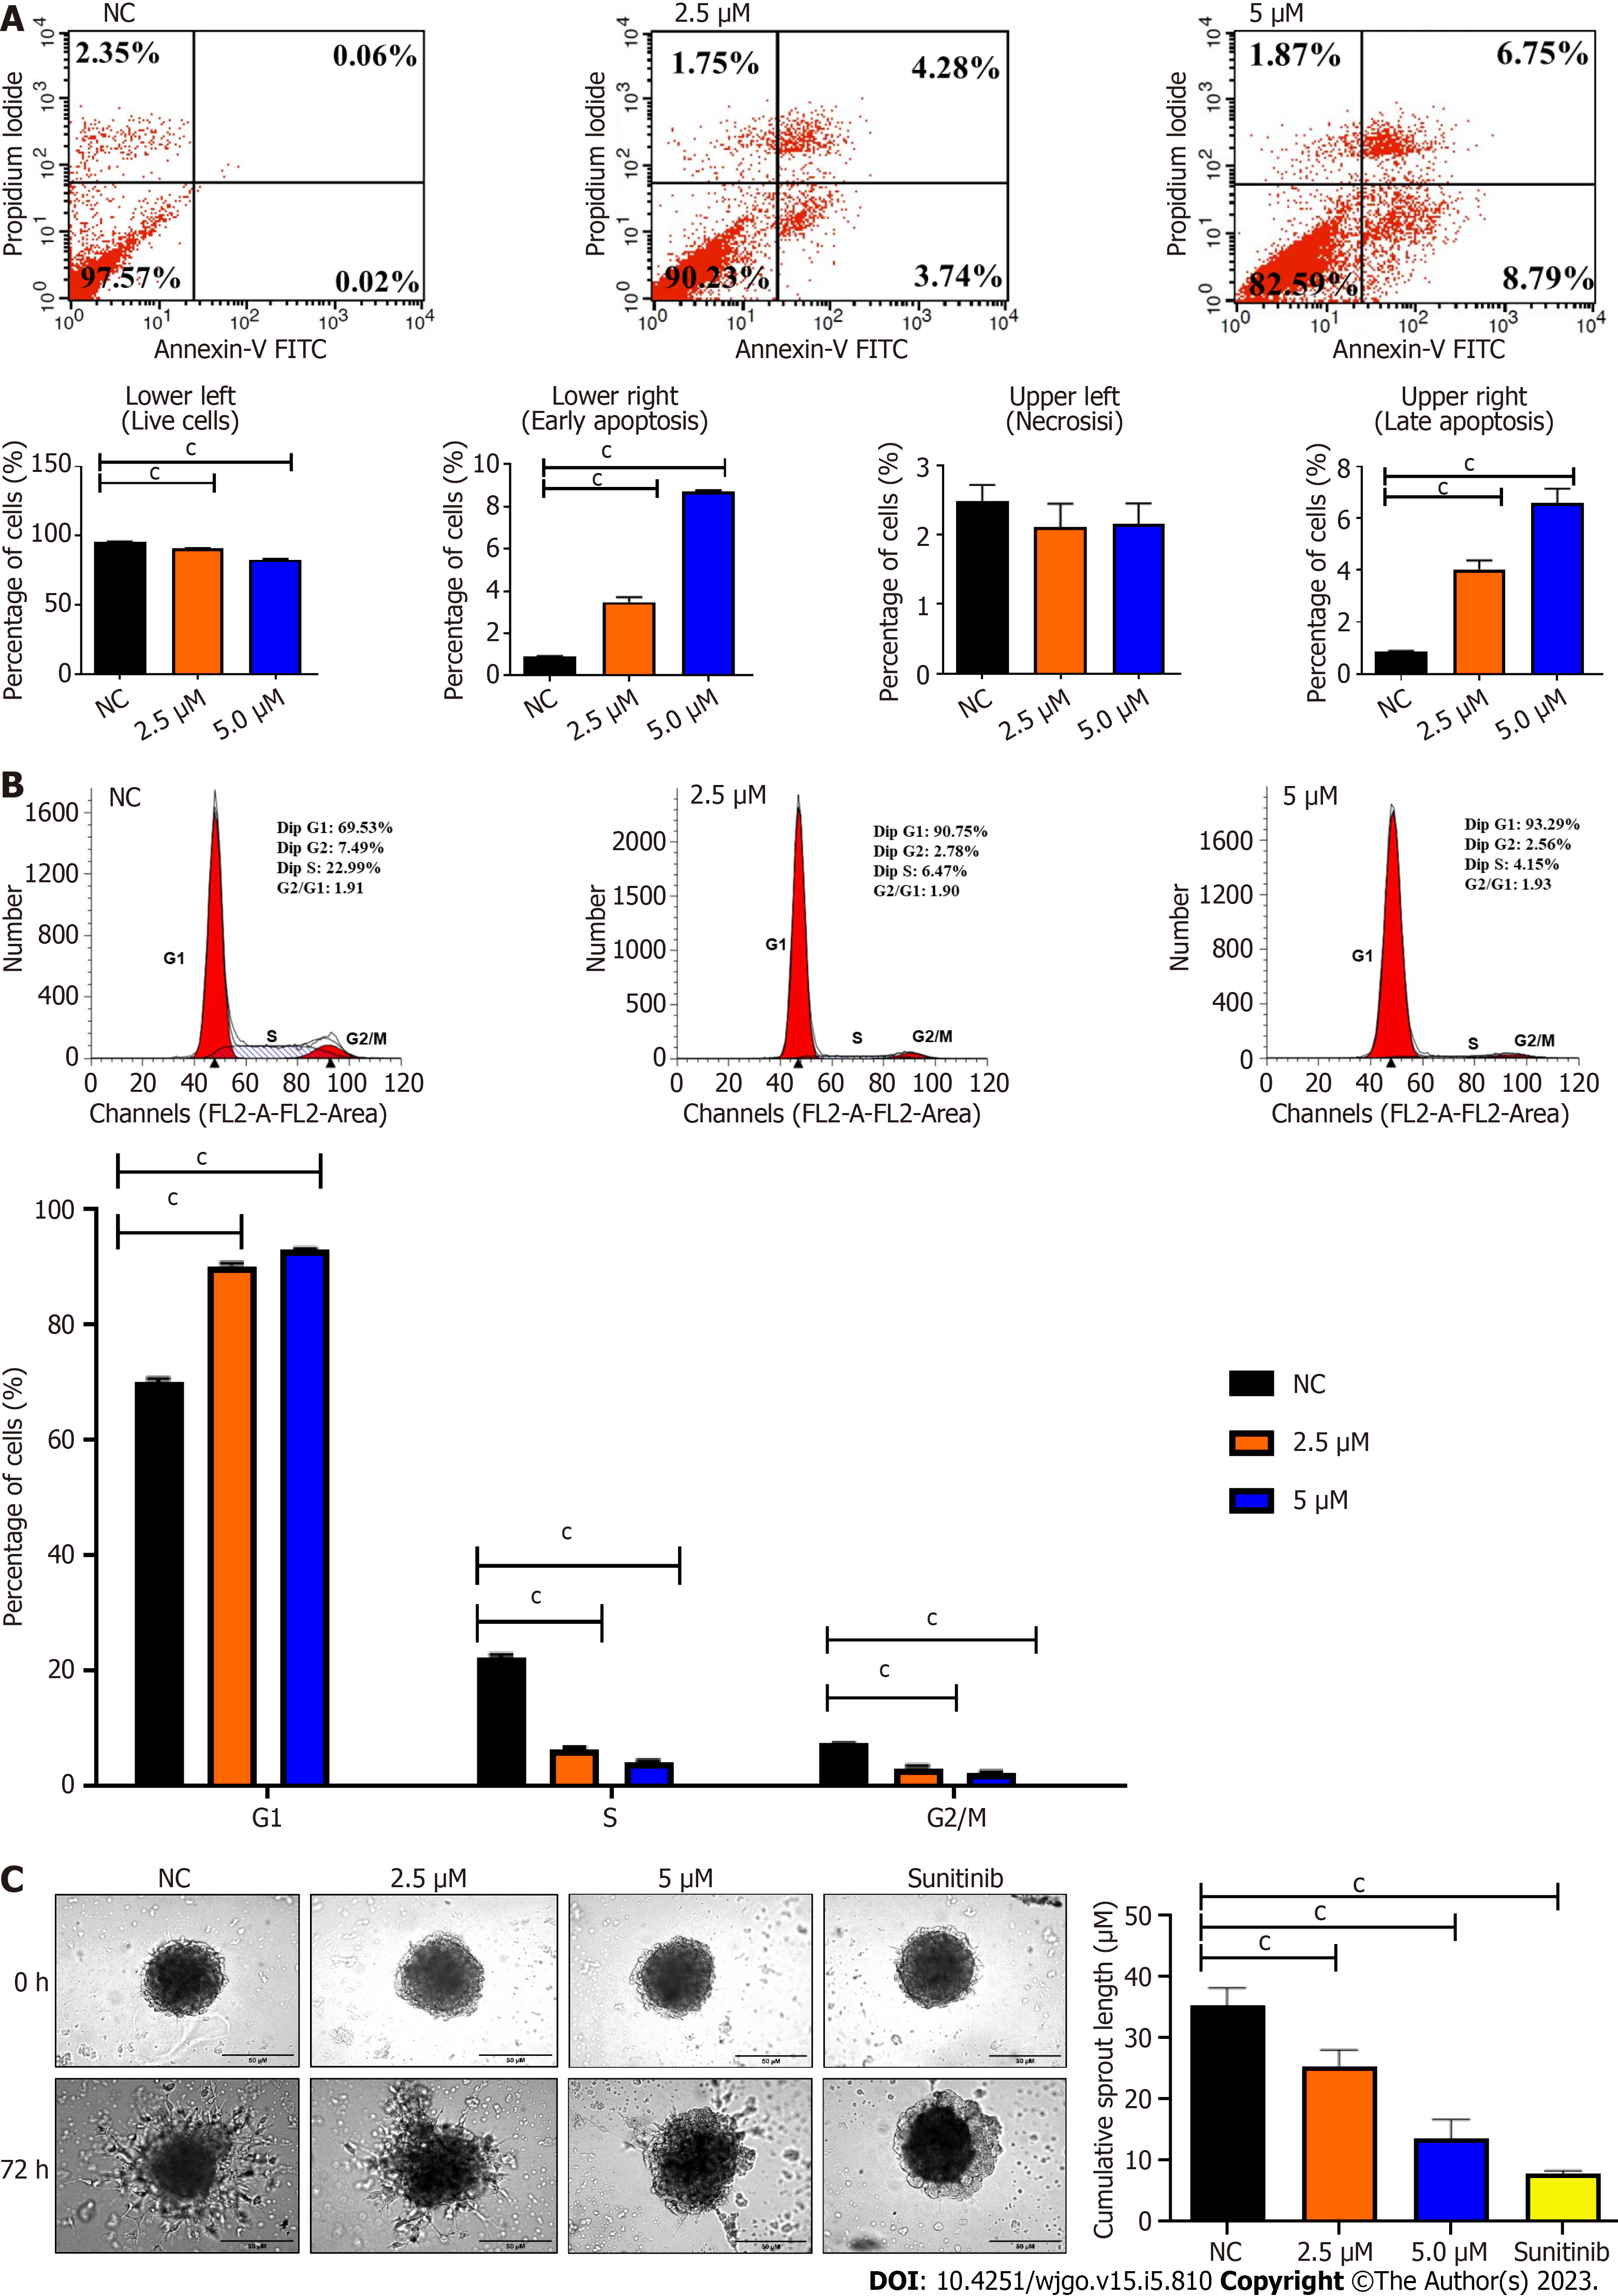
Figure 3 Representative cytograms and endothelial cells sprouting spheroids depict the negative impact of BZD9L1 on endothelial cell functions.
A: BZD9L1 at 2.5 μM and 5.0 μM induced apoptosis; B: Cell cycle arrest at G1 phase; C: But reduced Ea.Hy 926 spheroid sprouting compared to the negative control at 72 h. Sunitinib anti-angiogenic agent was used as the positive control. Statistical analysis (cP < 0.001), one-way ANOVA with Bonferroni posthoc test, n = 3 independent experiments using GraphPad Prism 9.4.0. Error bars represent SEM. NC: Negative control.
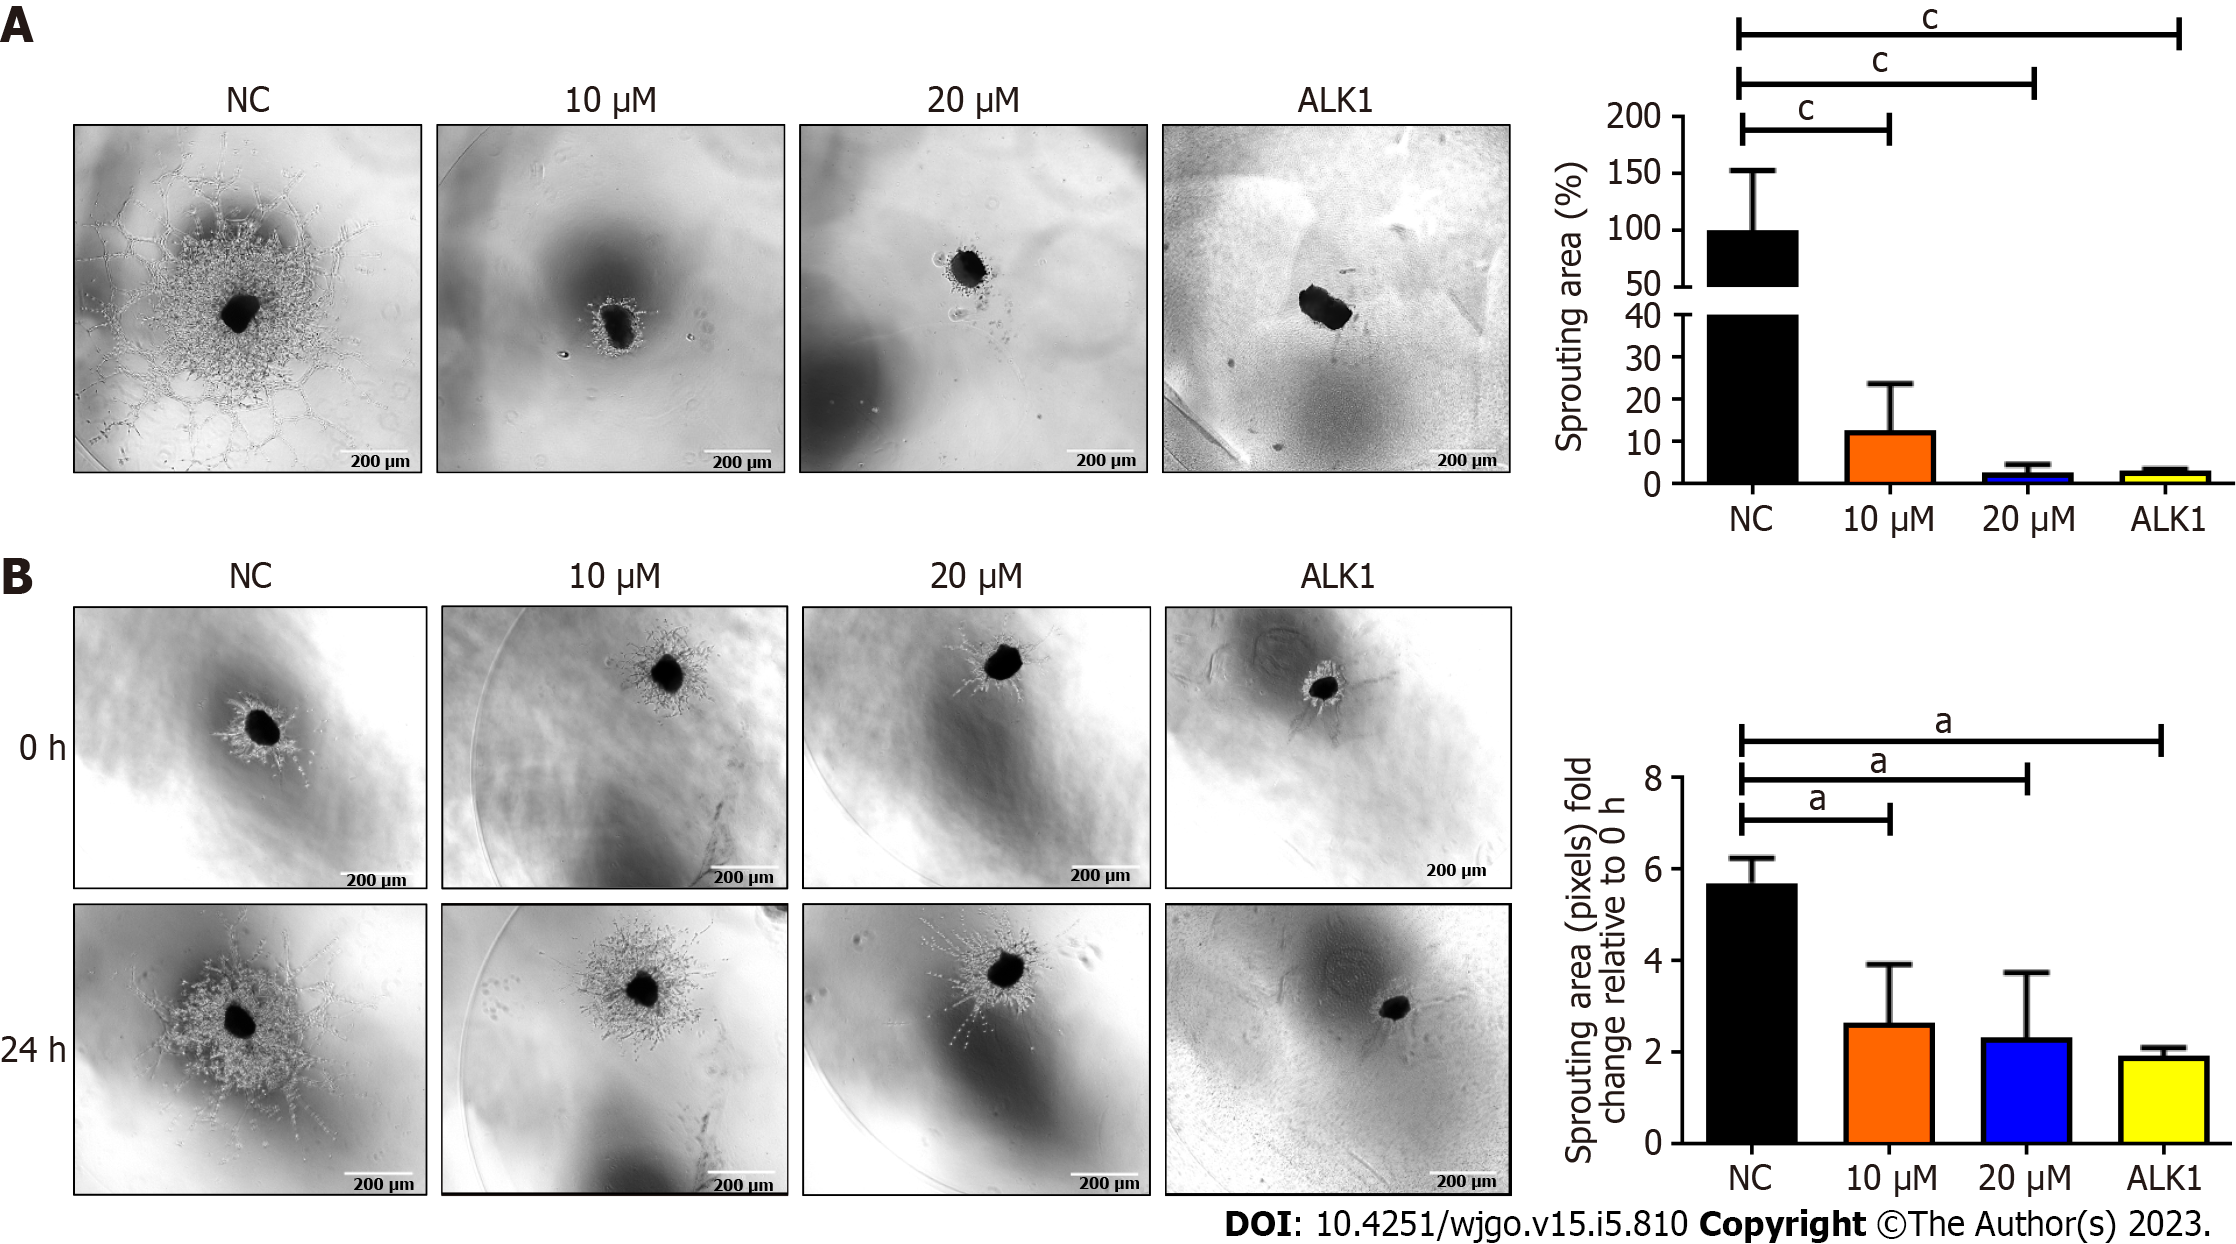
Figure 4 Analyses of mouse choroidal endothelial sprouts in sprouting and regression models.
A: BZD9L1 impeded mouse choroidal endothelial sprouting 96 h post-treatment; B: Regressed choroid sprouting 24 h post-treatment compared to the negative control. A receptor like type 1 anti-angiogenic agent was used as the positive control regression and sprouting assays. Statistical analysis (aP < 0.05; cP < 0.001), one-way ANOVA with Bonferroni posthoc test, n = 2 independent experiments using GraphPad Prism 9.4.0. Error bars represent SEM. ALK1: A receptor like type 1; NC: Negative control.
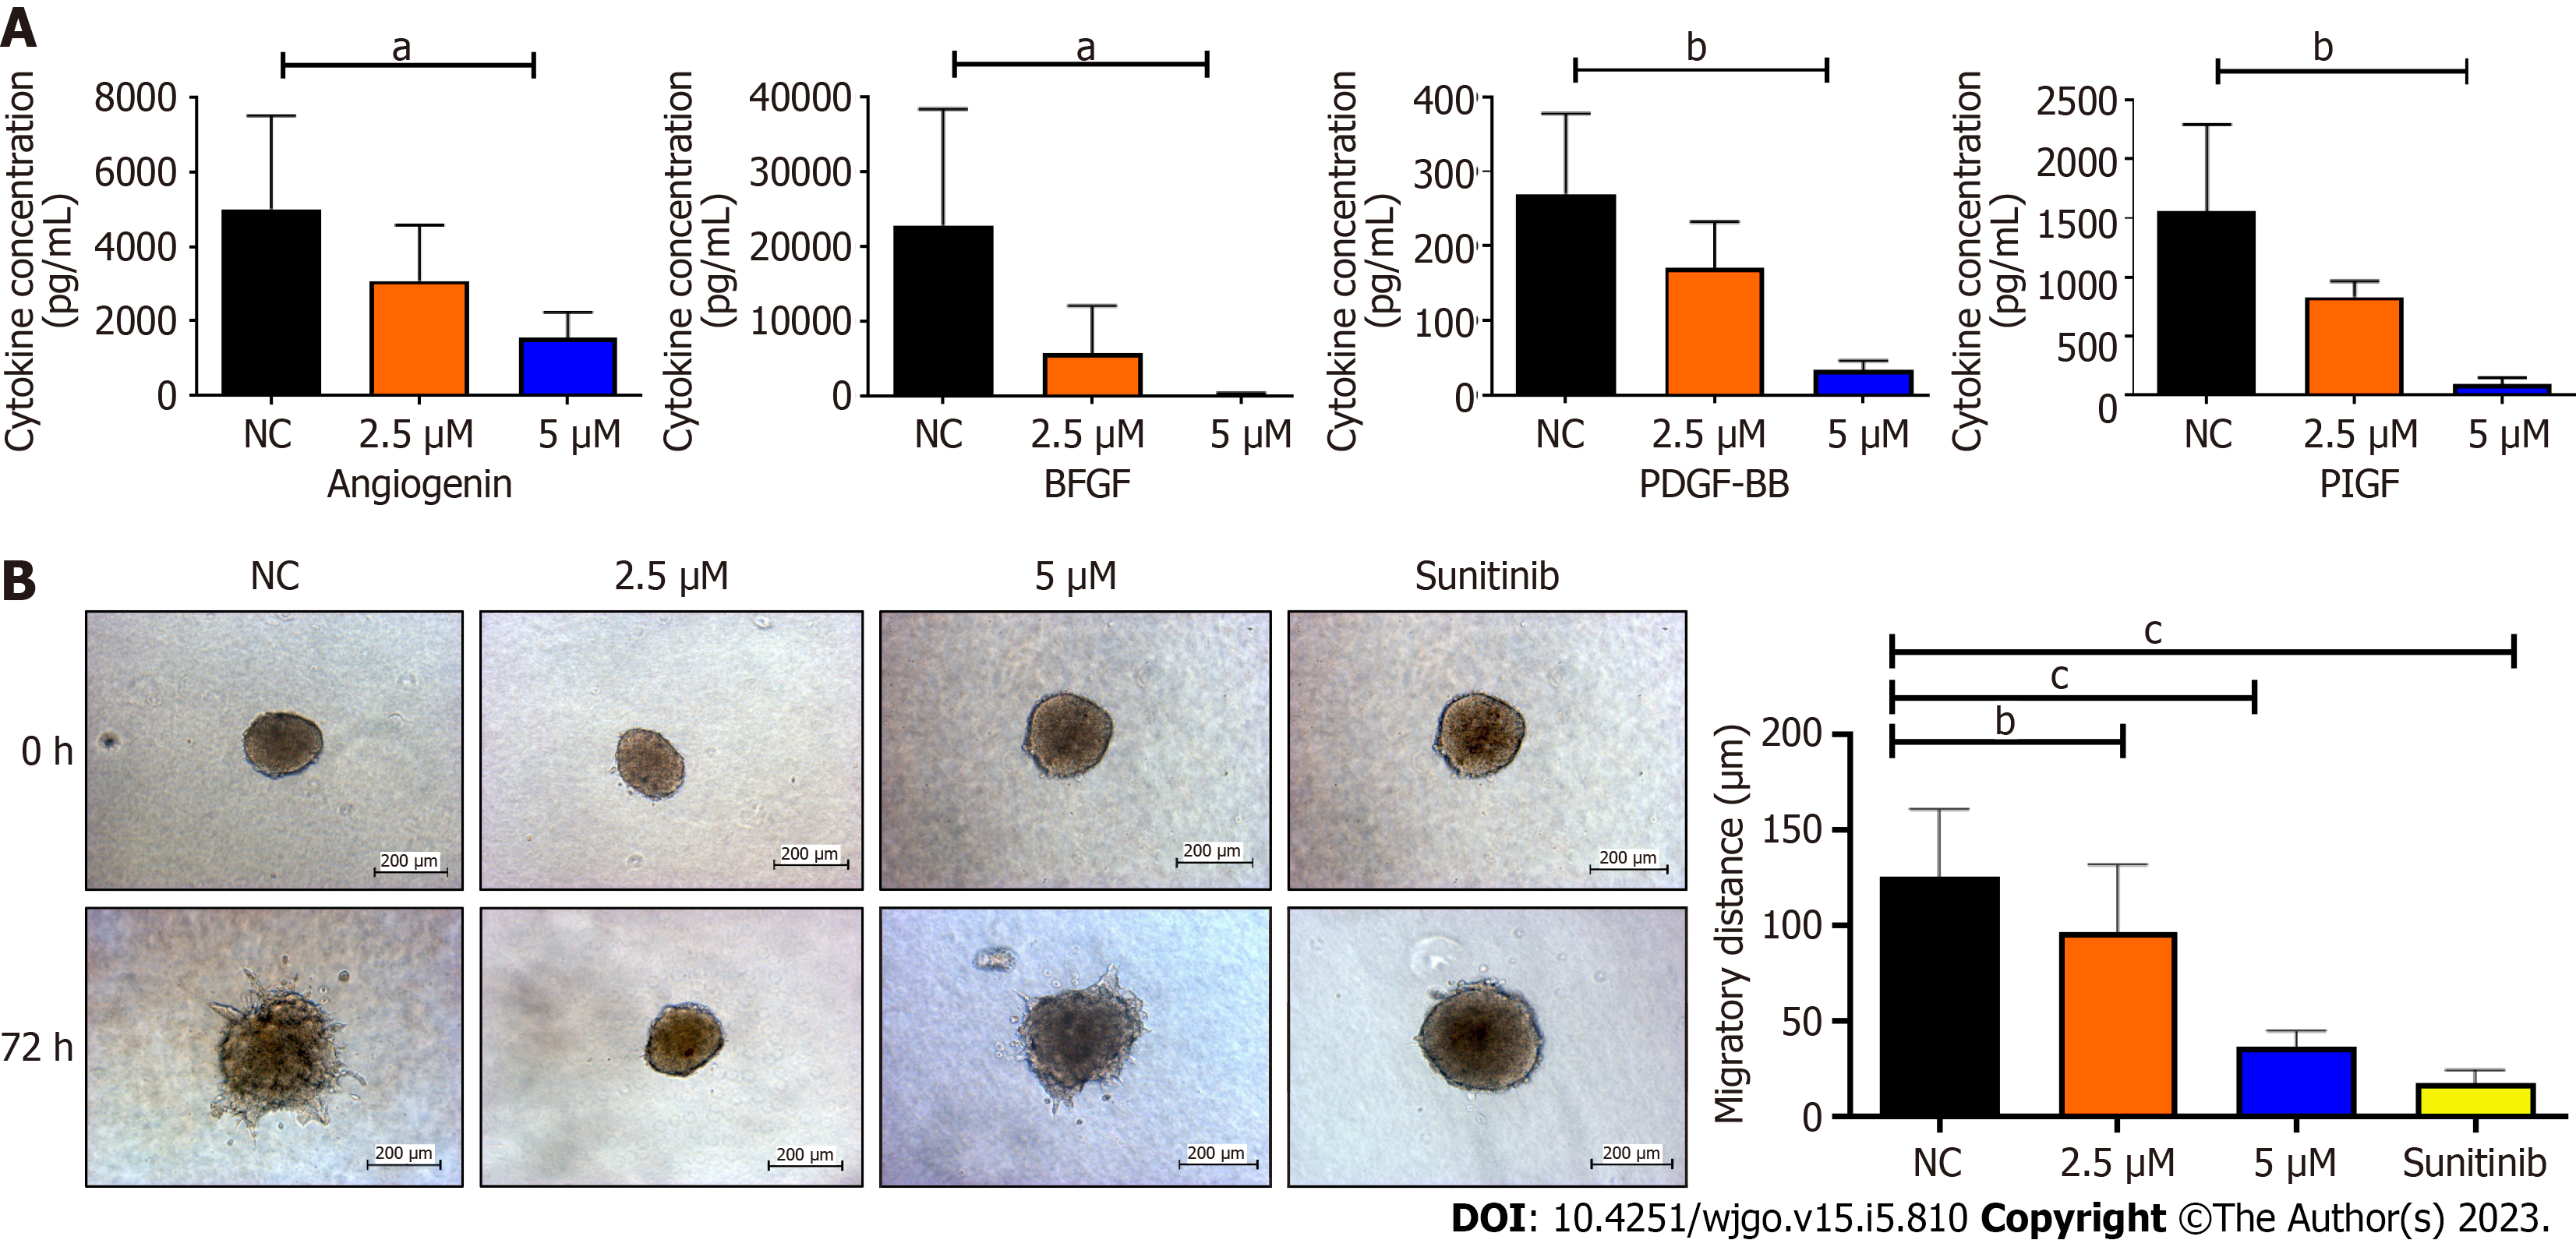
Figure 5 Refreshed conditioned media from Ea.
Hy 926 endothelial cells 48 h post-treatment with Sunitinib positive control, BZD9L1 at 2.5 μM, 5.0 μM, or negative control for 48 h prior, were subjected to Quantibody Human Angiogenesis array and indirect co-culture with HCT116 colorectal cancer spheroids. A: BZD9L1 at 5 μM down-regulated angiogenin, fibroblast growth factor, platelet-derived growth factor and placental growth factor cytokine concentrations in Ea.Hy 926 conditioned media; B: The endothelial conditioned media from BZD9L1 or sunitinib positive control-treated groups impeded HCT116 tumor invasion at 72 h. Statistical analysis (aP < 0.05; bP < 0.01; cP < 0.001), one-way ANOVA with Bonferroni posthoc test, n = 2 independent experiments for protein array analysis and n = 3 independent replicates for co-culture analysis using GraphPad Prism 9.4.0. Error bars represent SEM. NC: Negative control. bFGF: Fibroblast growth factor; PDGF-BB: Platelet-derived growth factor; PIGF: Placental growth factor; NC: Negative control.
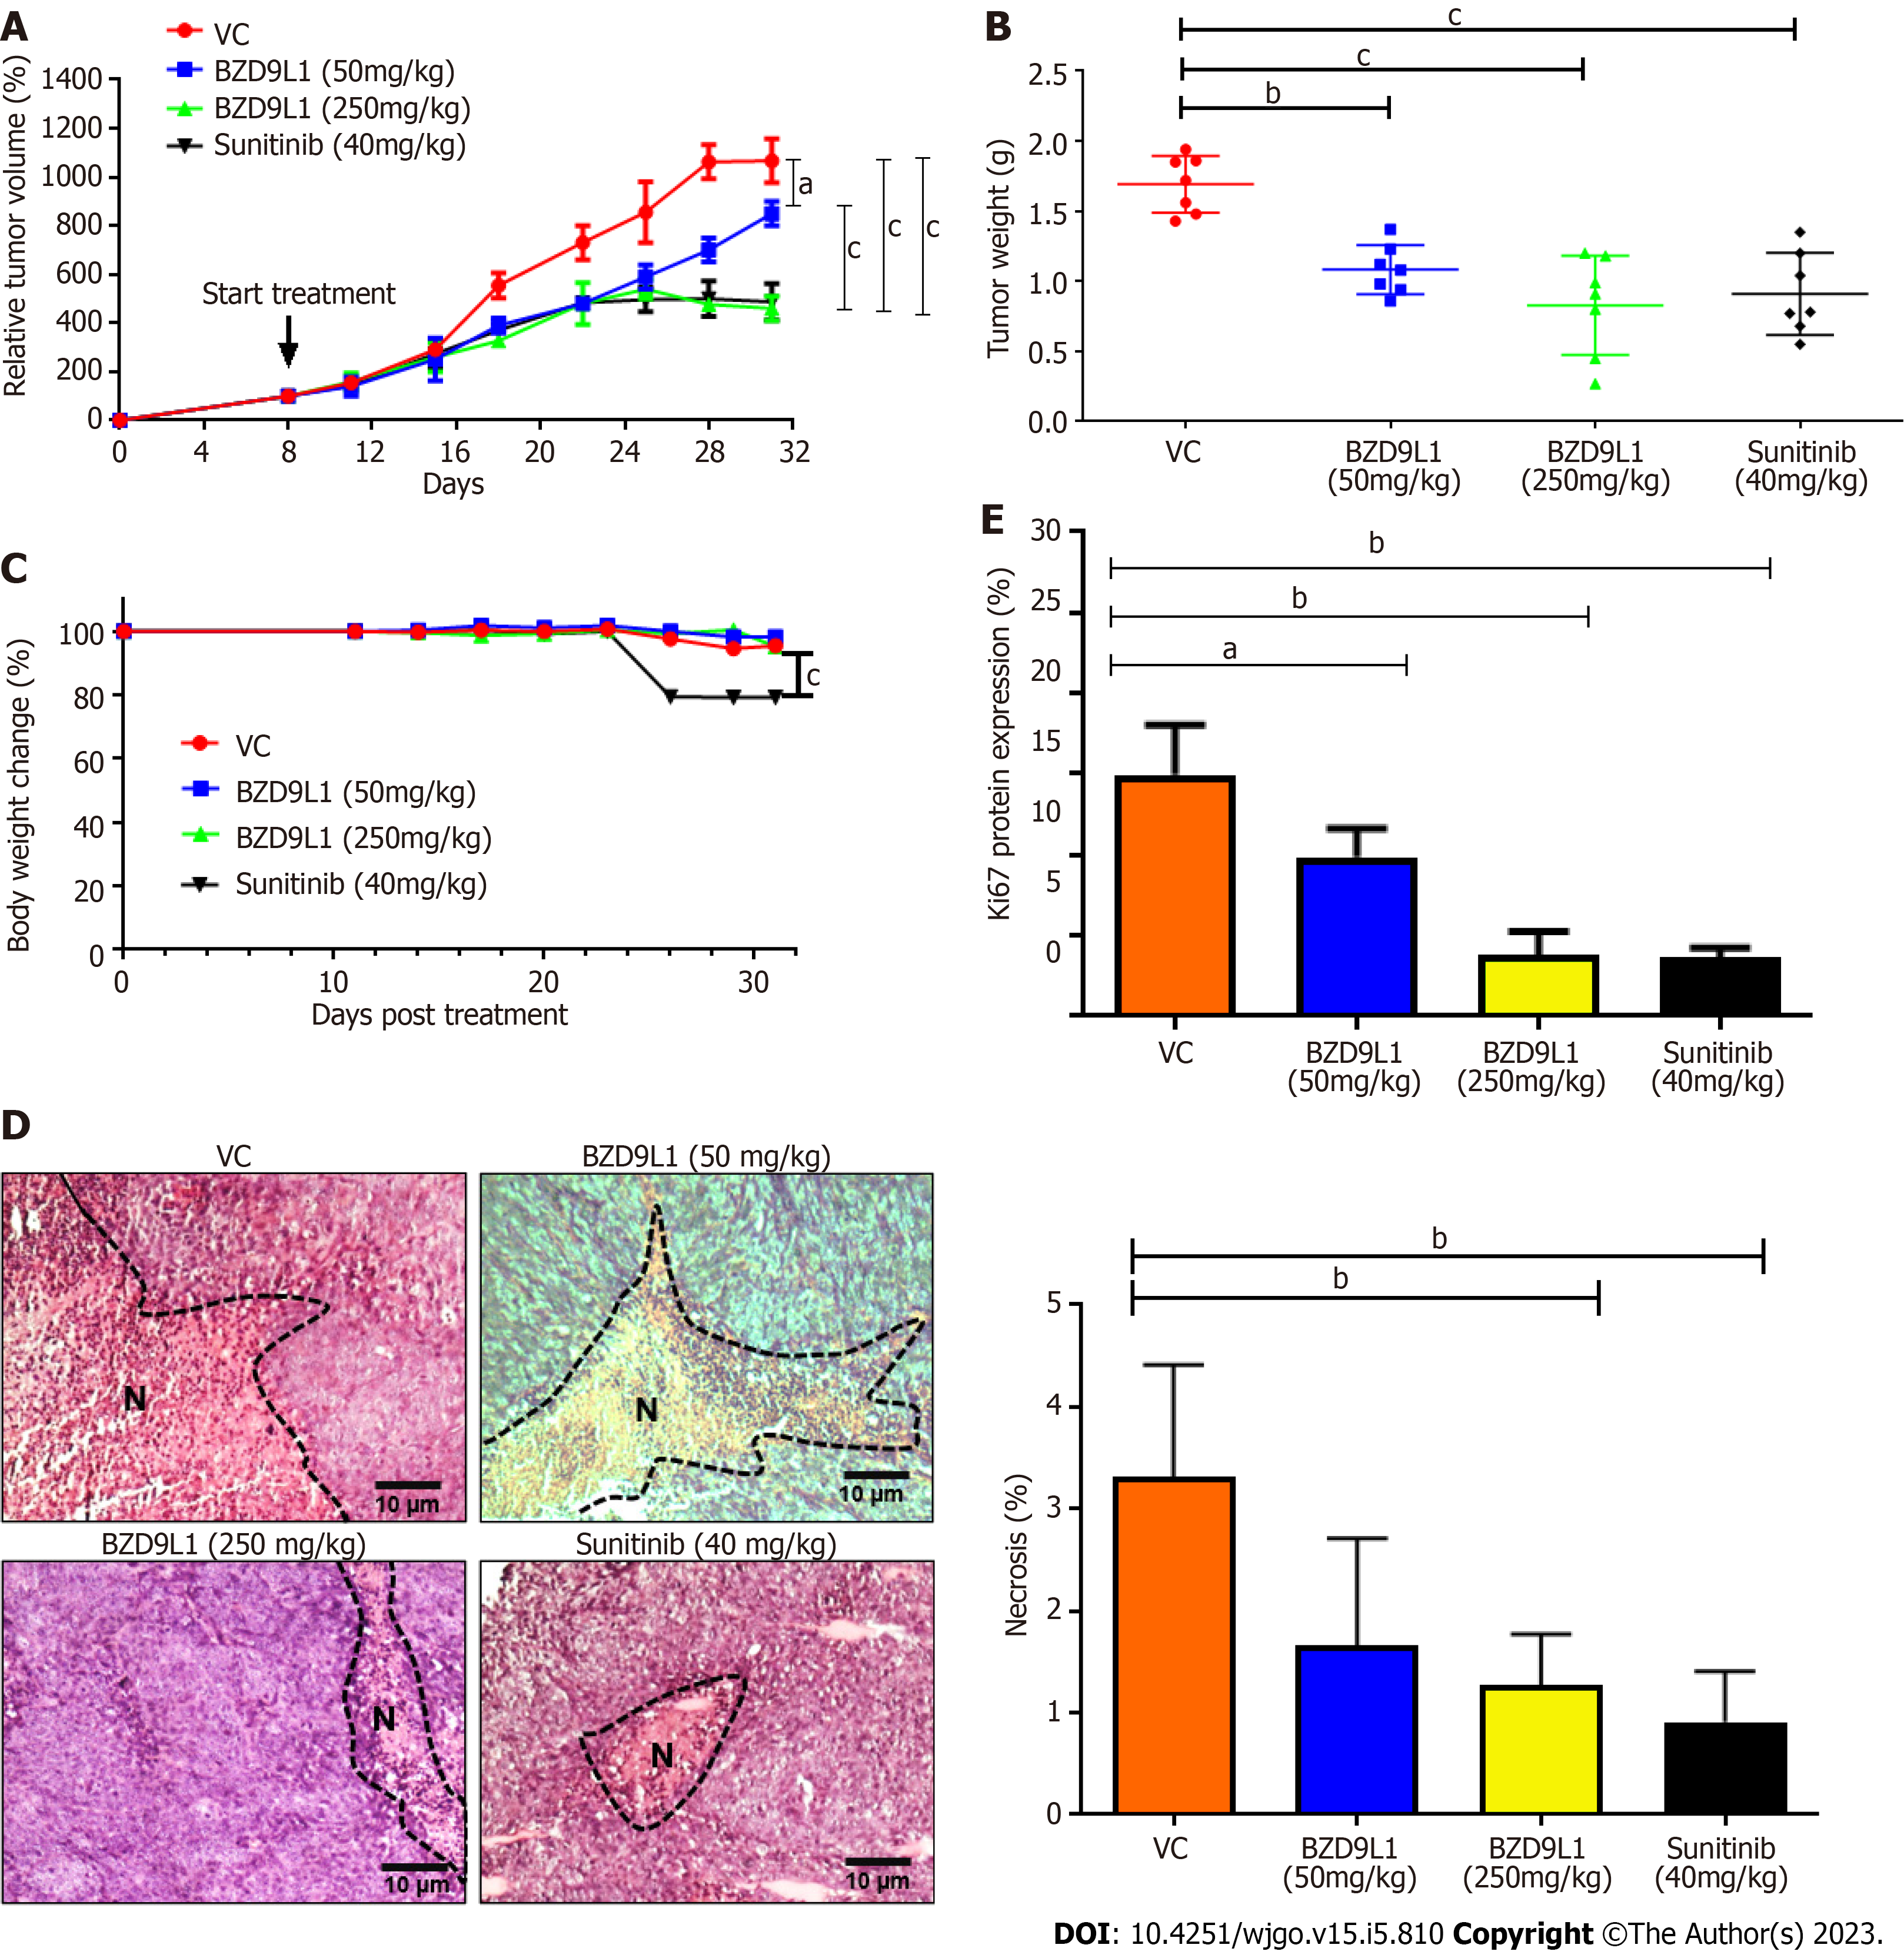
Figure 6 Tumor growth analyses of HCT116 tumor xenograft in nude mice.
Treatments were administered when the tumors reached 100 mm3. A: Relative tumor volume; B: Tumor weight and; C: Percentage body weight change in mice treated with vehicle control (0.5% carboxymethylcellulose), BZD9L1 (50 mg/kg per 3 d, BZD9L1 (250 mg/kg per 3 d) and sunitinib (40 mg/kg per 3 d) as the positive control; D: Tumor necrosis percentage in sections stained with haematoxylin and eosin. N indicates necrotic tissues; E: Ki67 proliferation protein expression in treated and vehicle control groups. Statistical analysis (aP < 0.05; bP < 0.01; cP < 0.001). The non-linear fit was used to track the tumor size and body weight change over time, one-way ANOVA with Bonferroni posthoc test for tumor weight, n = 6 animals per group) using GraphPad Prism 9.4.0. Error bars represent SEM. VC: Vehicle control.
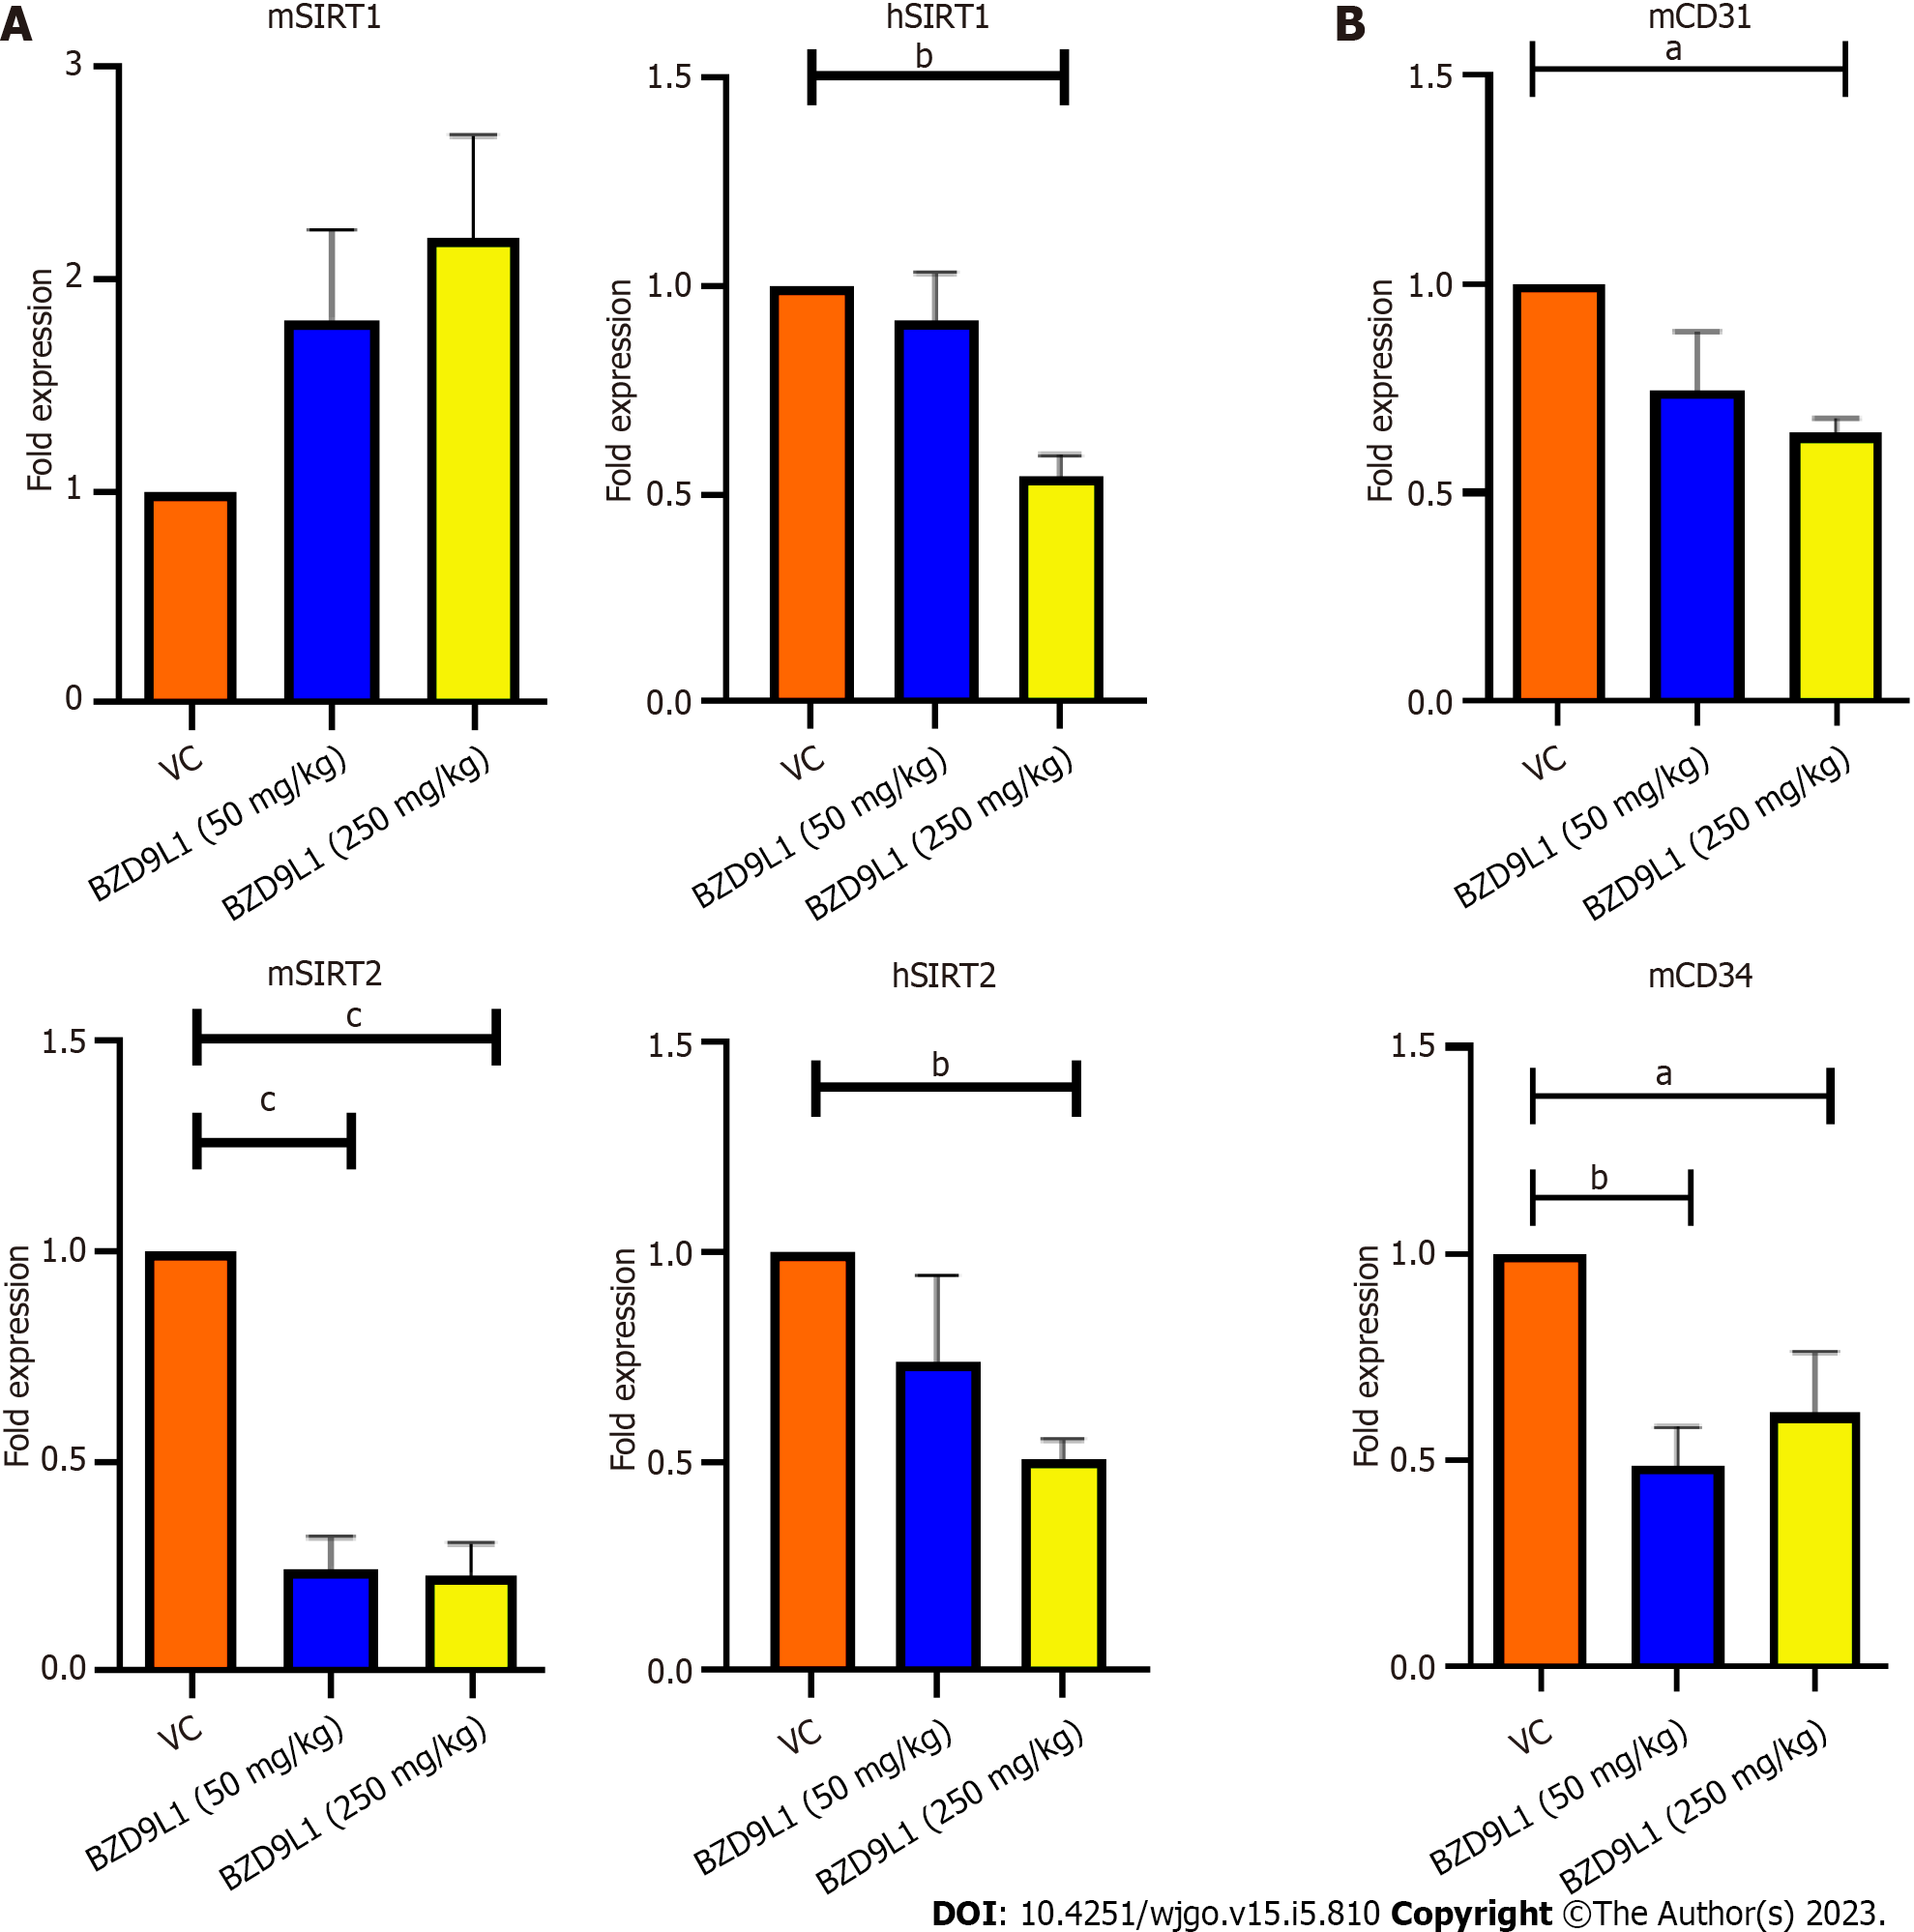
Figure 7 Quantitative polymerase chain reaction analyses of murine SIRT1, mSIRT2 and endothelial cell markers in HCT116 tumor xenograft in nude mice.
A: BZD9L1 did not significantly affect murine SIRT1 (mSIRT1) gene expression in the colorectal cancer xenograft tumors but down-regulated mSIRT2 at low (50 mg/kg) and high (250 mg/kg) doses and reduced human SIRT1 (hSIRT1) and hSIRT2 gene expression at 250 mg/kg, compared to vehicle control; B: BZD9L1 at the high dose significantly reduced cluster of differentiation 31 (CD31) gene expression. Both low and high doses of BZD9L1 decreased mCD34 gene expression compared to vehicle control. Statistical analysis aP < 0.05; bP < 0.01; cP < 0.001), one-way ANOVA with Bonferroni posthoc test, n = 6 animals per group) using GraphPad Prism 9.4.0. Error bars represent SEM. VC: Vehicle control.
- Citation: Oon CE, Subramaniam AV, Ooi LY, Yehya AHS, Lee YT, Kaur G, Sasidharan S, Qiu B, Wang X. BZD9L1 benzimidazole analogue hampers colorectal tumor progression by impeding angiogenesis. World J Gastrointest Oncol 2023; 15(5): 810-827
- URL: https://www.wjgnet.com/1948-5204/full/v15/i5/810.htm
- DOI: https://dx.doi.org/10.4251/wjgo.v15.i5.810


