Copyright
©The Author(s) 2023.
World J Gastrointest Oncol. Apr 15, 2023; 15(4): 644-664
Published online Apr 15, 2023. doi: 10.4251/wjgo.v15.i4.644
Published online Apr 15, 2023. doi: 10.4251/wjgo.v15.i4.644
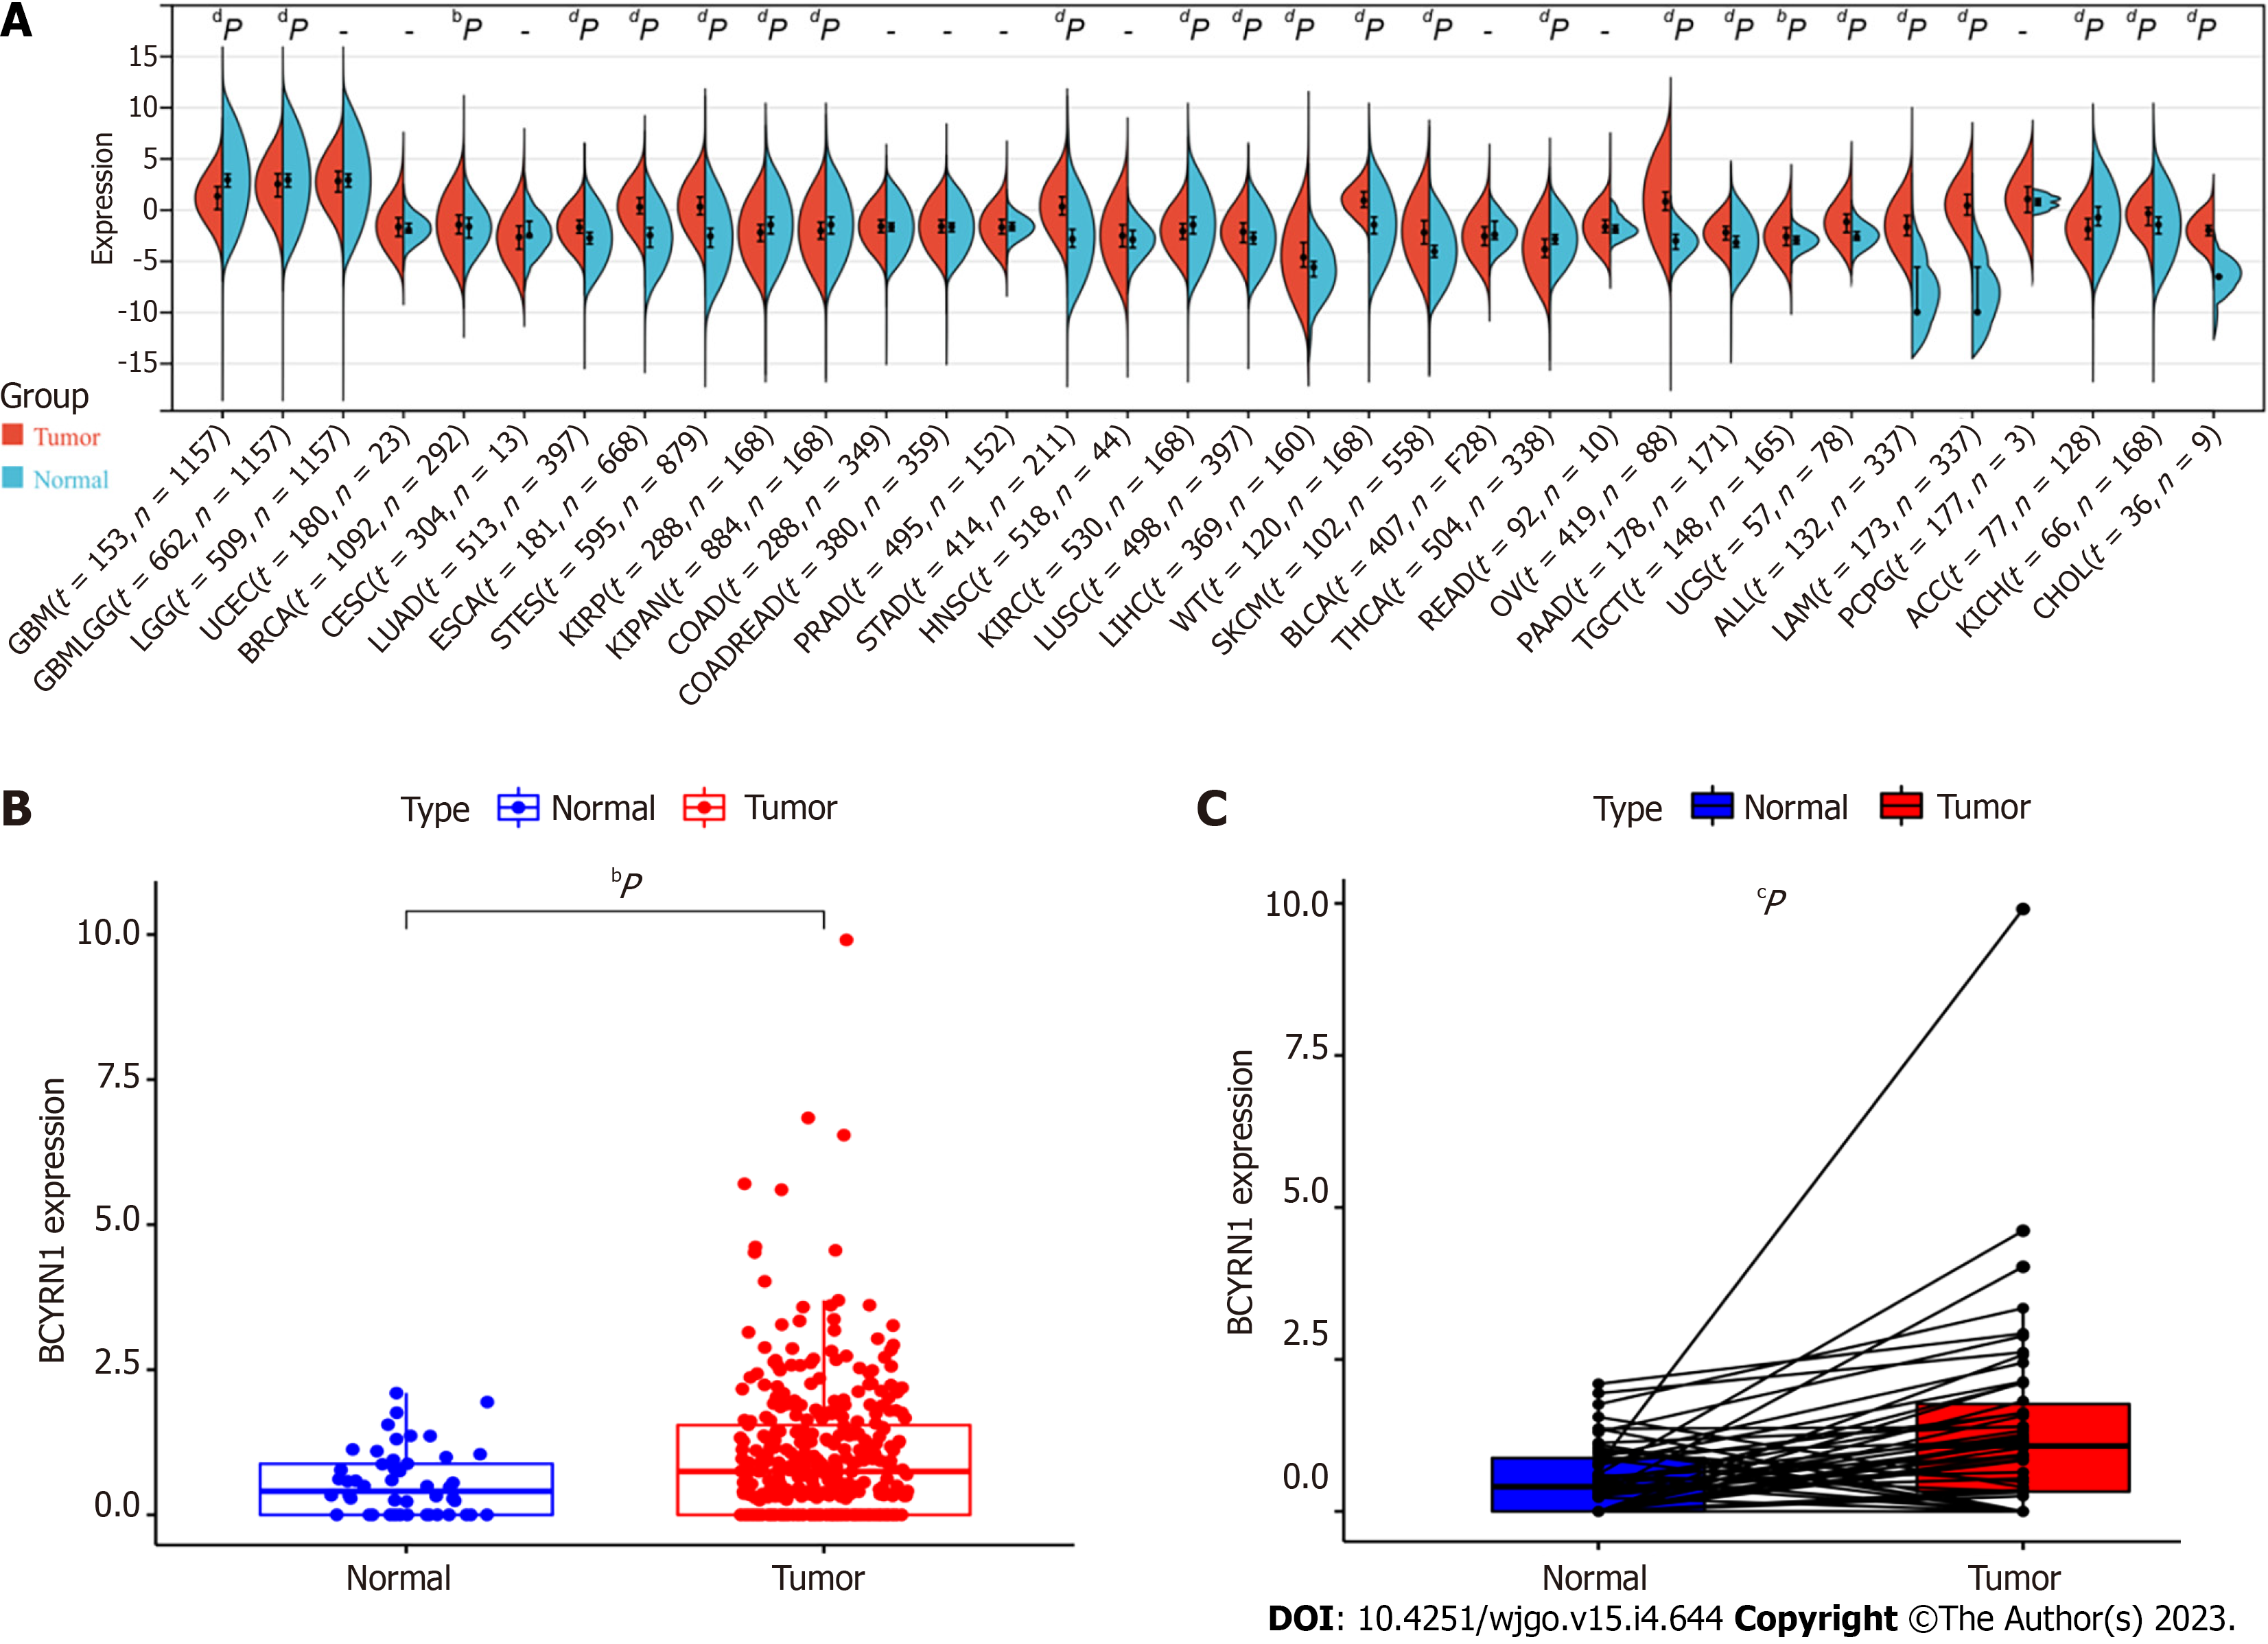
Figure 1 Expression levels of brain cytoplasmic RNA1 in pan-cancer and hepatocellular carcinoma.
A: Expression level of brain cytoplasmic RNA1 (BCYRN1) in pan-carcinoma; B: Differential analysis of expression of BCYRN1 in hepatocellular carcinoma (HCC) tissues compared with normal liver tissues based on the Cancer Genome Atlas database; C: Pairwise difference analysis of BCYRN1 expression between HCC tissues and surrounding normal liver tissues from the same patient. aP < 0.05, bP < 0.01, cP < 0.001, dP < 0.0001.
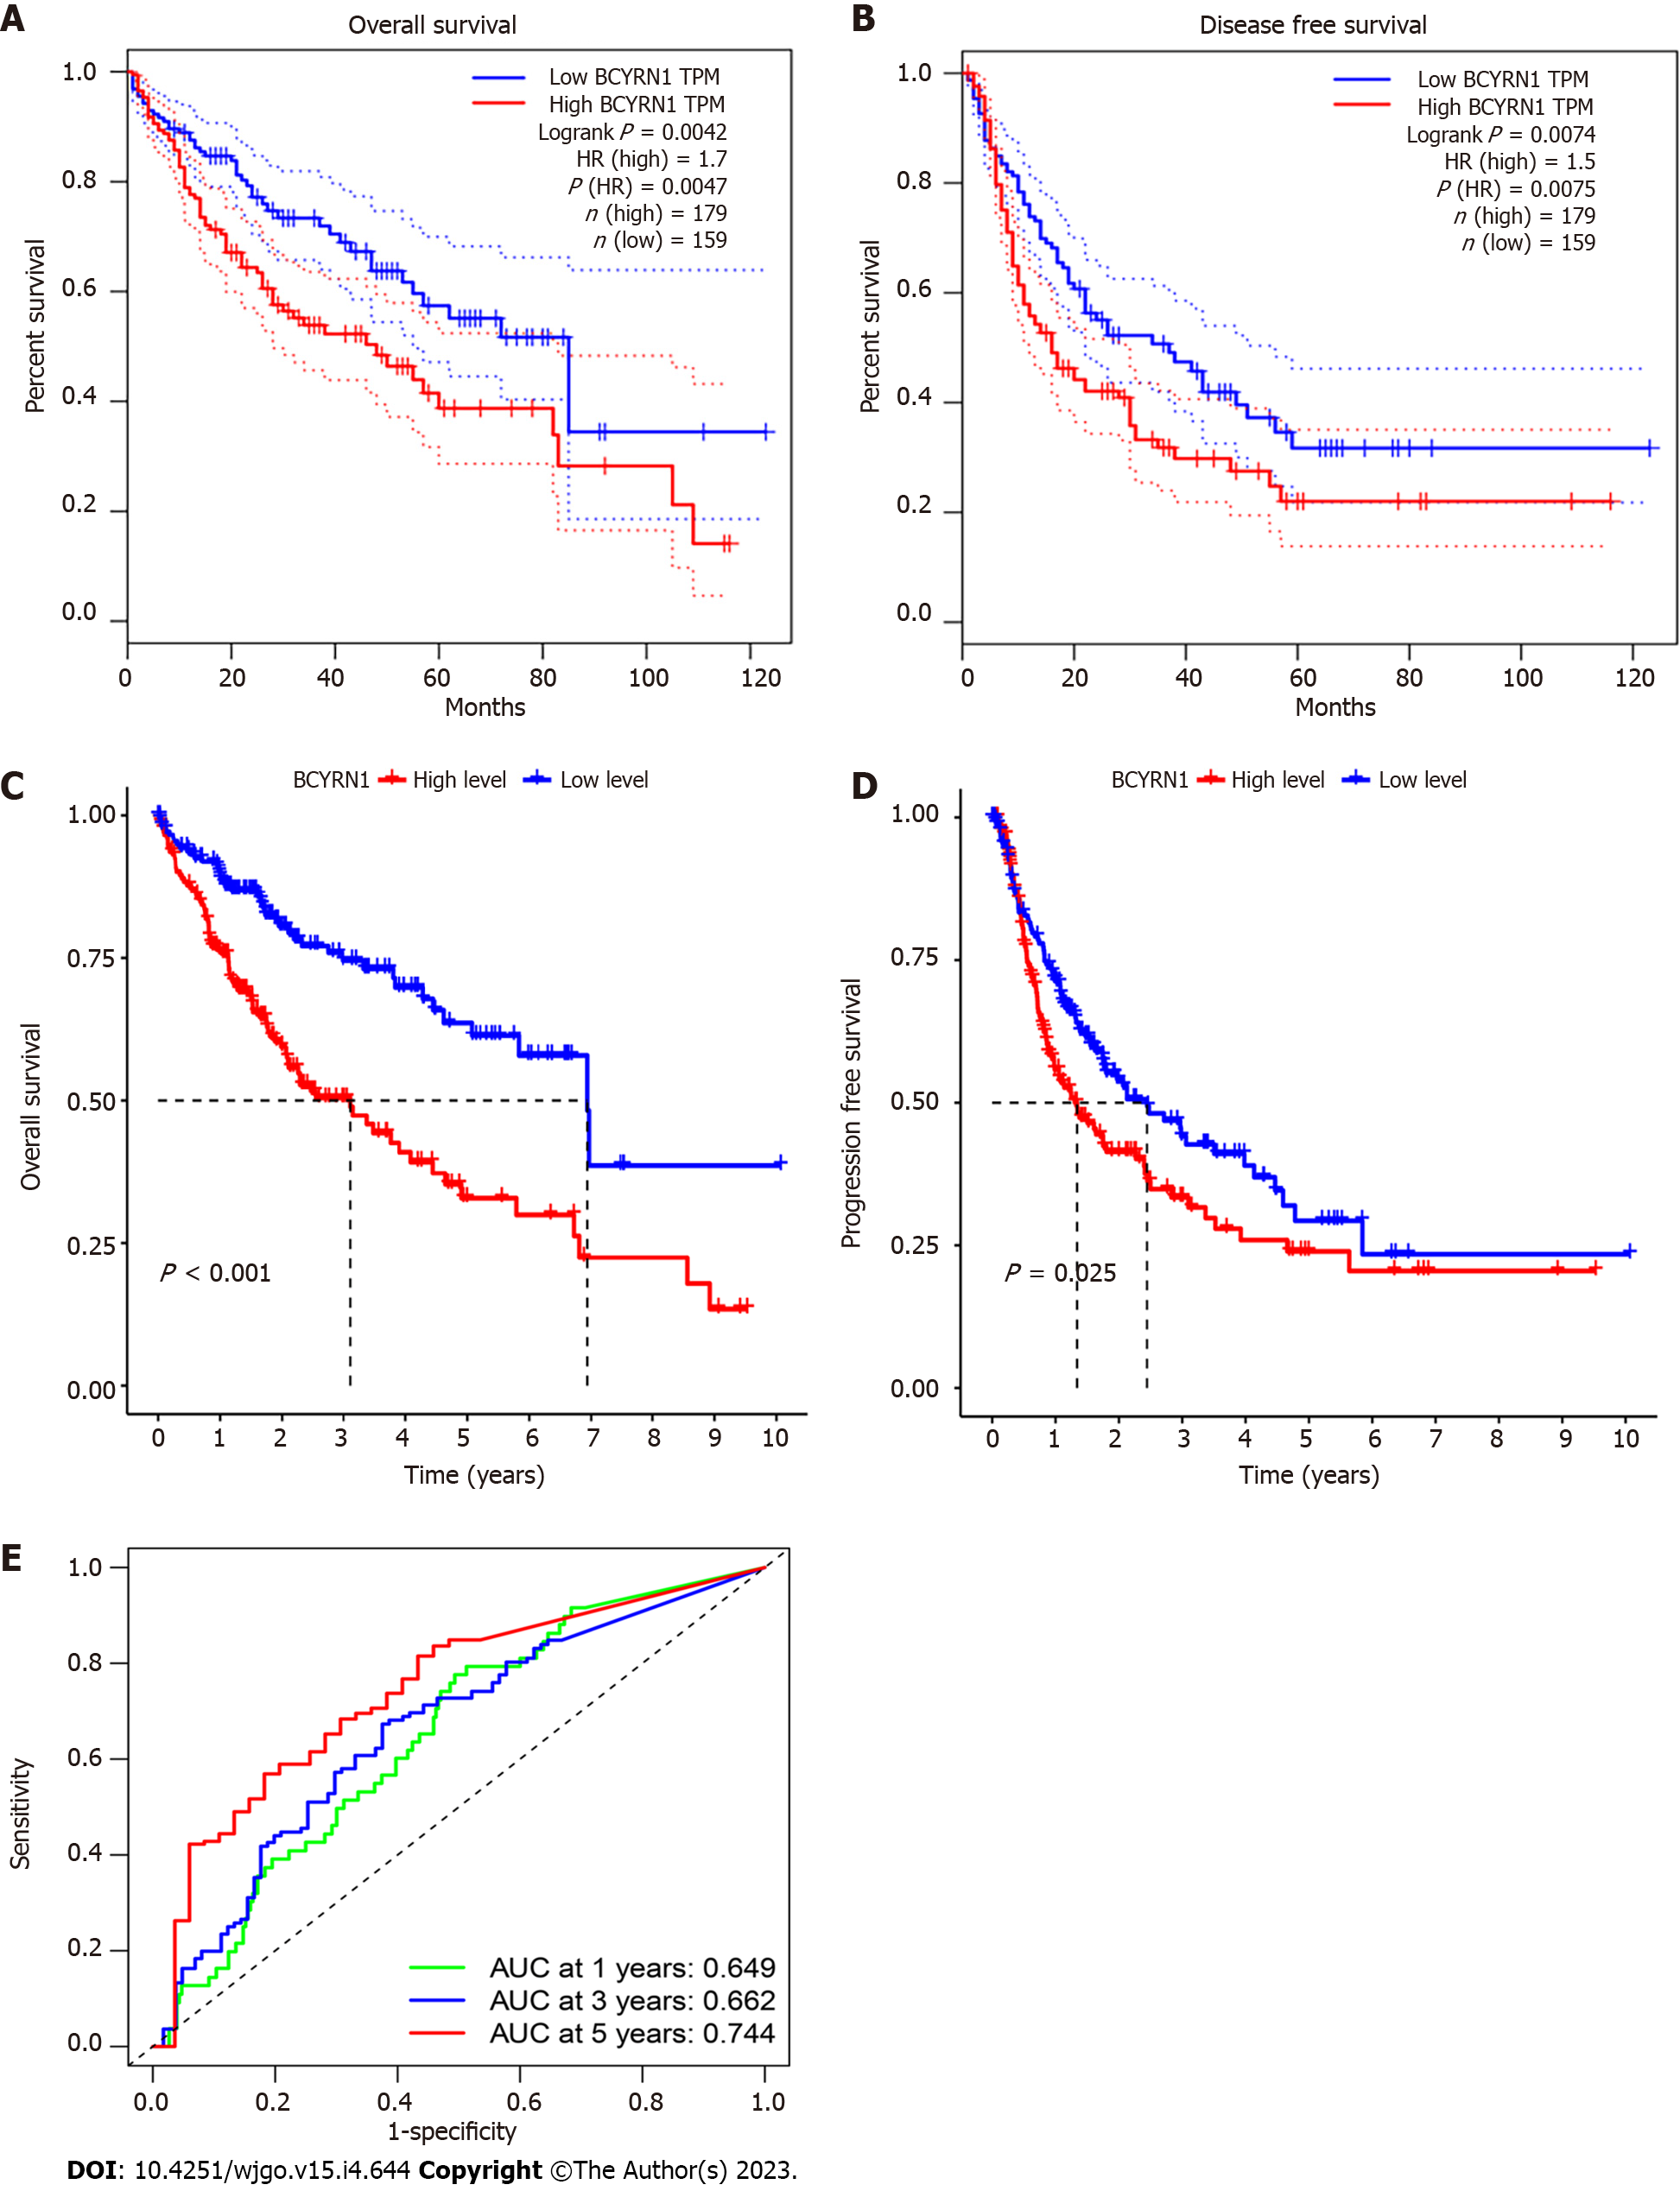
Figure 2 Association of brain cytoplasmic RNA1 expression with prognosis in hepatocellular carcinoma patients.
A and B: Association of brain cytoplasmic RNA1 (BCYRN1) expression with overall survival (A) and disease-free survival (B) in hepatocellular carcinoma (HCC) patients in the GEPIA2 database; C and D: BCYRN1 expression in the Cancer Genome Atlas database in relation to overall survival (C) and progression-free (D) survival in HCC patients; E: Receiver operating characteristic curve to assess the predictive value of BCYRN1 expression with different prognostic years. AUC: Area under the curve; HR: Hazard ratio; TPM: Transcripts per million.
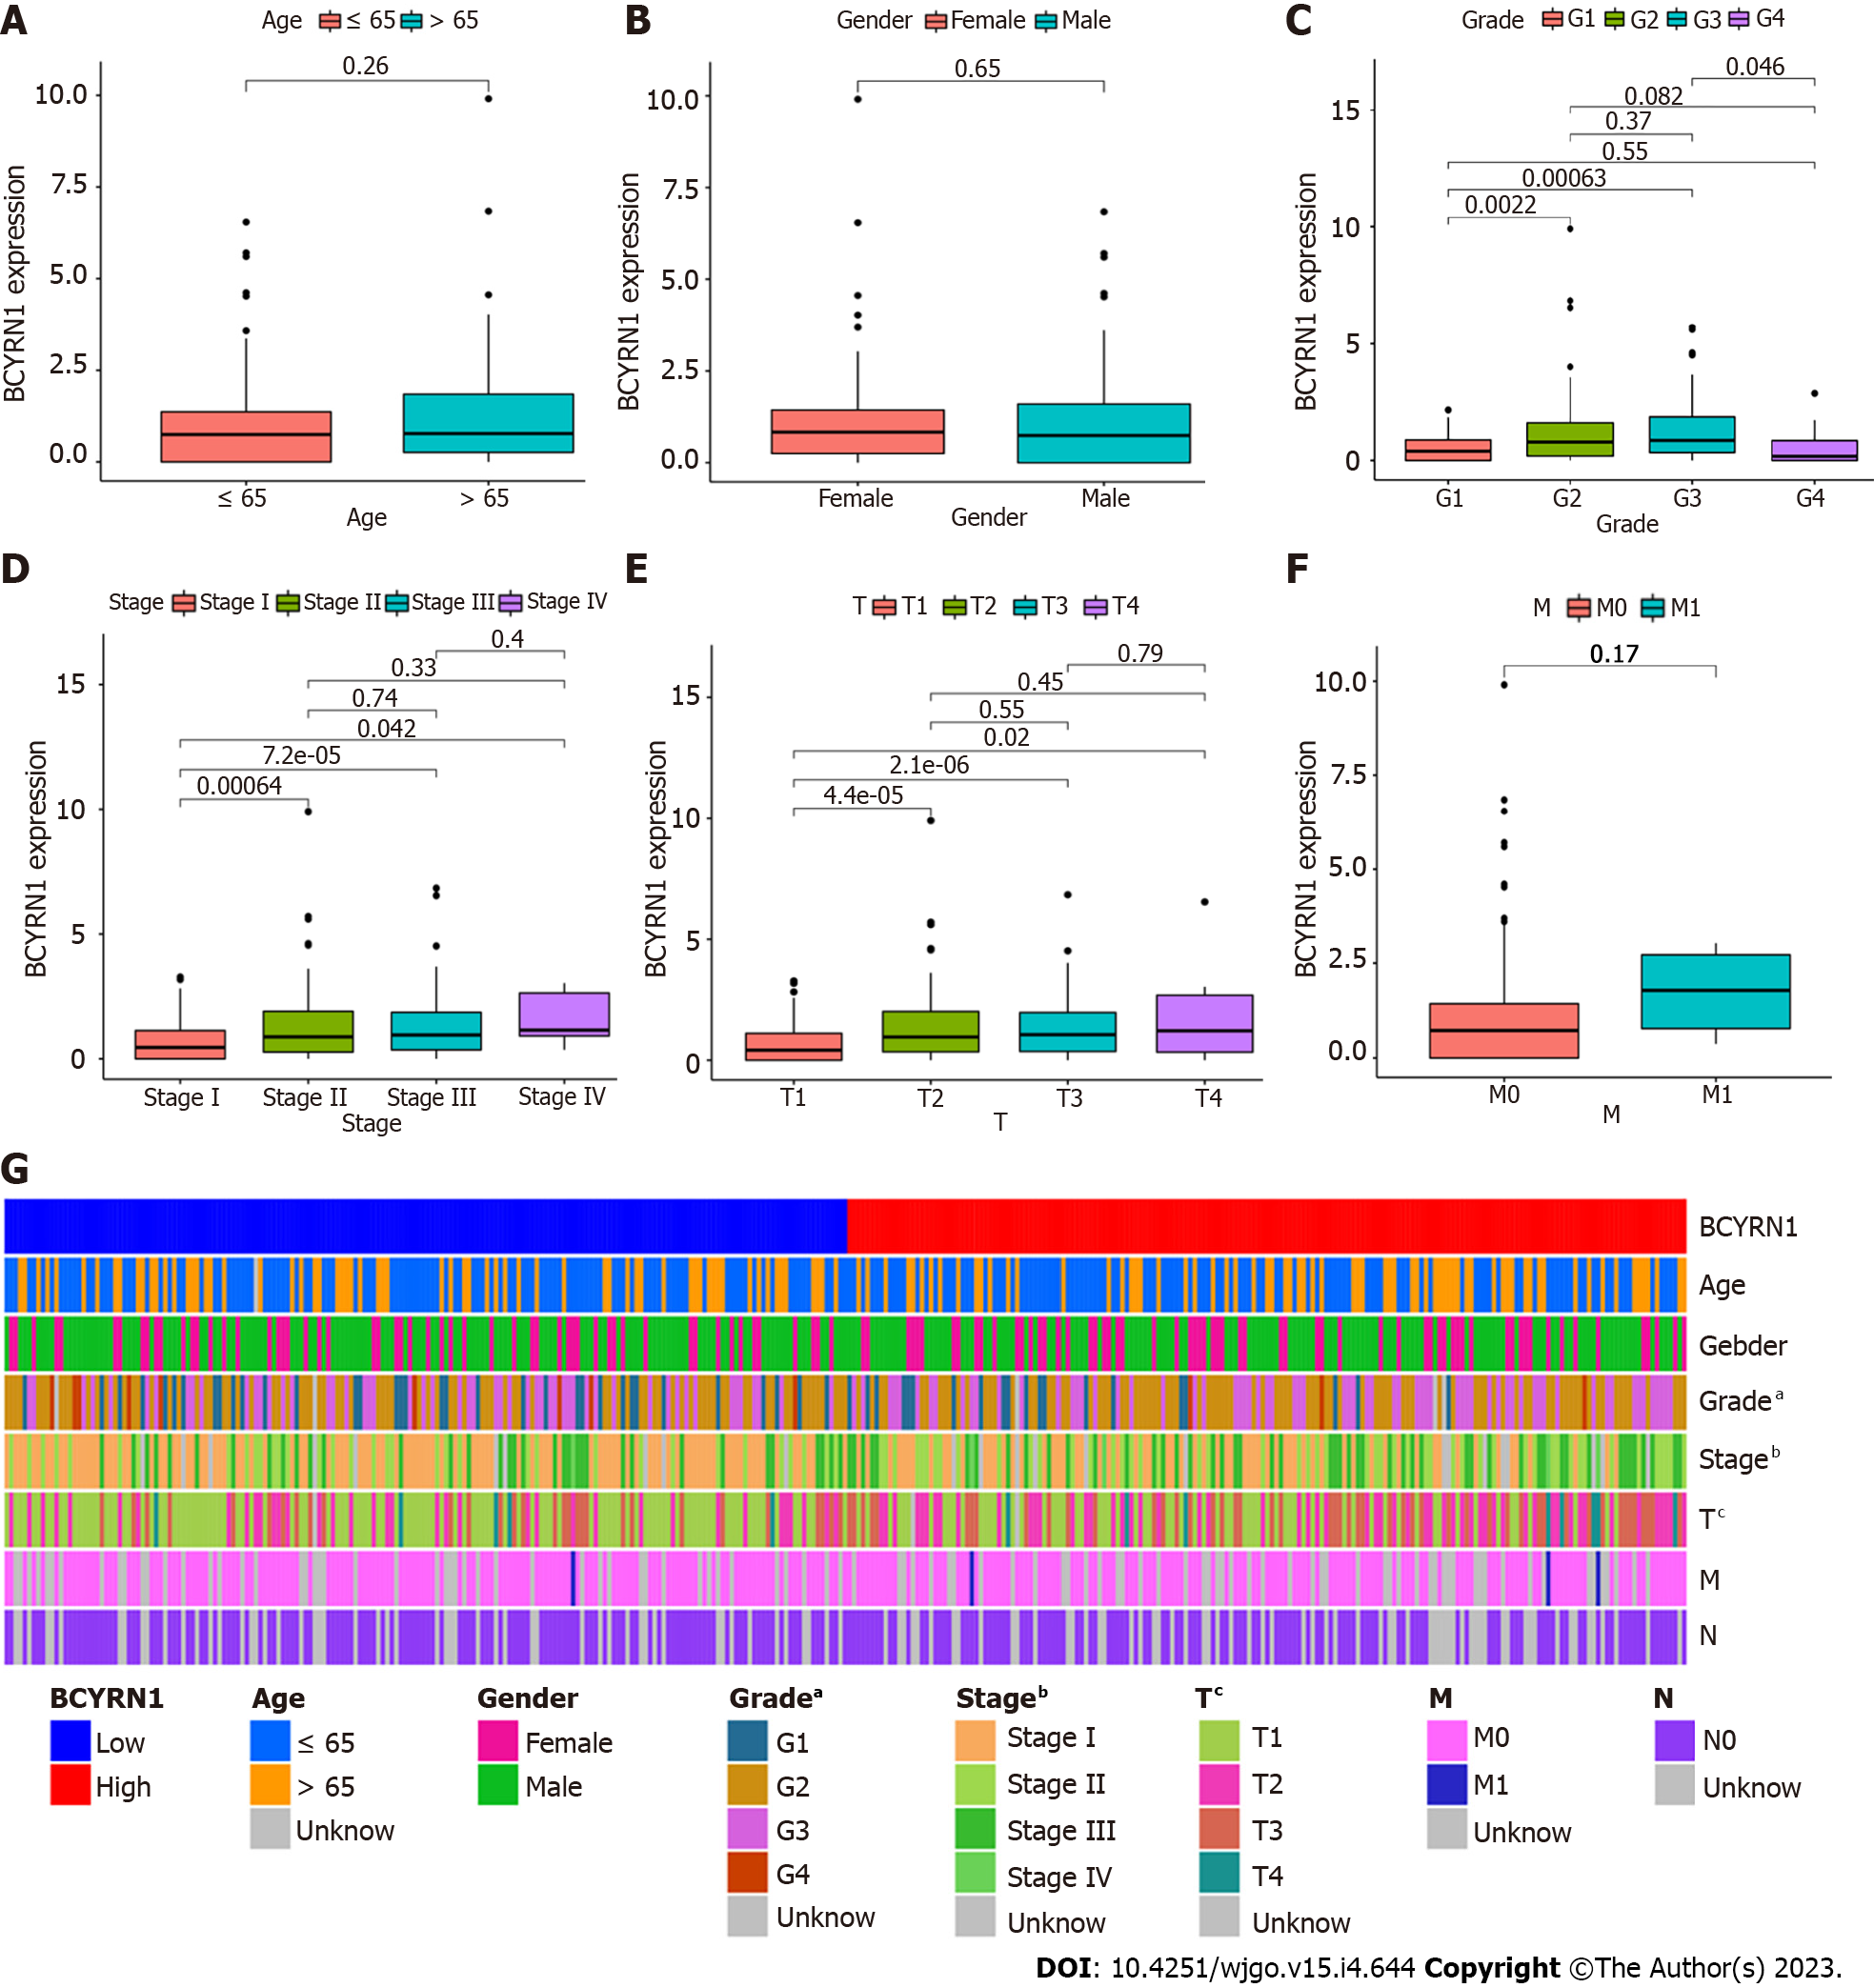
Figure 3 Relationship between expression of brain cytoplasmic RNA1 and clinicopathological characteristics of hepatocellular carcinoma patients.
A: Age; B: Sex (labeled Gender); C: Pathological grade; D: Clinical stage; E: T stage; F: M stage; G: Heat map of the correlation between the expression of brain cytoplasmic RNA1 and clinicopathological features.
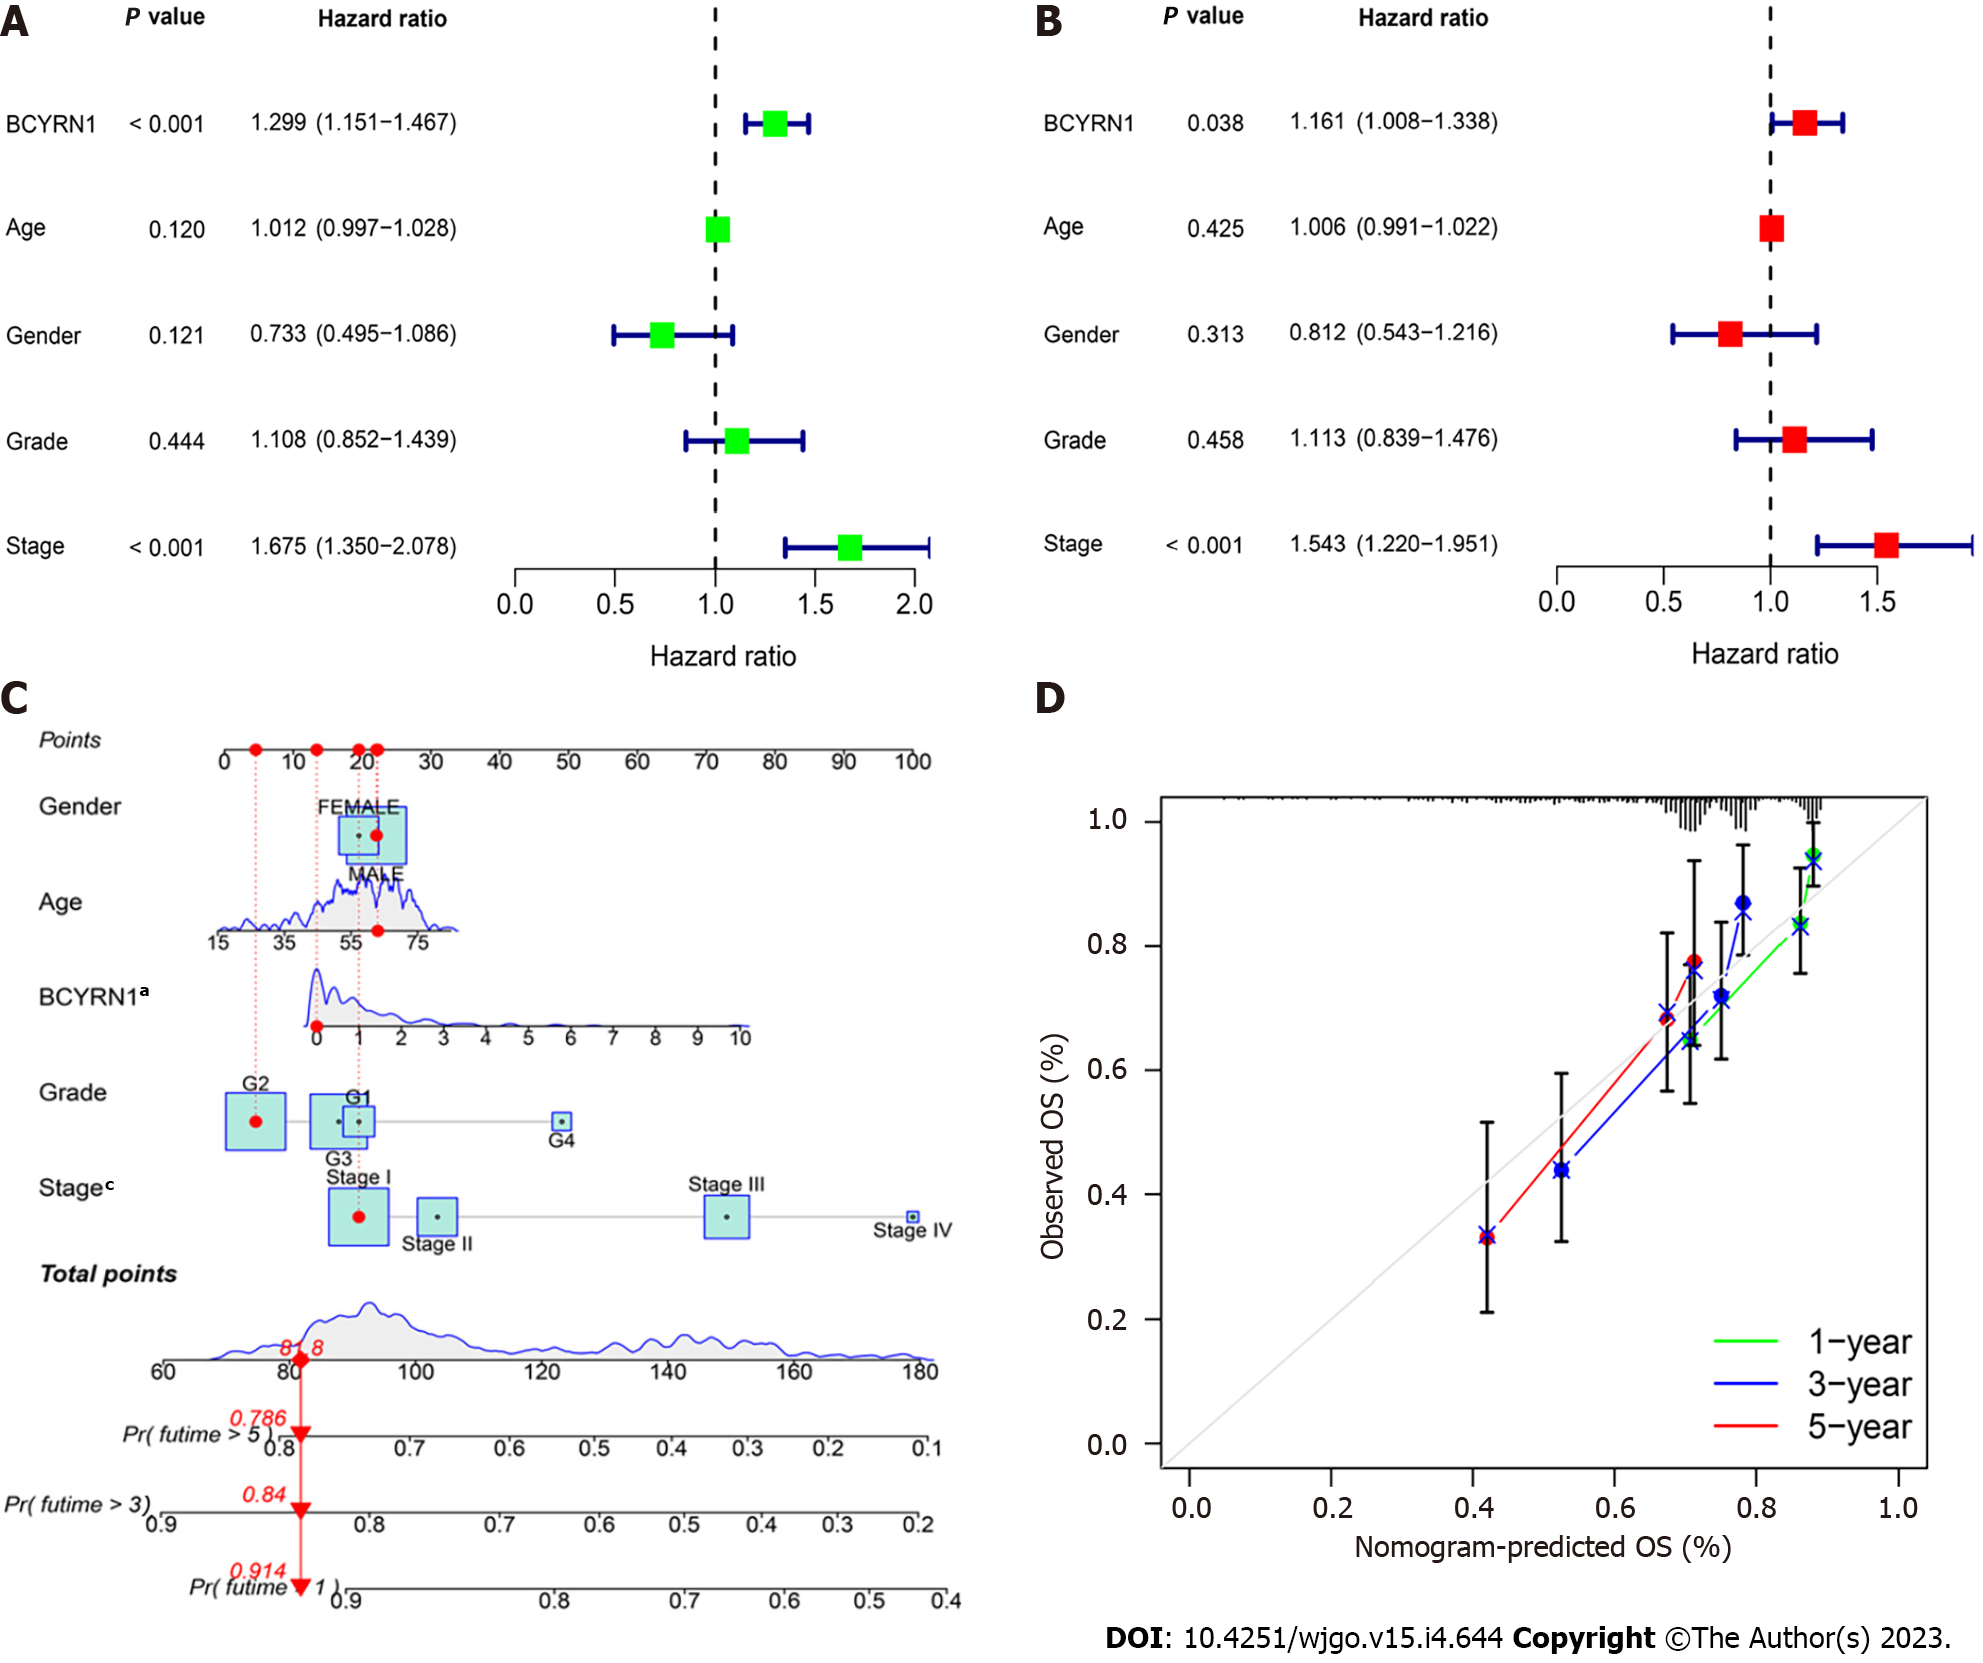
Figure 4 Independent survival prognostic factor analysis and nomogram prediction model.
A: Univariate prognostic analysis; B: Multivariate prognostic analysis; C: Nomogram prediction model; D: Calibration curve of nomogram. BCYRN1: Brain cytoplasmic RNA1; OS: Overall survival.
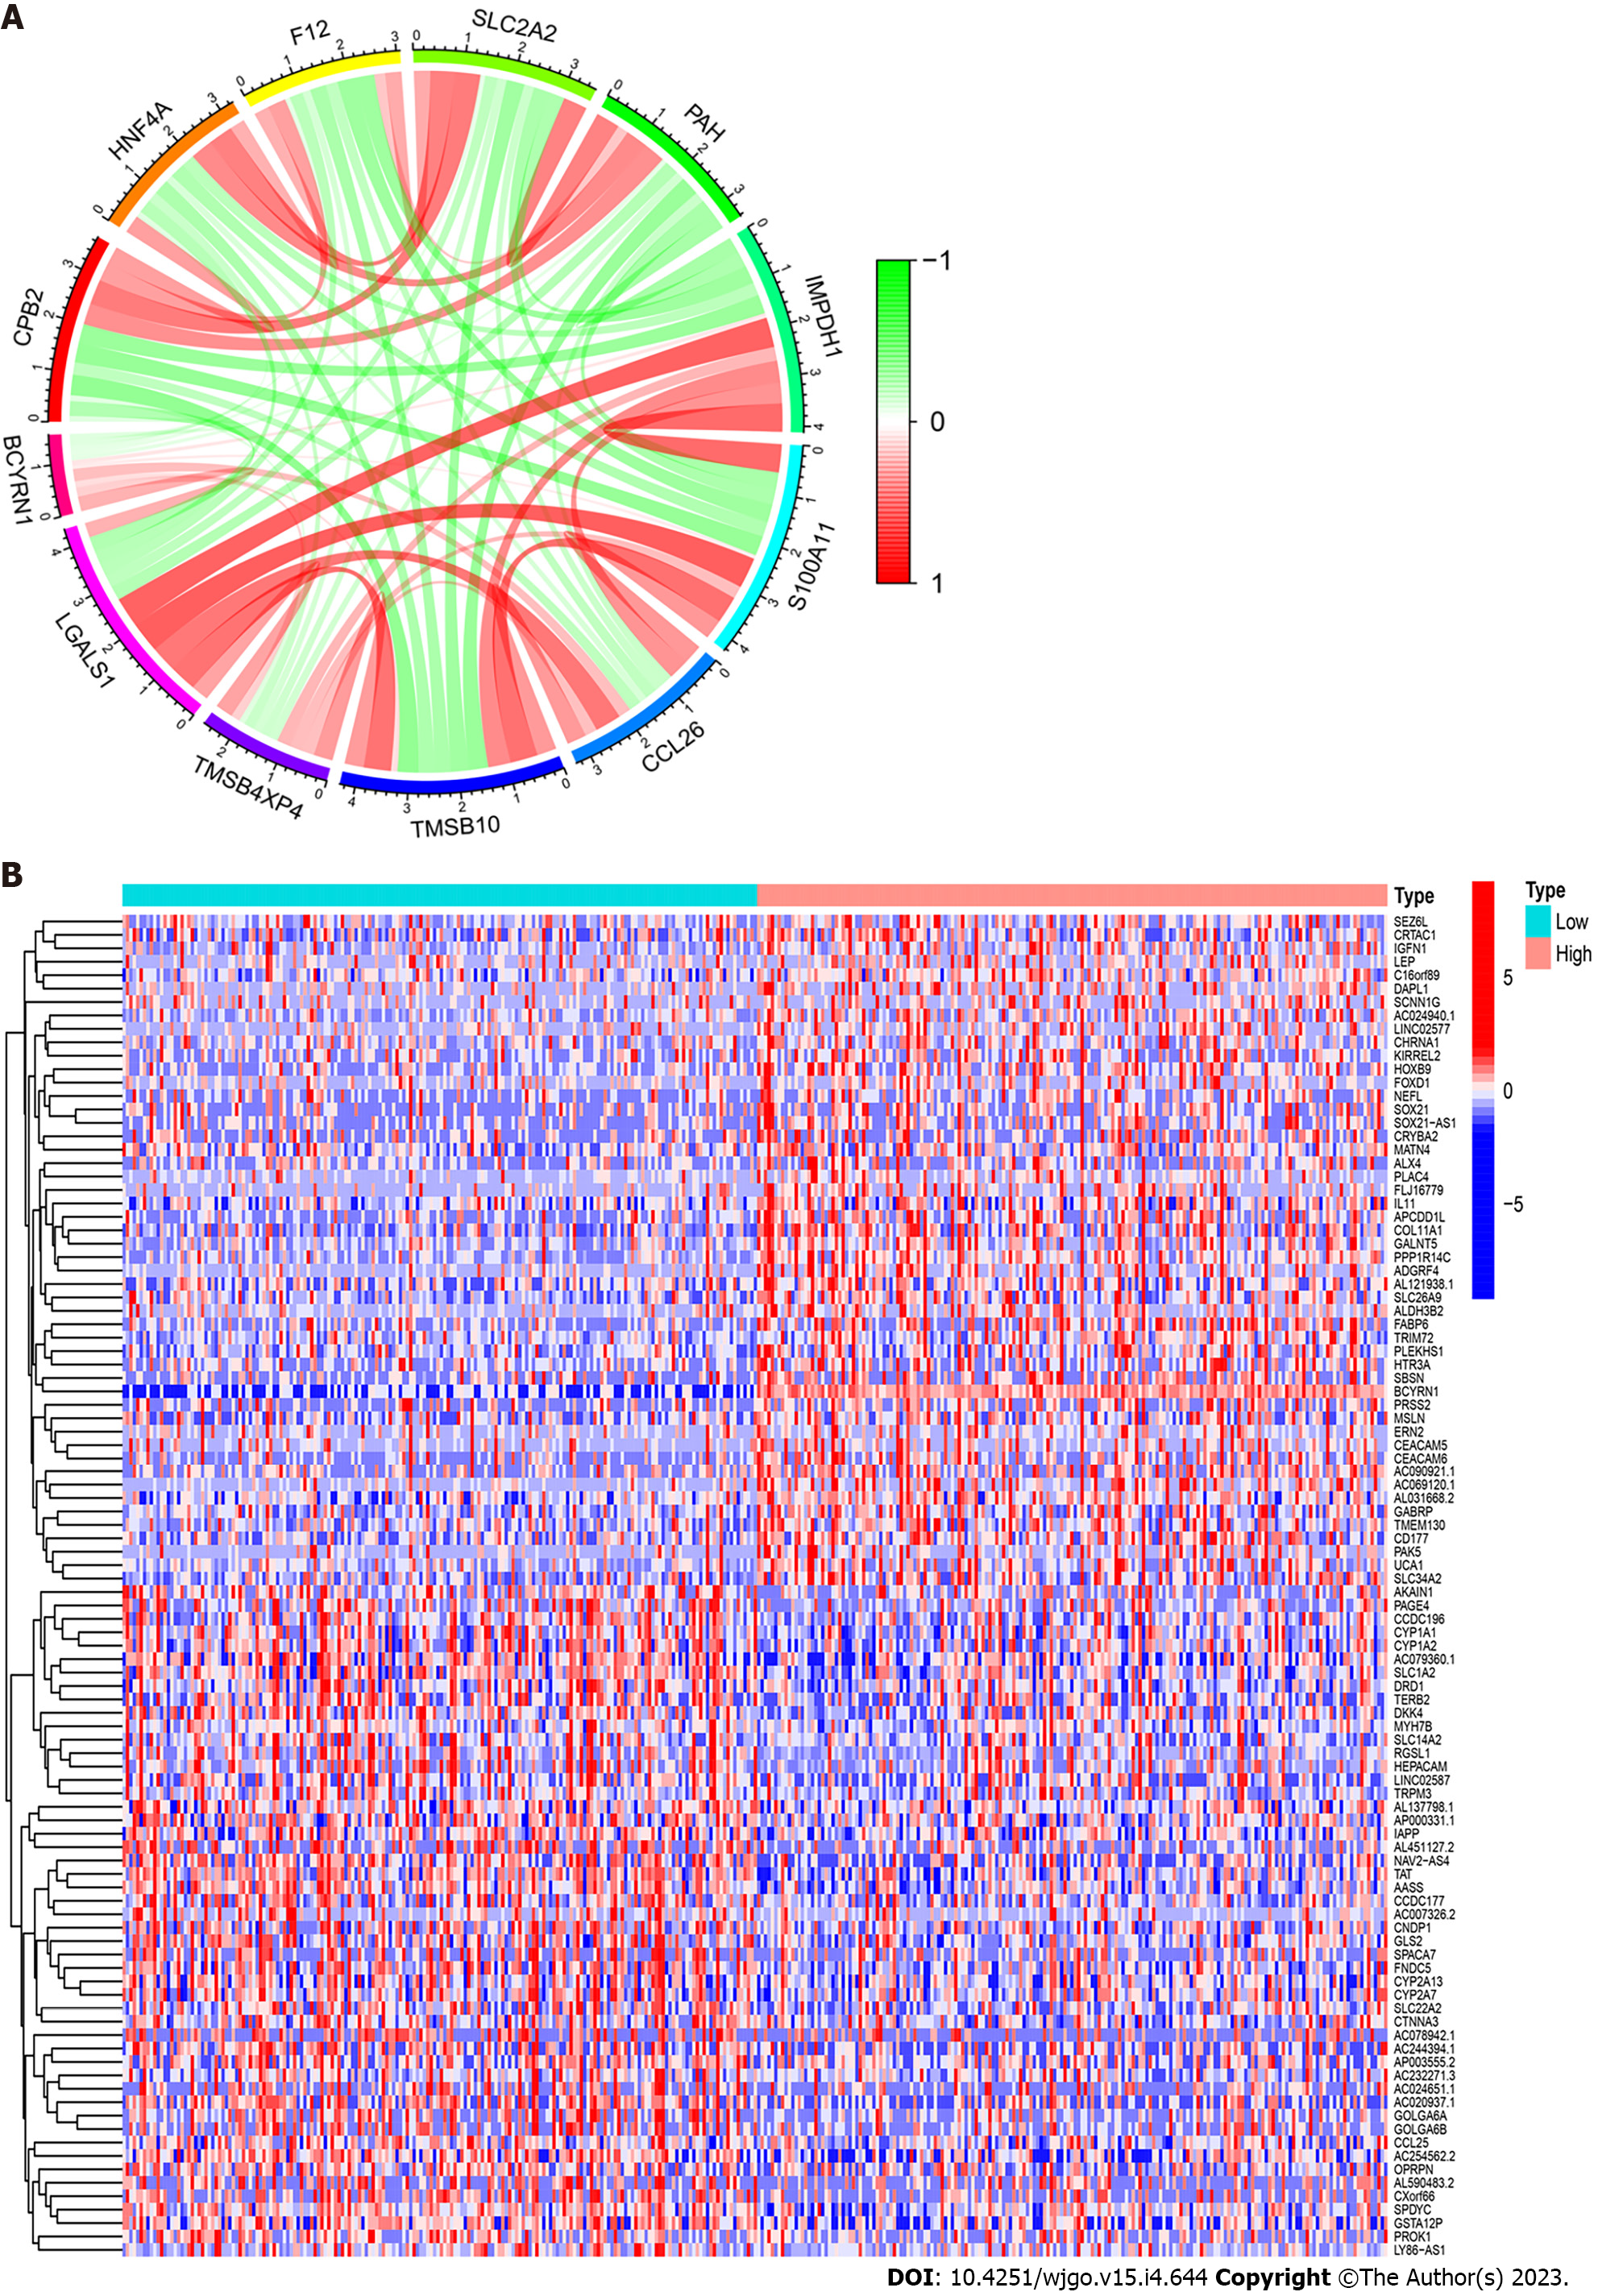
Figure 5 Co-expressed and differential genes of brain cytoplasmic RNA1 in hepatocellular carcinoma.
A: Co-expression circle plot of 11 genes most closely related to brain cytoplasmic RNA1 (BCYRN1) in hepatocellular carcinoma (HCC). Red represented significant positive correlation, green represented significant negative correlation, and shade represented the magnitude of correlation; B: Heat map of differentially expressed genes of BCYRN1 in HCC. Red represented upregulation and blue represented downregulation. Light blue represented the low expression group of BCYRN1, and light red represented the high expression group of BCYRN1.
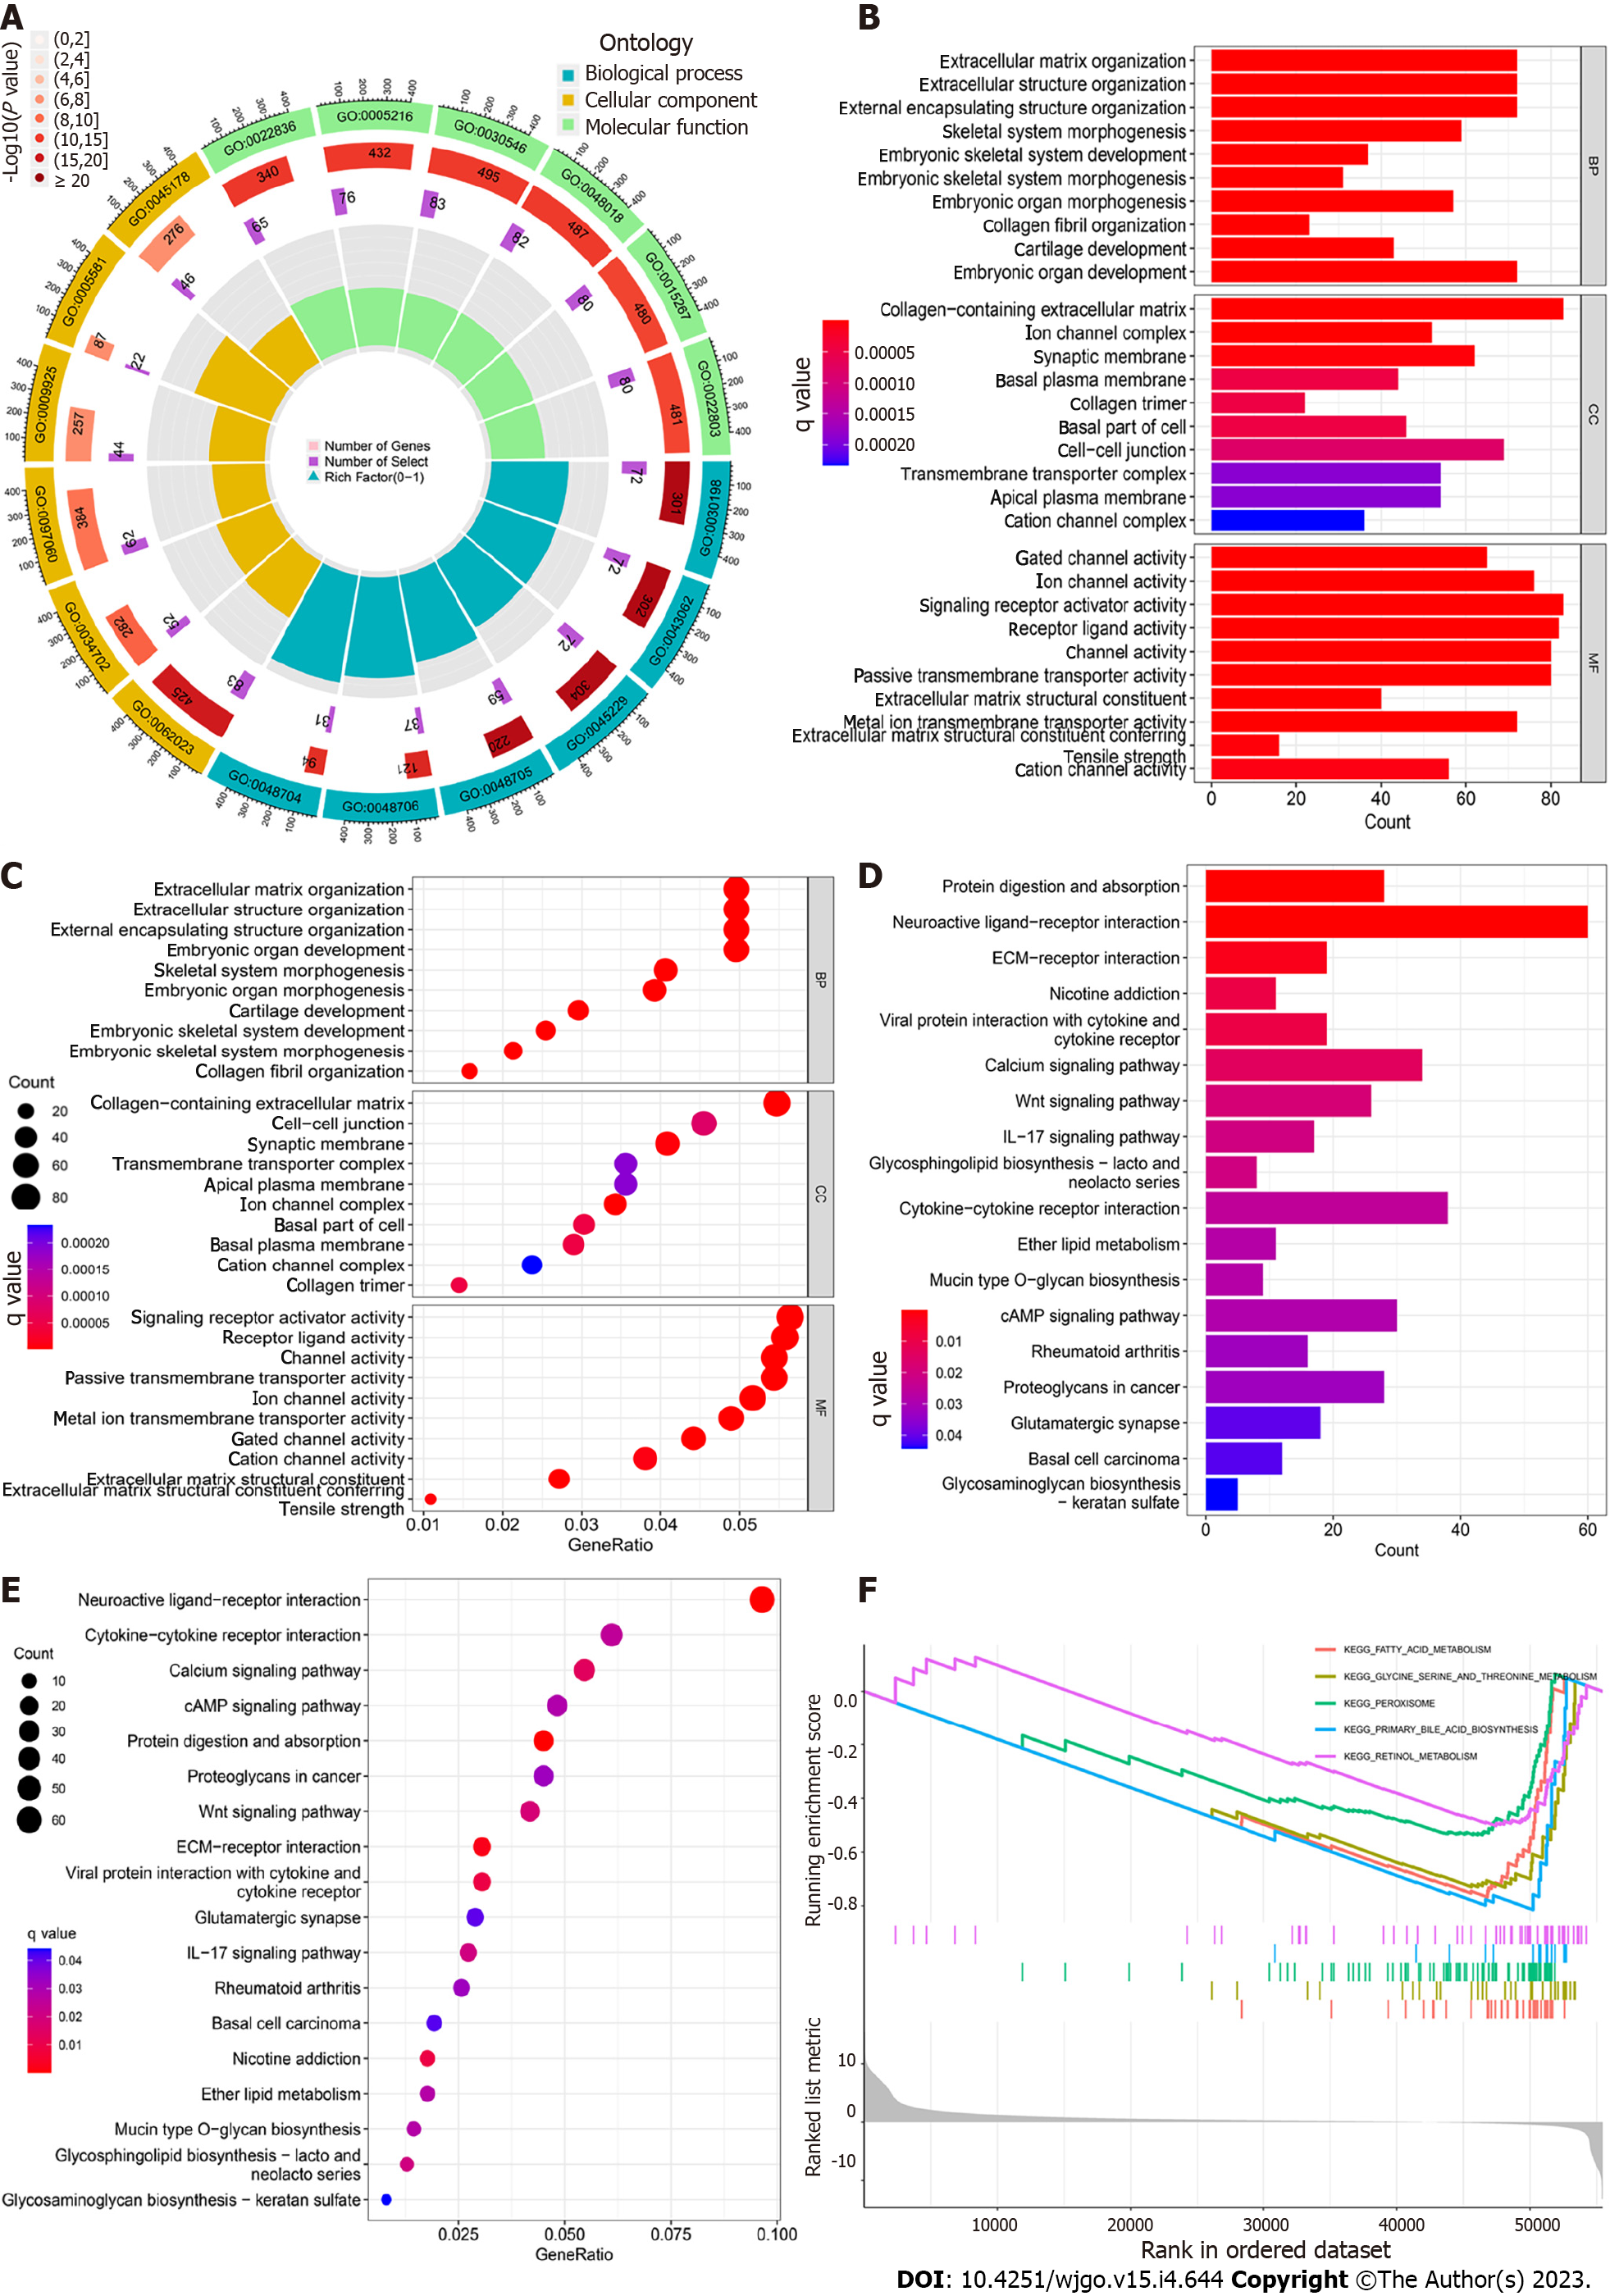
Figure 6 Enrichment analysis of brain cytoplasmic RNA1-associated differentially expressed genes.
A: Circle diagram of gene ontology (GO) enrichment analysis in biomolecular function, biological process and cellular component; B: Histogram of GO enrichment analysis; C: Bubble plots for GO enrichment analysis; D: Histogram of Kyoto Encyclopedia of Genes and Genomes (KEGG) enrichment analysis showed the top 20 pathways with the most significant correlation; E: Bubble plots for KEGG enrichment analysis; F: Brain cytoplasmic RNA1-associated Gene Set Enrichment Analysis.
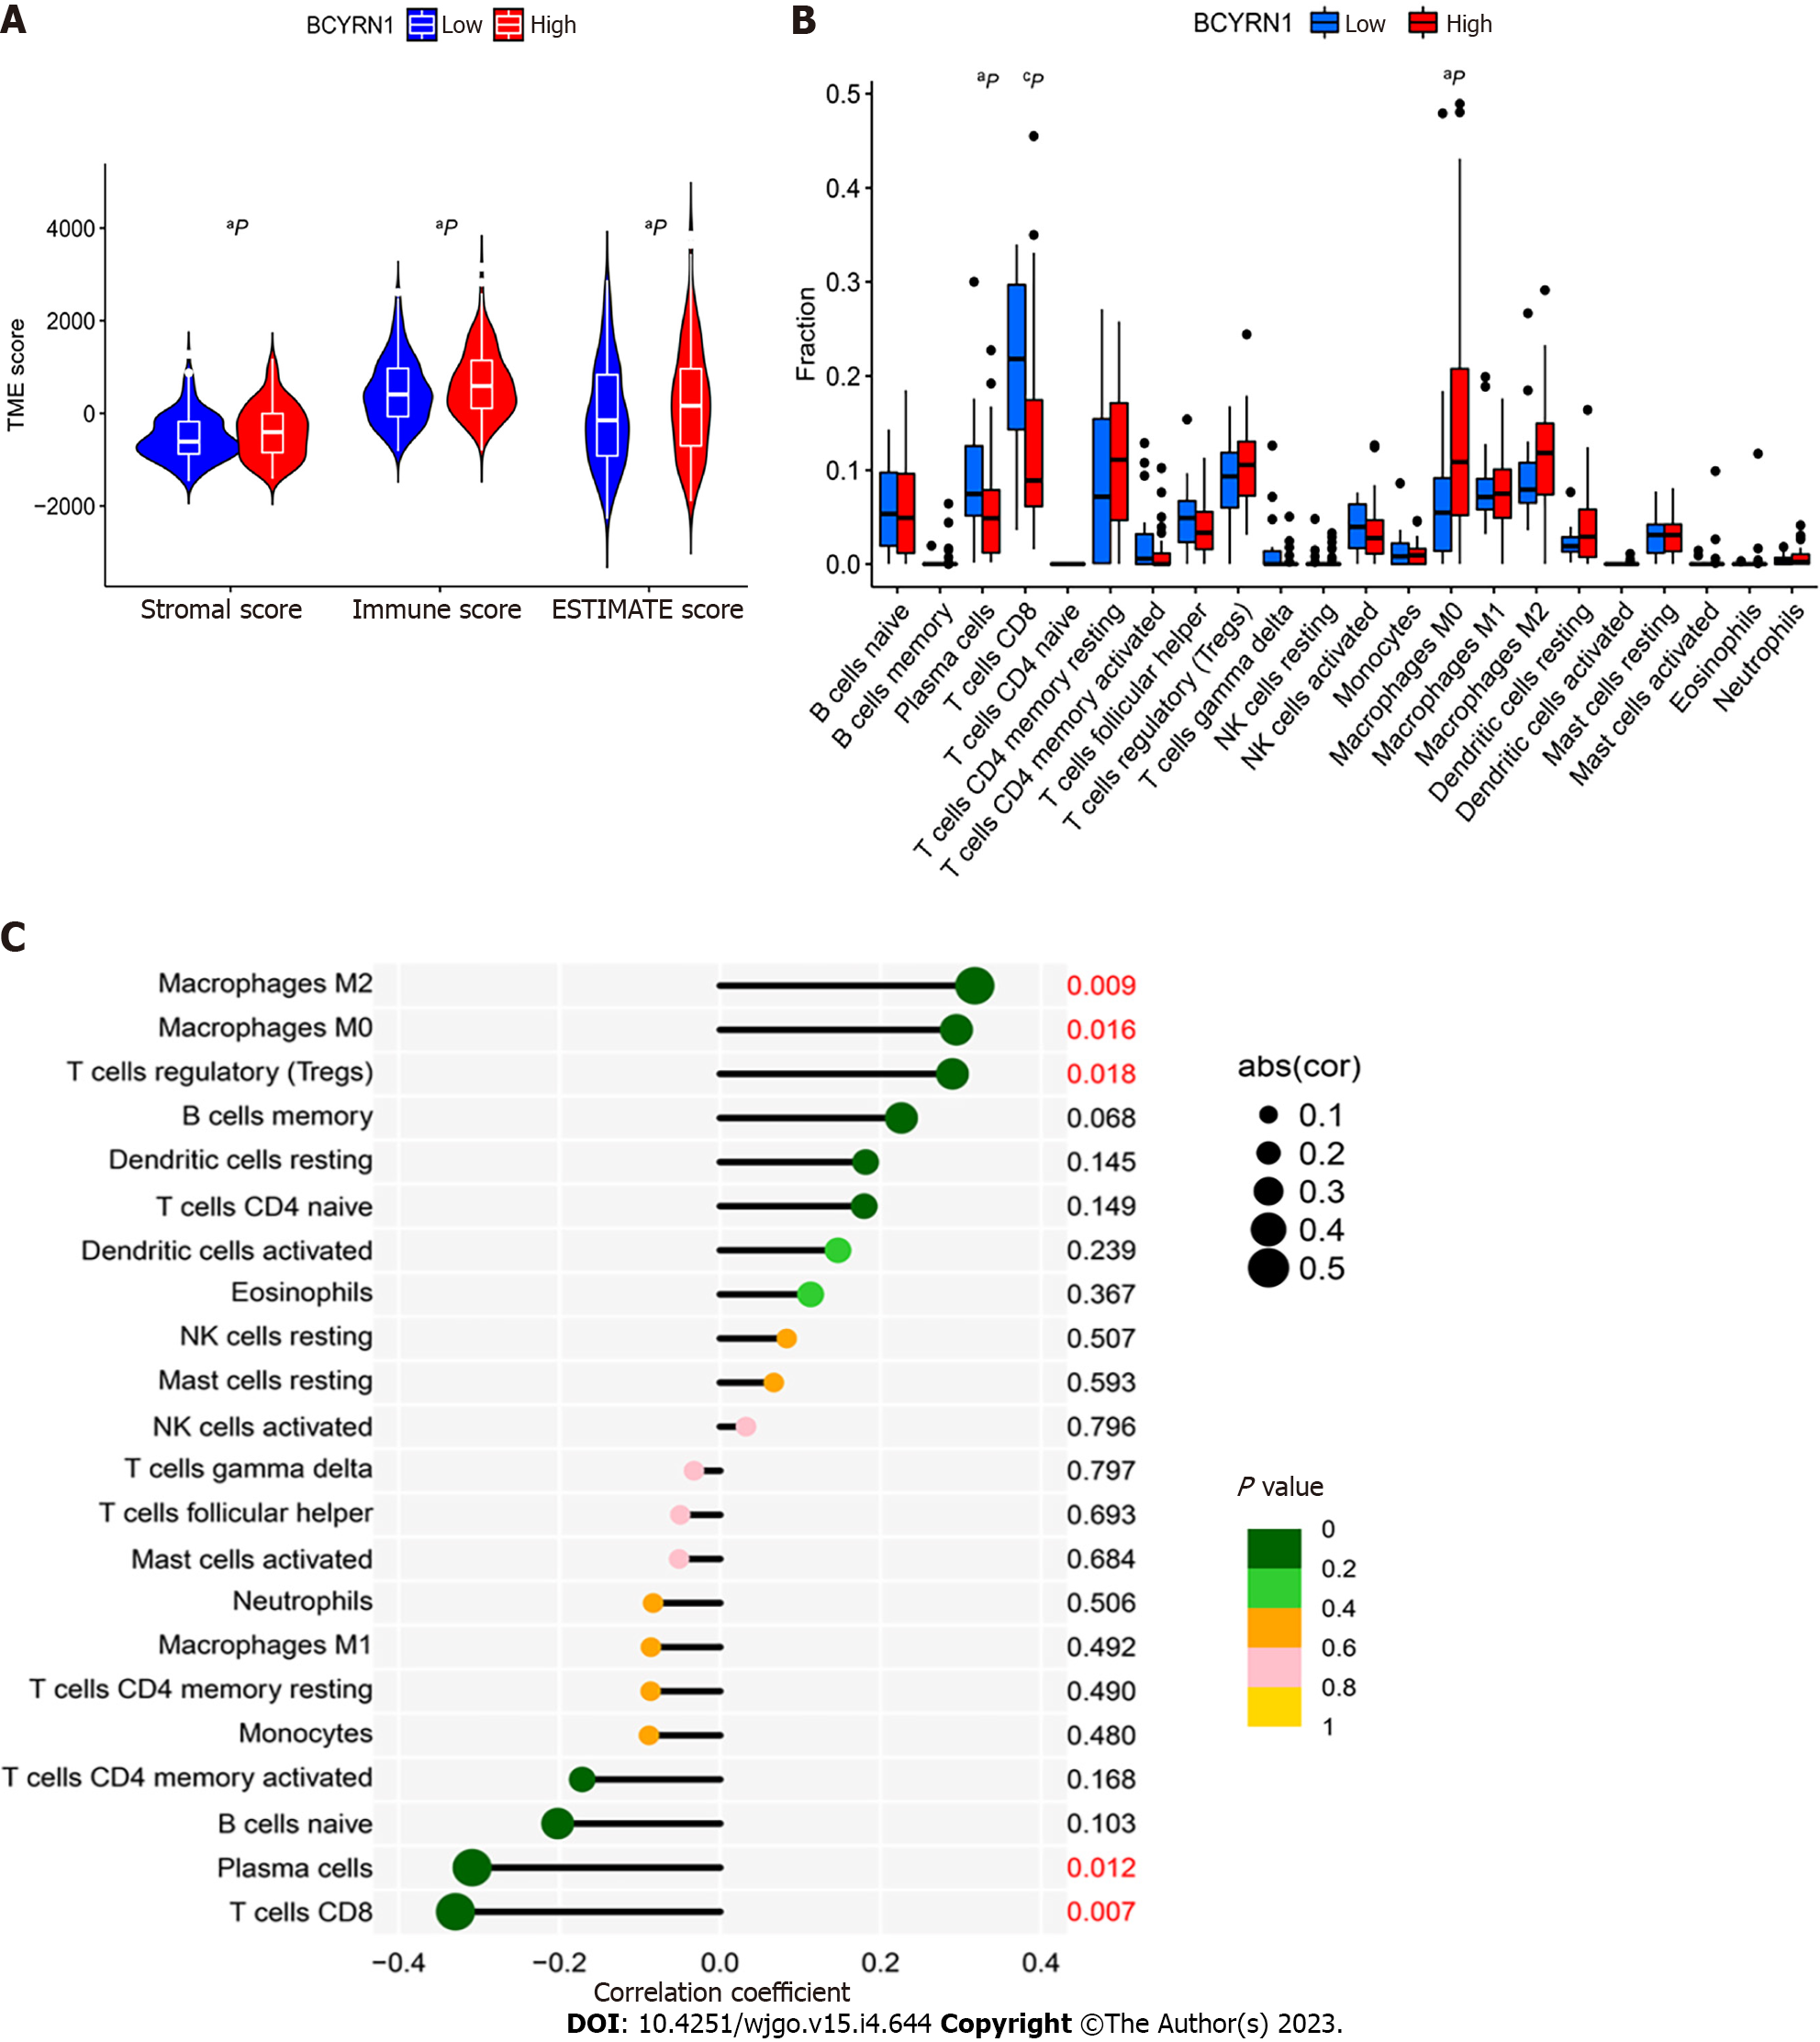
Figure 7 Correlation analysis and differential analysis of brain cytoplasmic RNA1 expression with tumor microenvironment and immune cell infiltration in hepatocellular carcinoma.
A: Violin plot of the difference in tumor microenvironment scores between the high and low brain cytoplasmic RNA1 (BCYRN1) expression groups; B: Box plots of differential analysis between the infiltration levels of 22 immune cells and the high and low expression groups of BCYRN1; C: Lollipop plot of correlation analysis between expression of BCYRN1 and levels of 22 immune cell infiltrates. aP < 0.05, bP < 0.01, cP < 0.001.
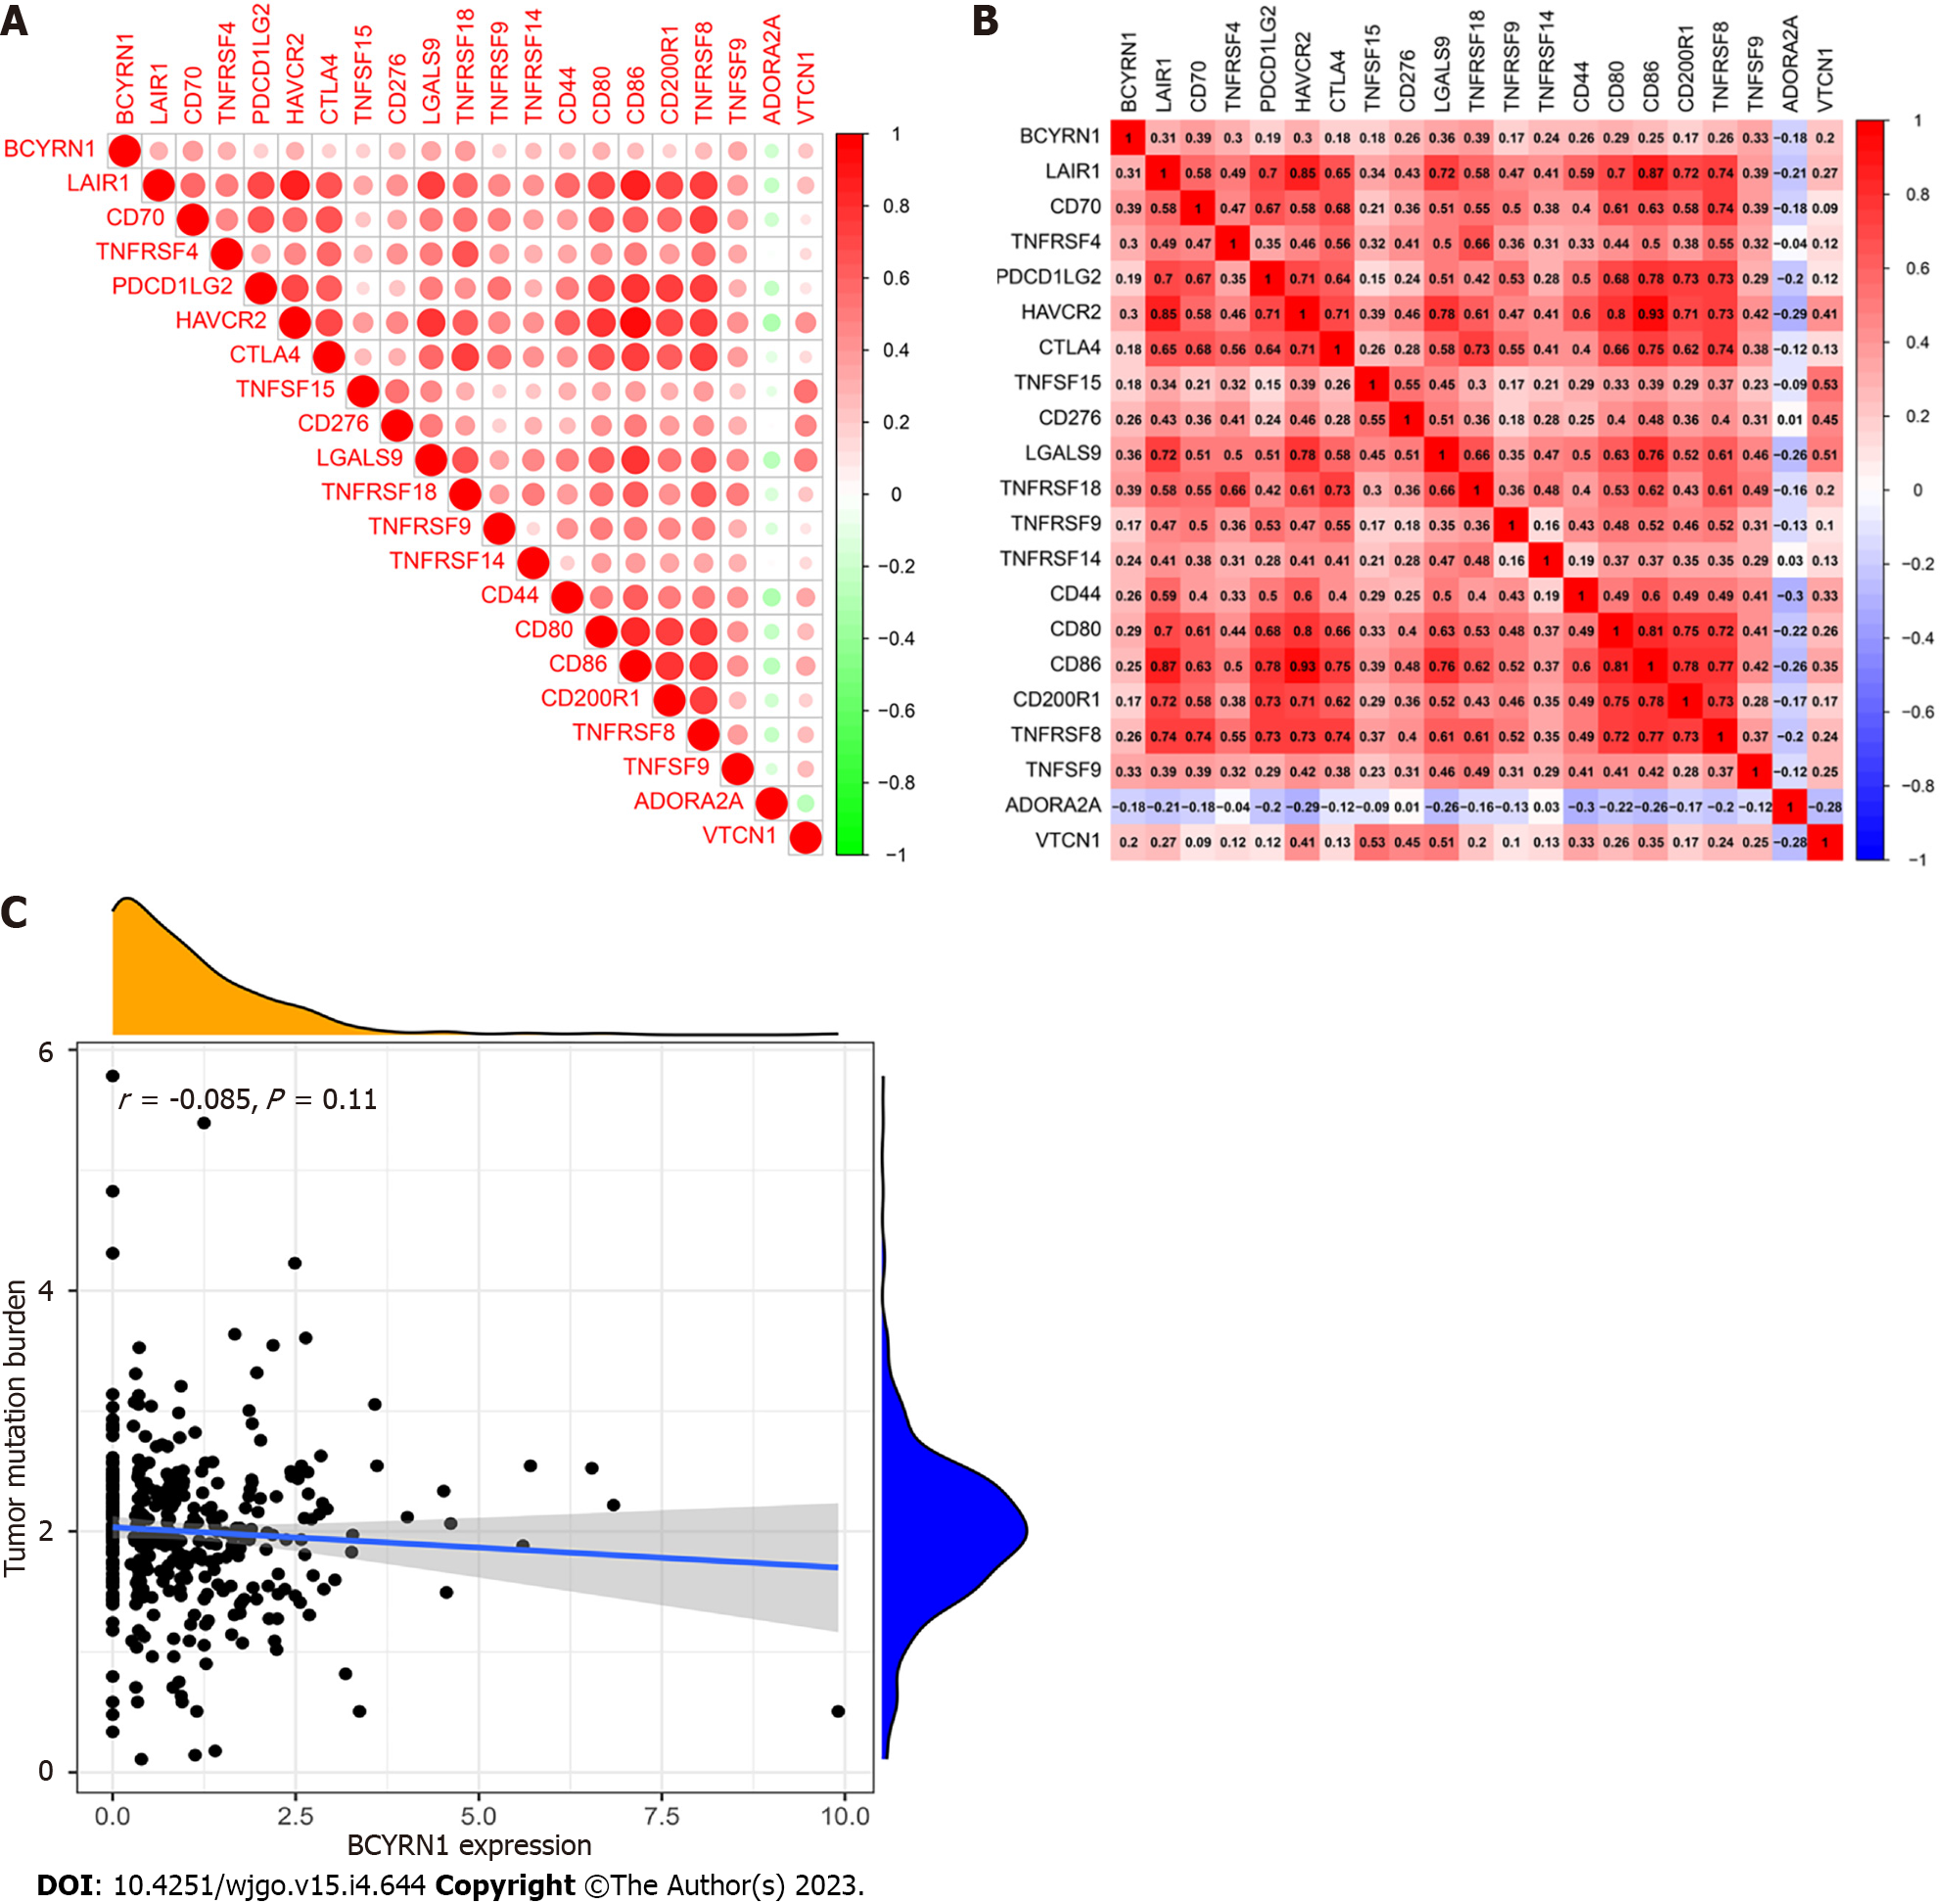
Figure 8 Correlation analysis of brain cytoplasmic RNA1 expression with immune checkpoint genes and tumor mutation burden.
A: Circular heatmap of immune checkpoint genes associated with brain cytoplasmic RNA1 (BCYRN1) expression; B: Rectangular heat map of immune checkpoint genes associated with BCYRN1 expression; C: Scatter plot of the correlation between BCYRN1 expression and tumor mutation burden.
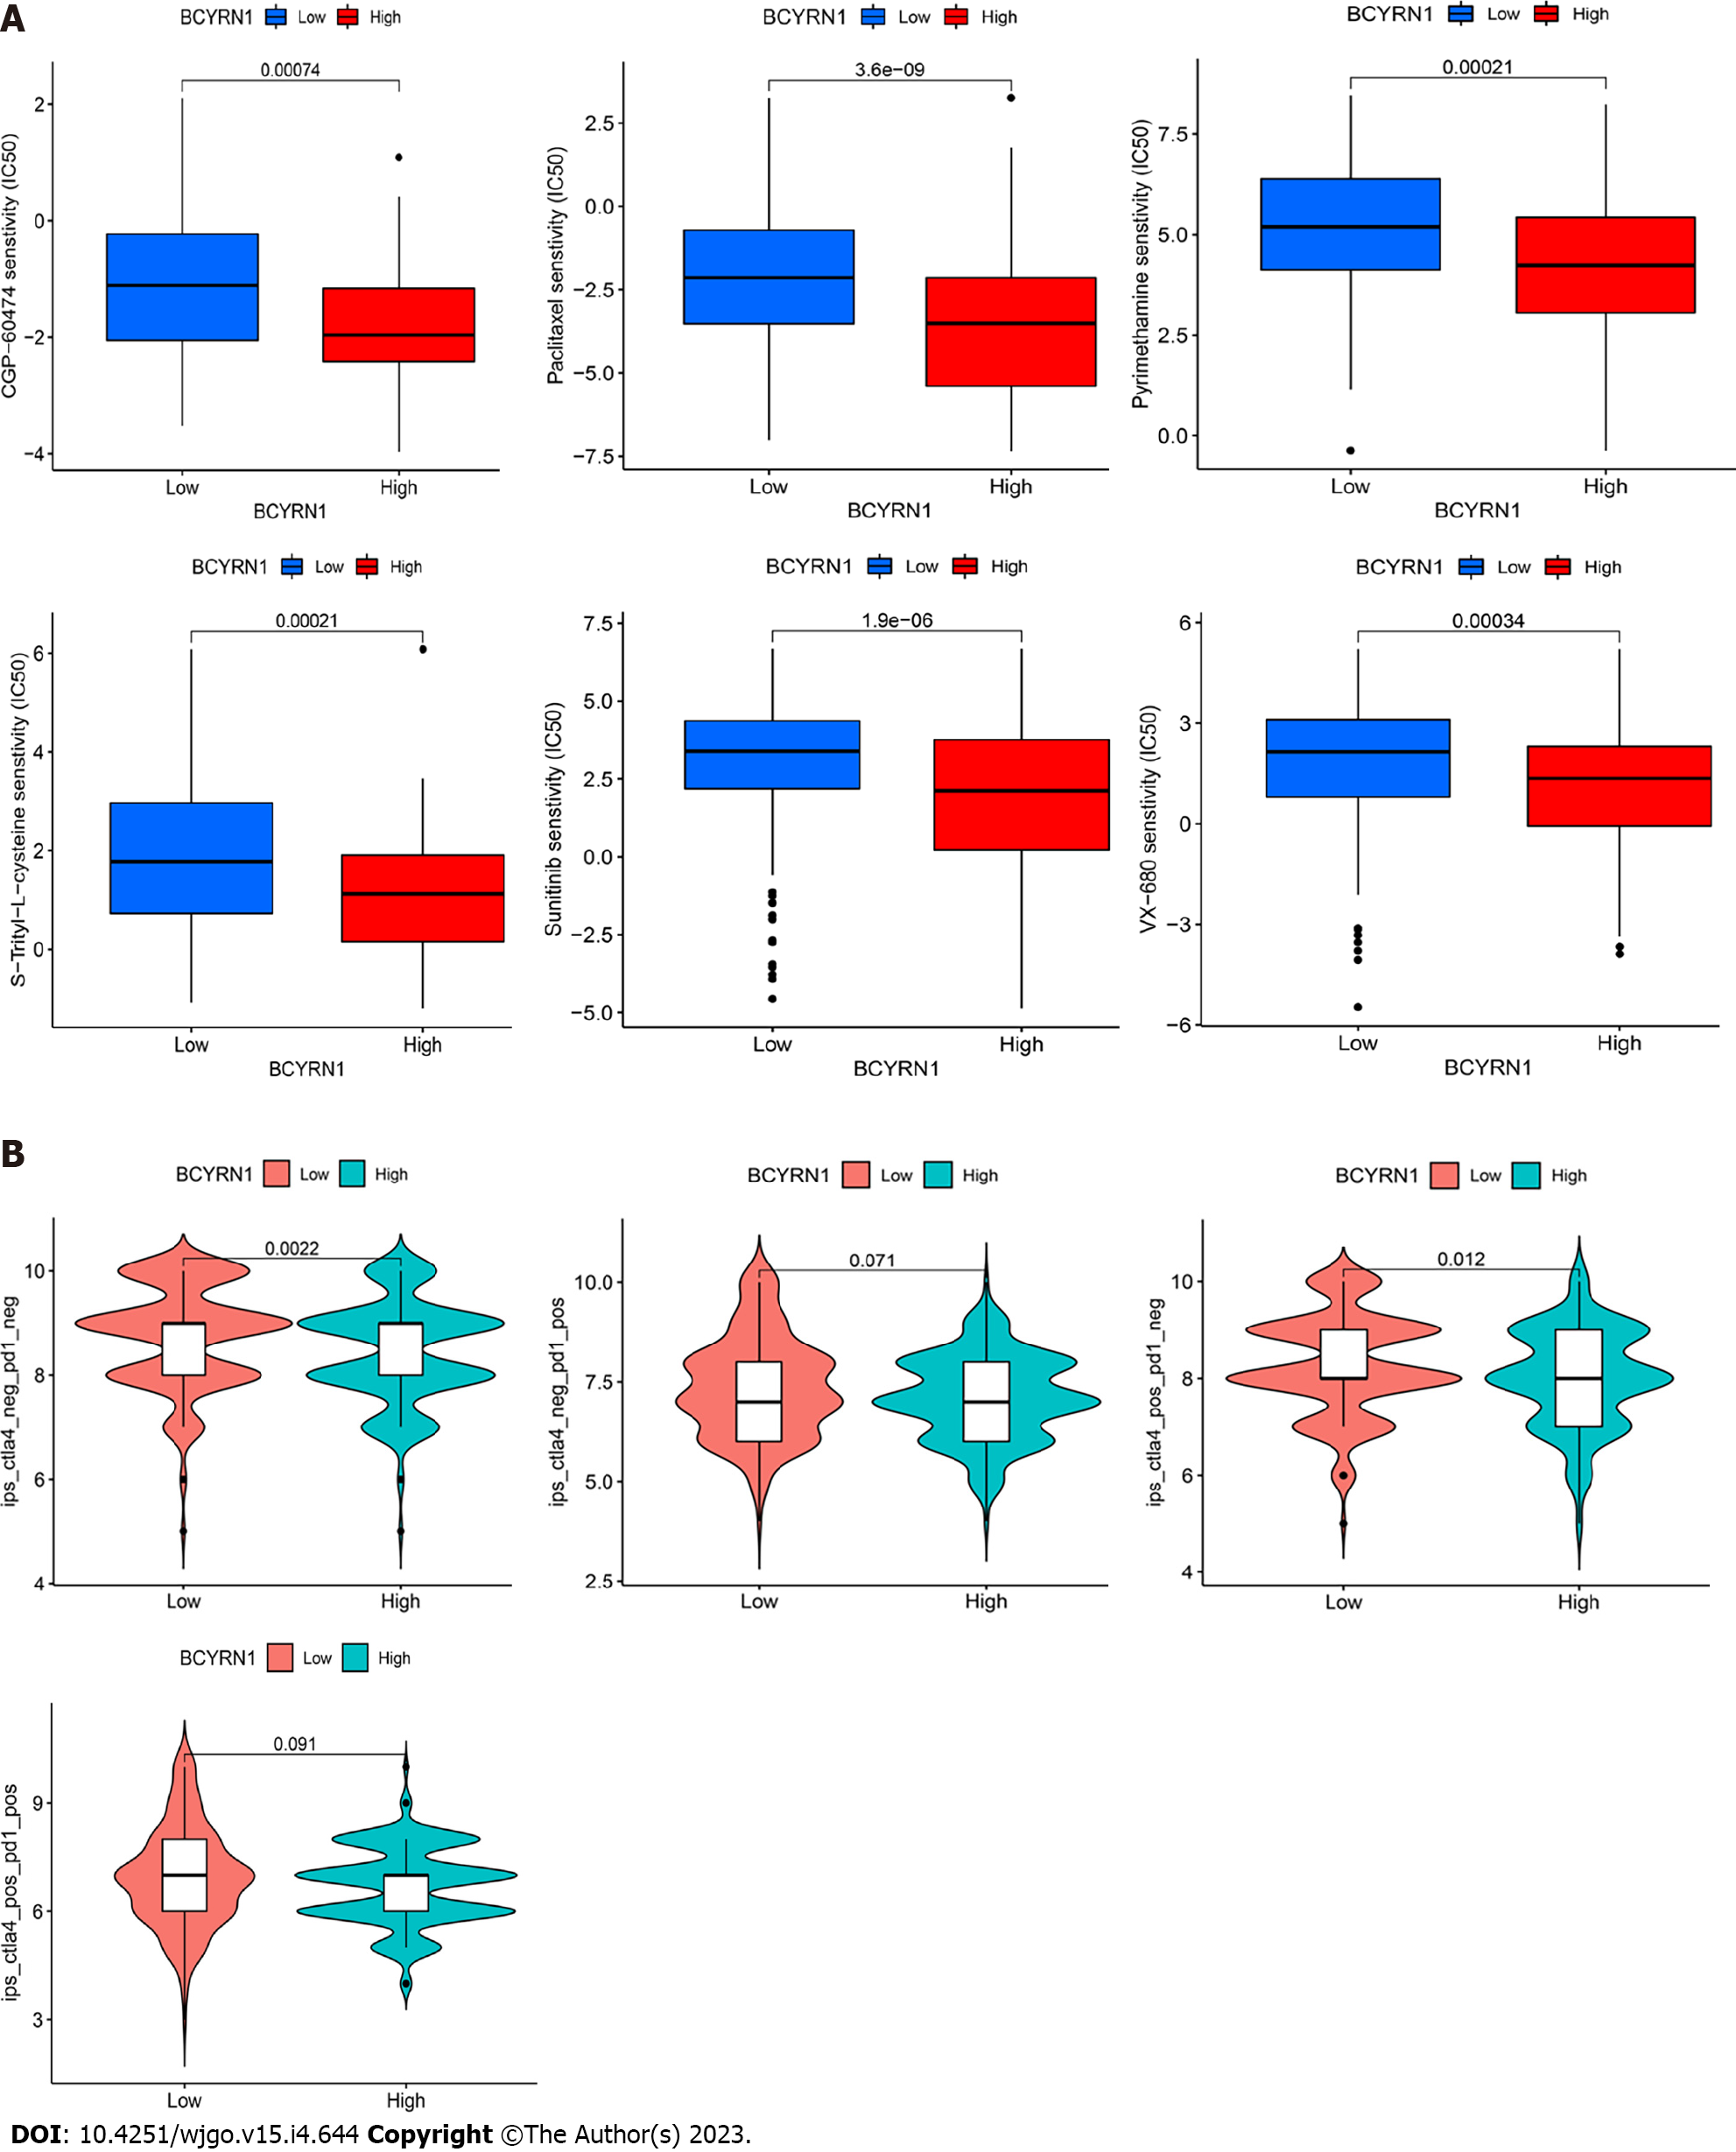
Figure 9 Differential analysis of brain cytoplasmic RNA1 expression with chemosensitivity and immunotherapy efficacy.
A: Box plots of the differences of sensitivity of the six selected chemotherapeutic agents between the high and low expression groups of brain cytoplasmic RNA1 (BCYRN1); B: Violin plot of the difference of immunotherapy effect between the high and low expression groups of BCYRN1.
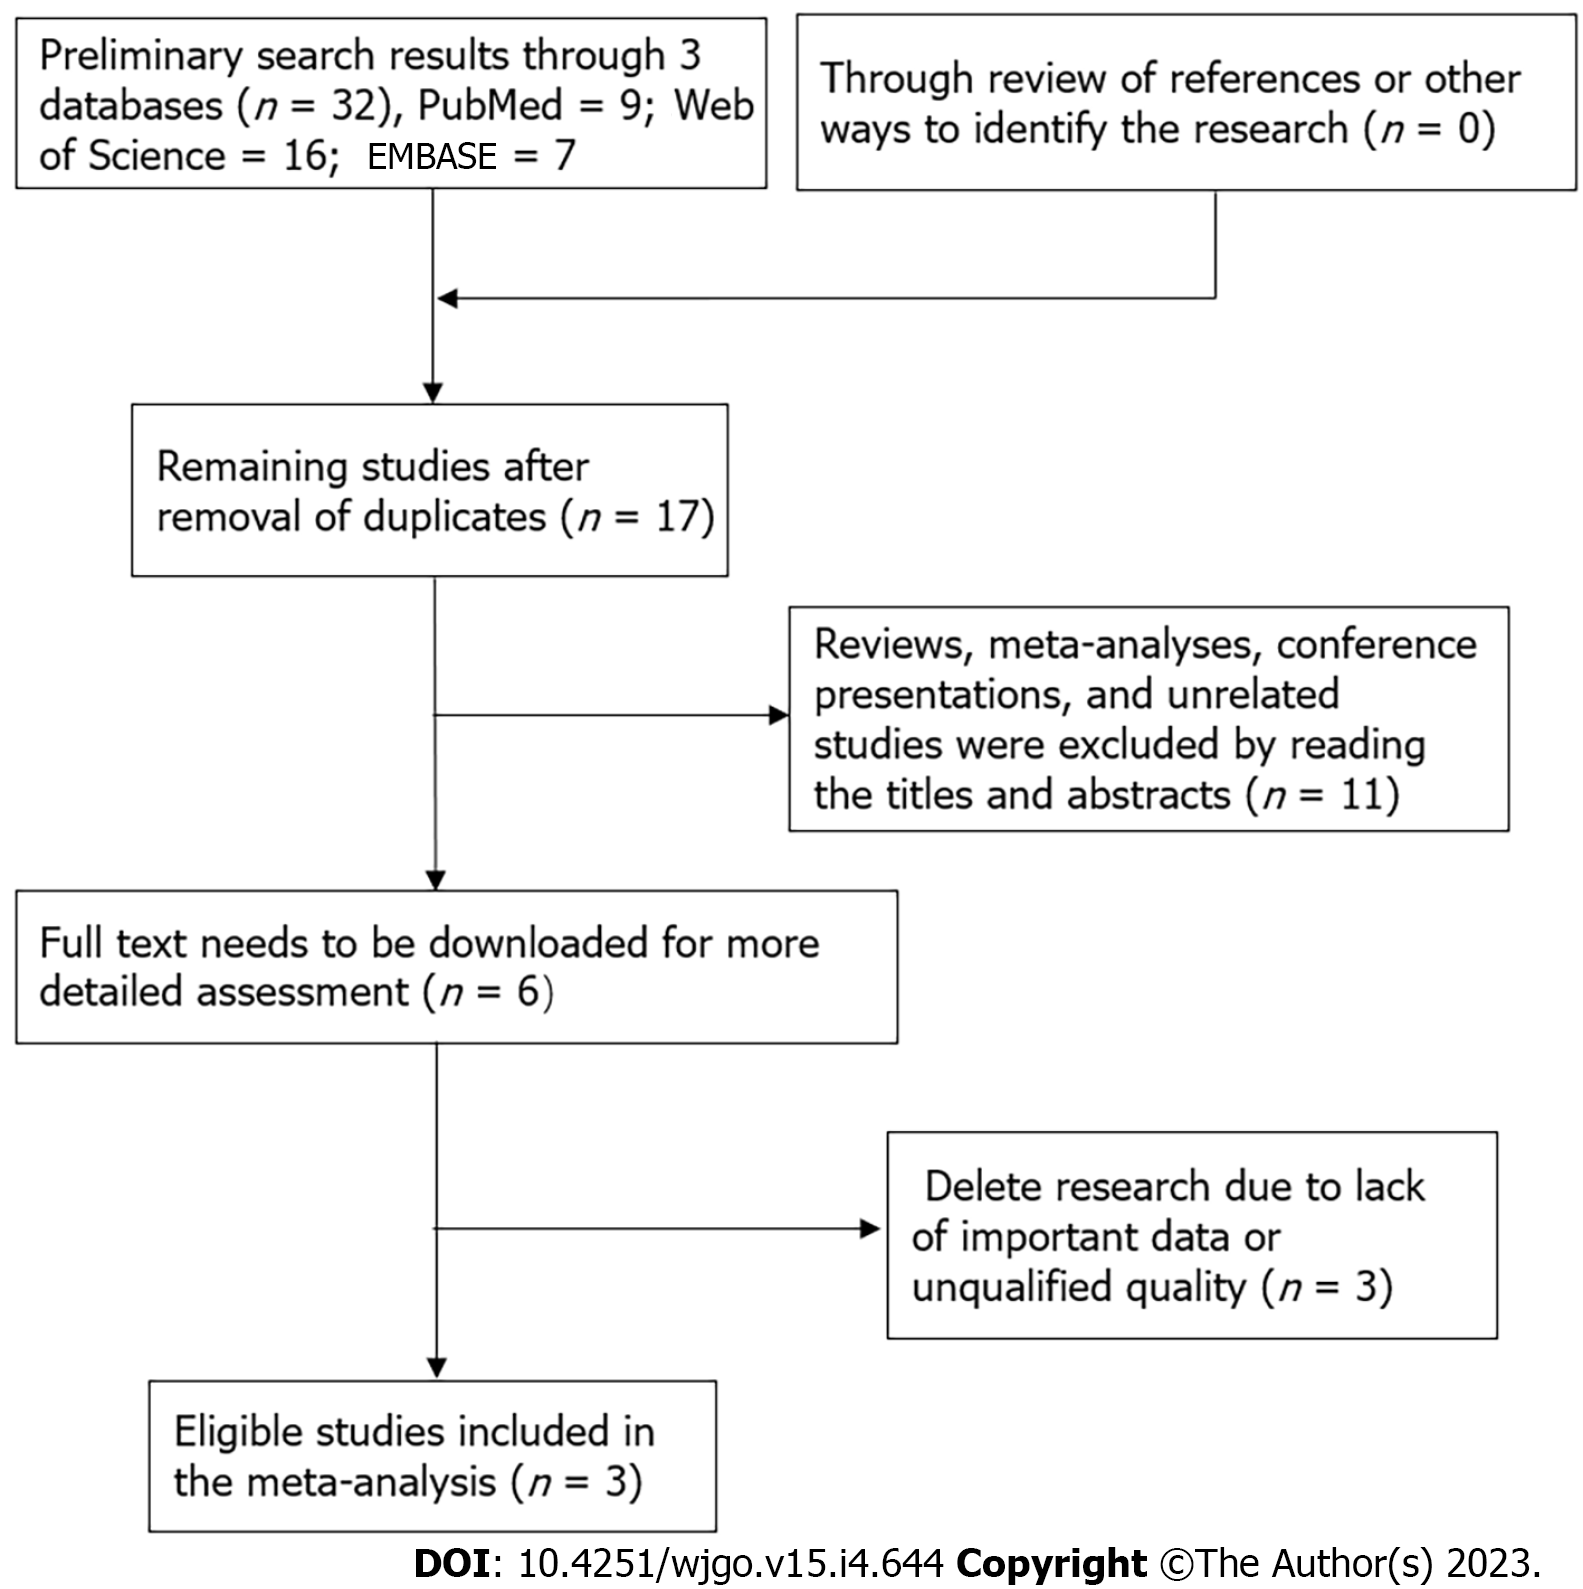
Figure 10 Flow chart of literature retrieval and screening for meta-analysis.
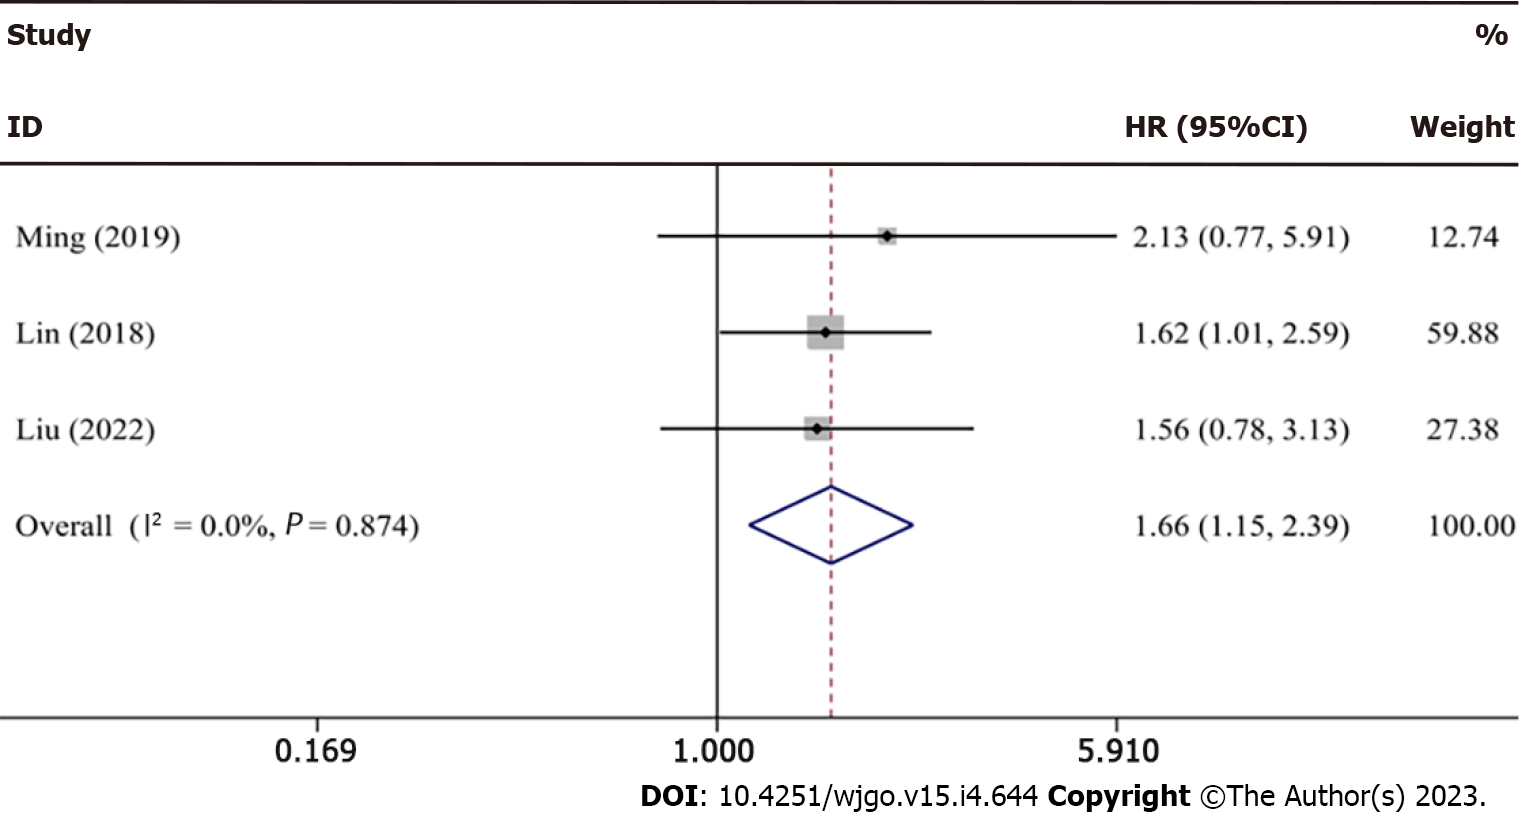
Figure 11 Forest plot for meta-analysis of brain cytoplasmic RNA1 expression vs overall survival in hepatocellular carcinoma patients.
- Citation: Han XY, Li X, Zhao RY, Ma HZ, Yu M, Niu XD, Jin HJ, Wang YF, Liu DM, Cai H. Comprehensive analysis of prognostic value and immunotherapy prospect of brain cytoplasmic RNA1 in hepatocellular carcinoma. World J Gastrointest Oncol 2023; 15(4): 644-664
- URL: https://www.wjgnet.com/1948-5204/full/v15/i4/644.htm
- DOI: https://dx.doi.org/10.4251/wjgo.v15.i4.644


