Copyright
©The Author(s) 2023.
World J Gastrointest Oncol. Mar 15, 2023; 15(3): 523-532
Published online Mar 15, 2023. doi: 10.4251/wjgo.v15.i3.523
Published online Mar 15, 2023. doi: 10.4251/wjgo.v15.i3.523
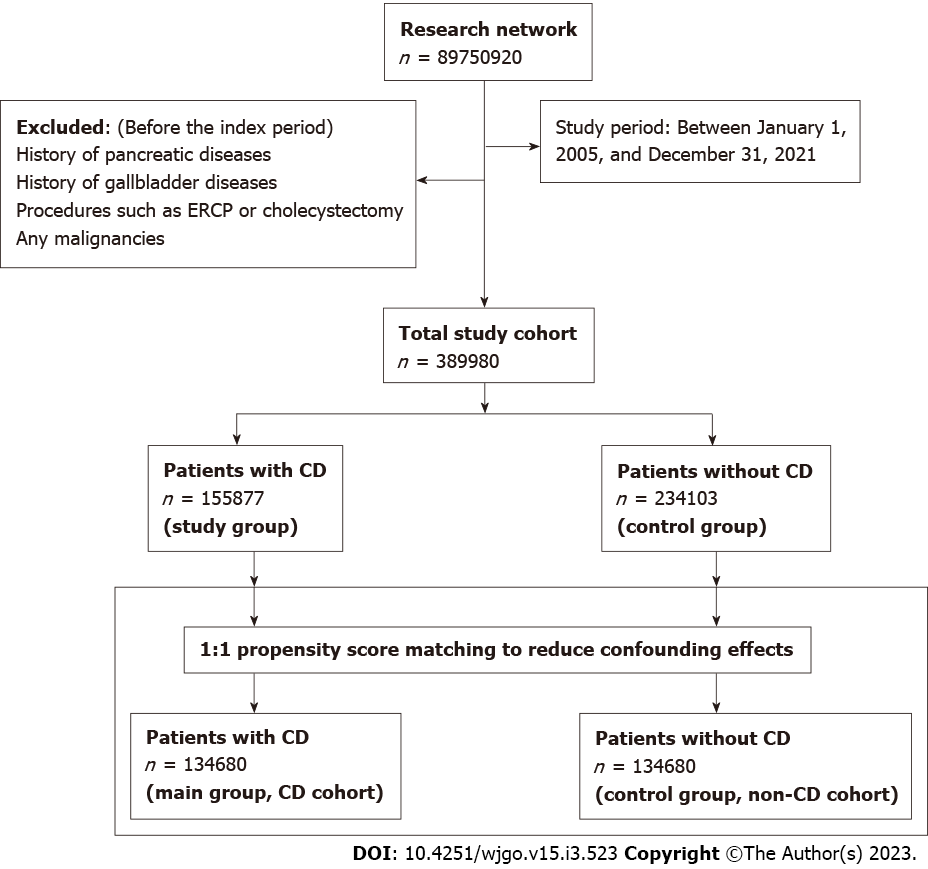
Figure 1 Flow chart showing patient selection for study cohorts.
CD: Celiac disease; ERCP: Endoscopic retrograde cholangiopancreatography.
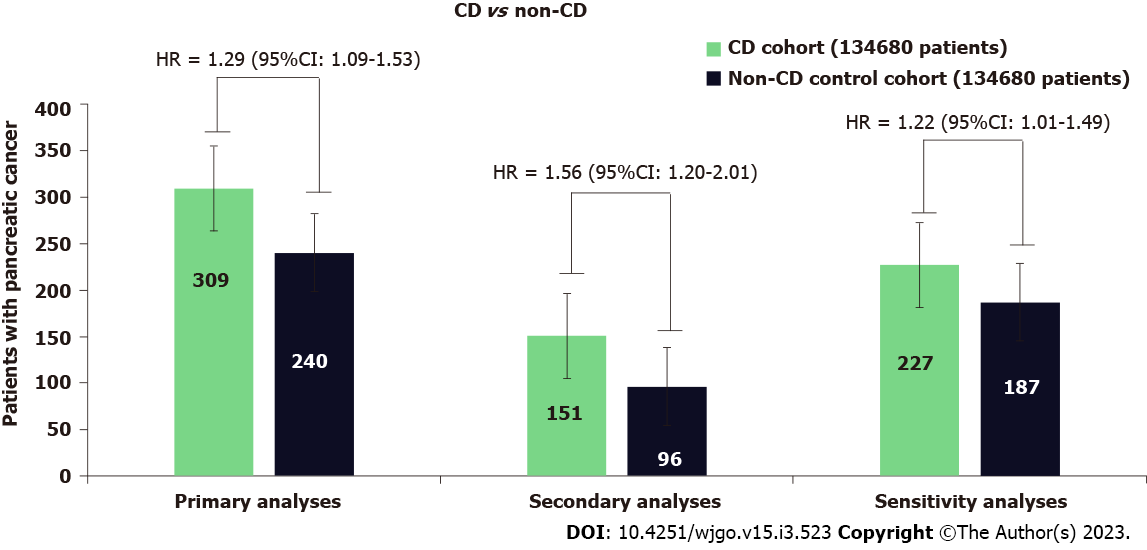
Figure 2 Risk of pancreatic cancer for patients with celiac disease compared to patients without celiac disease (non-celiac controls).
The numbers inside the bars represent the number of patients who developed pancreatic cancer during follow-up. CD: Celiac disease; HR: Hazard ratio; CI: Confidence interval.
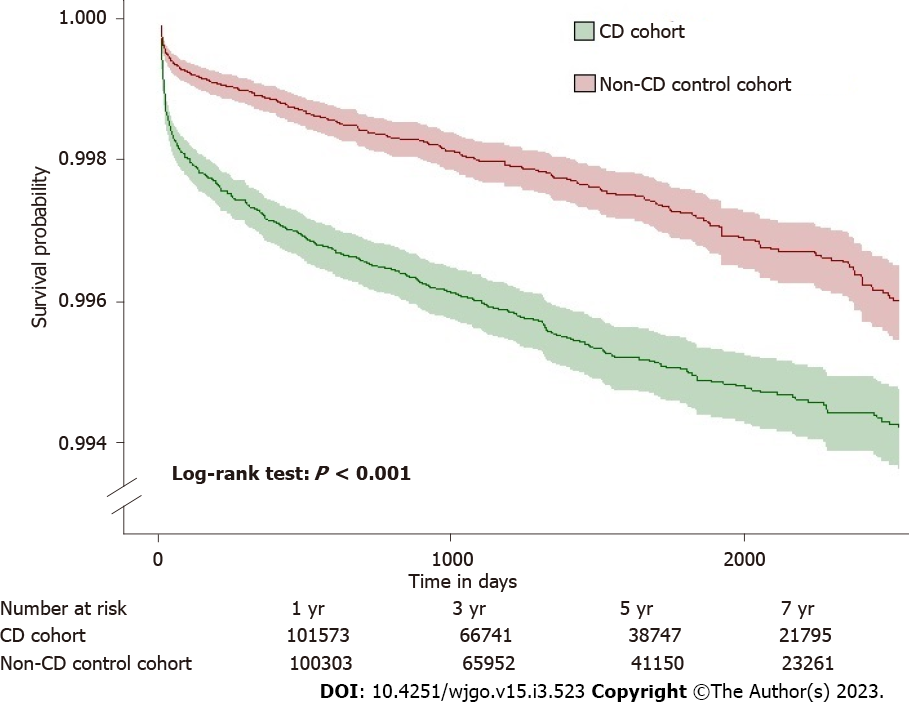
Figure 3 Kaplan-Meier curve shows the risk of pancreatic cancer in patients with celiac disease and matched non-celiac controls.
- Citation: Krishnan A, Hadi YB, Shabih S, Mukherjee D, Patel RA, Patel R, Singh S, Thakkar S. Risk of pancreatic cancer in individuals with celiac disease in the United States: A population-based matched cohort study. World J Gastrointest Oncol 2023; 15(3): 523-532
- URL: https://www.wjgnet.com/1948-5204/full/v15/i3/523.htm
- DOI: https://dx.doi.org/10.4251/wjgo.v15.i3.523


