Copyright
©The Author(s) 2023.
World J Gastrointest Oncol. Dec 15, 2023; 15(12): 2212-2224
Published online Dec 15, 2023. doi: 10.4251/wjgo.v15.i12.2212
Published online Dec 15, 2023. doi: 10.4251/wjgo.v15.i12.2212
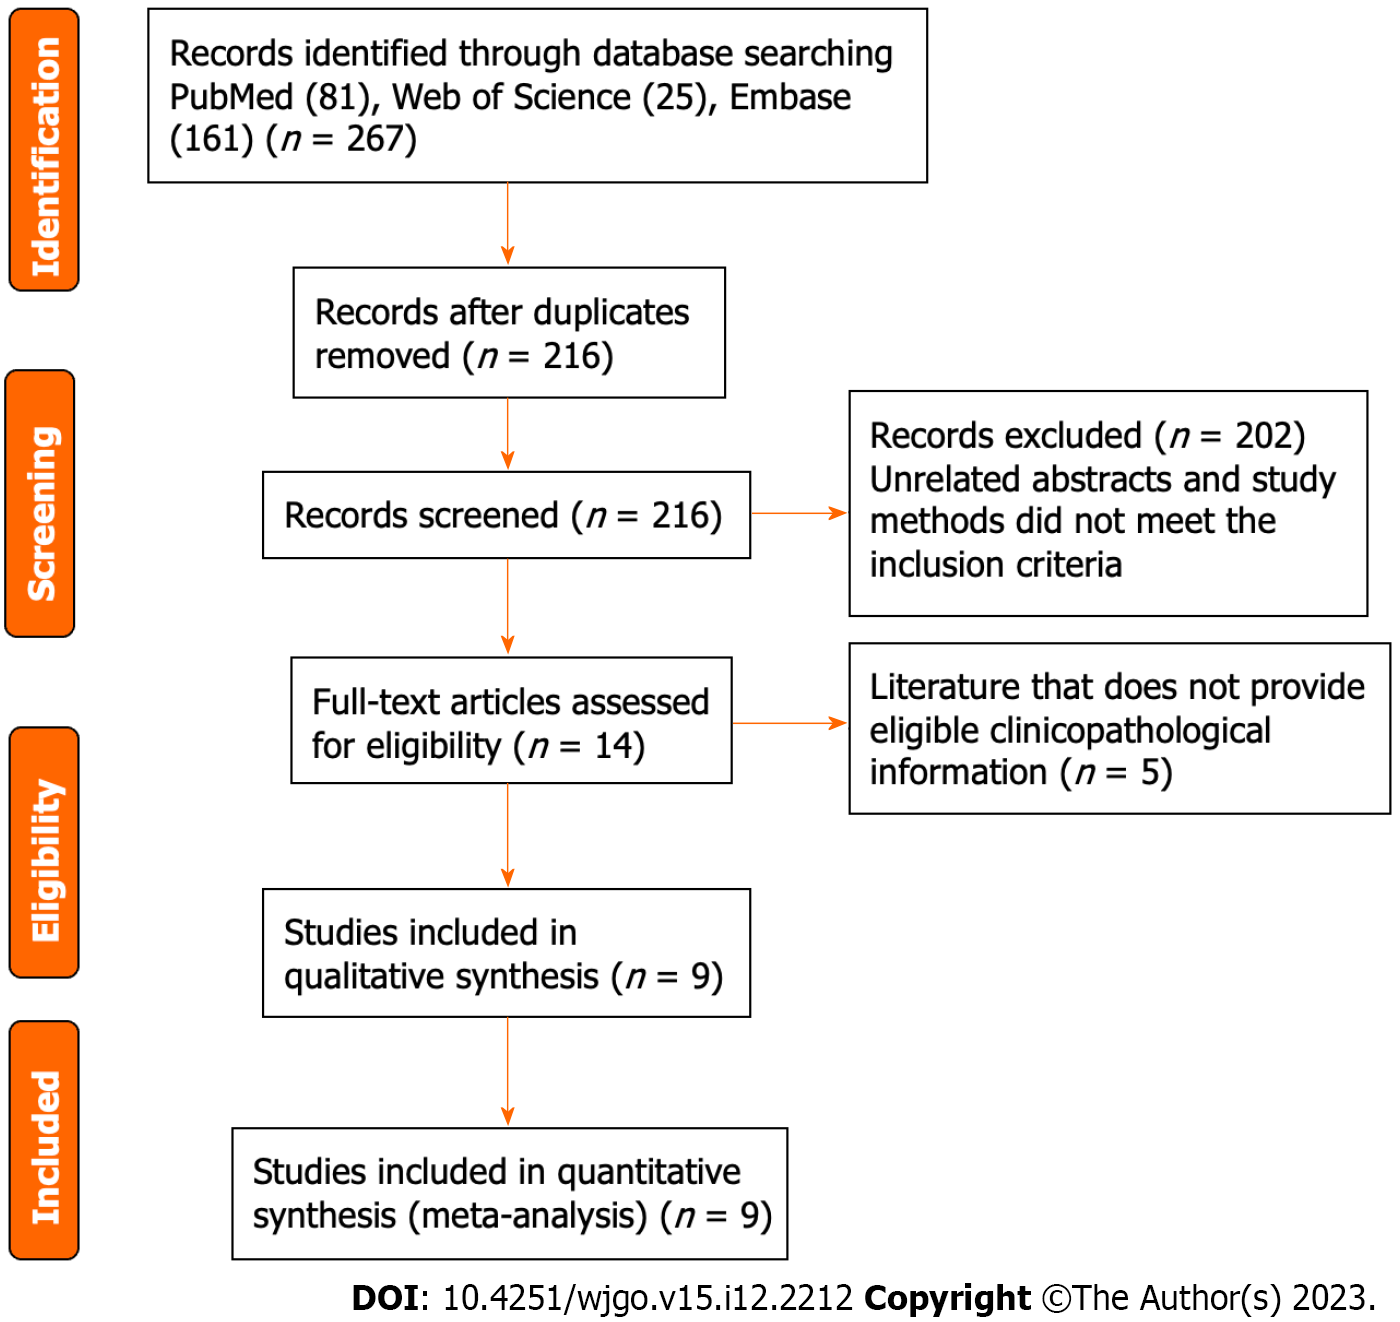
Figure 1 Flow diagram for the study selection criteria and process.
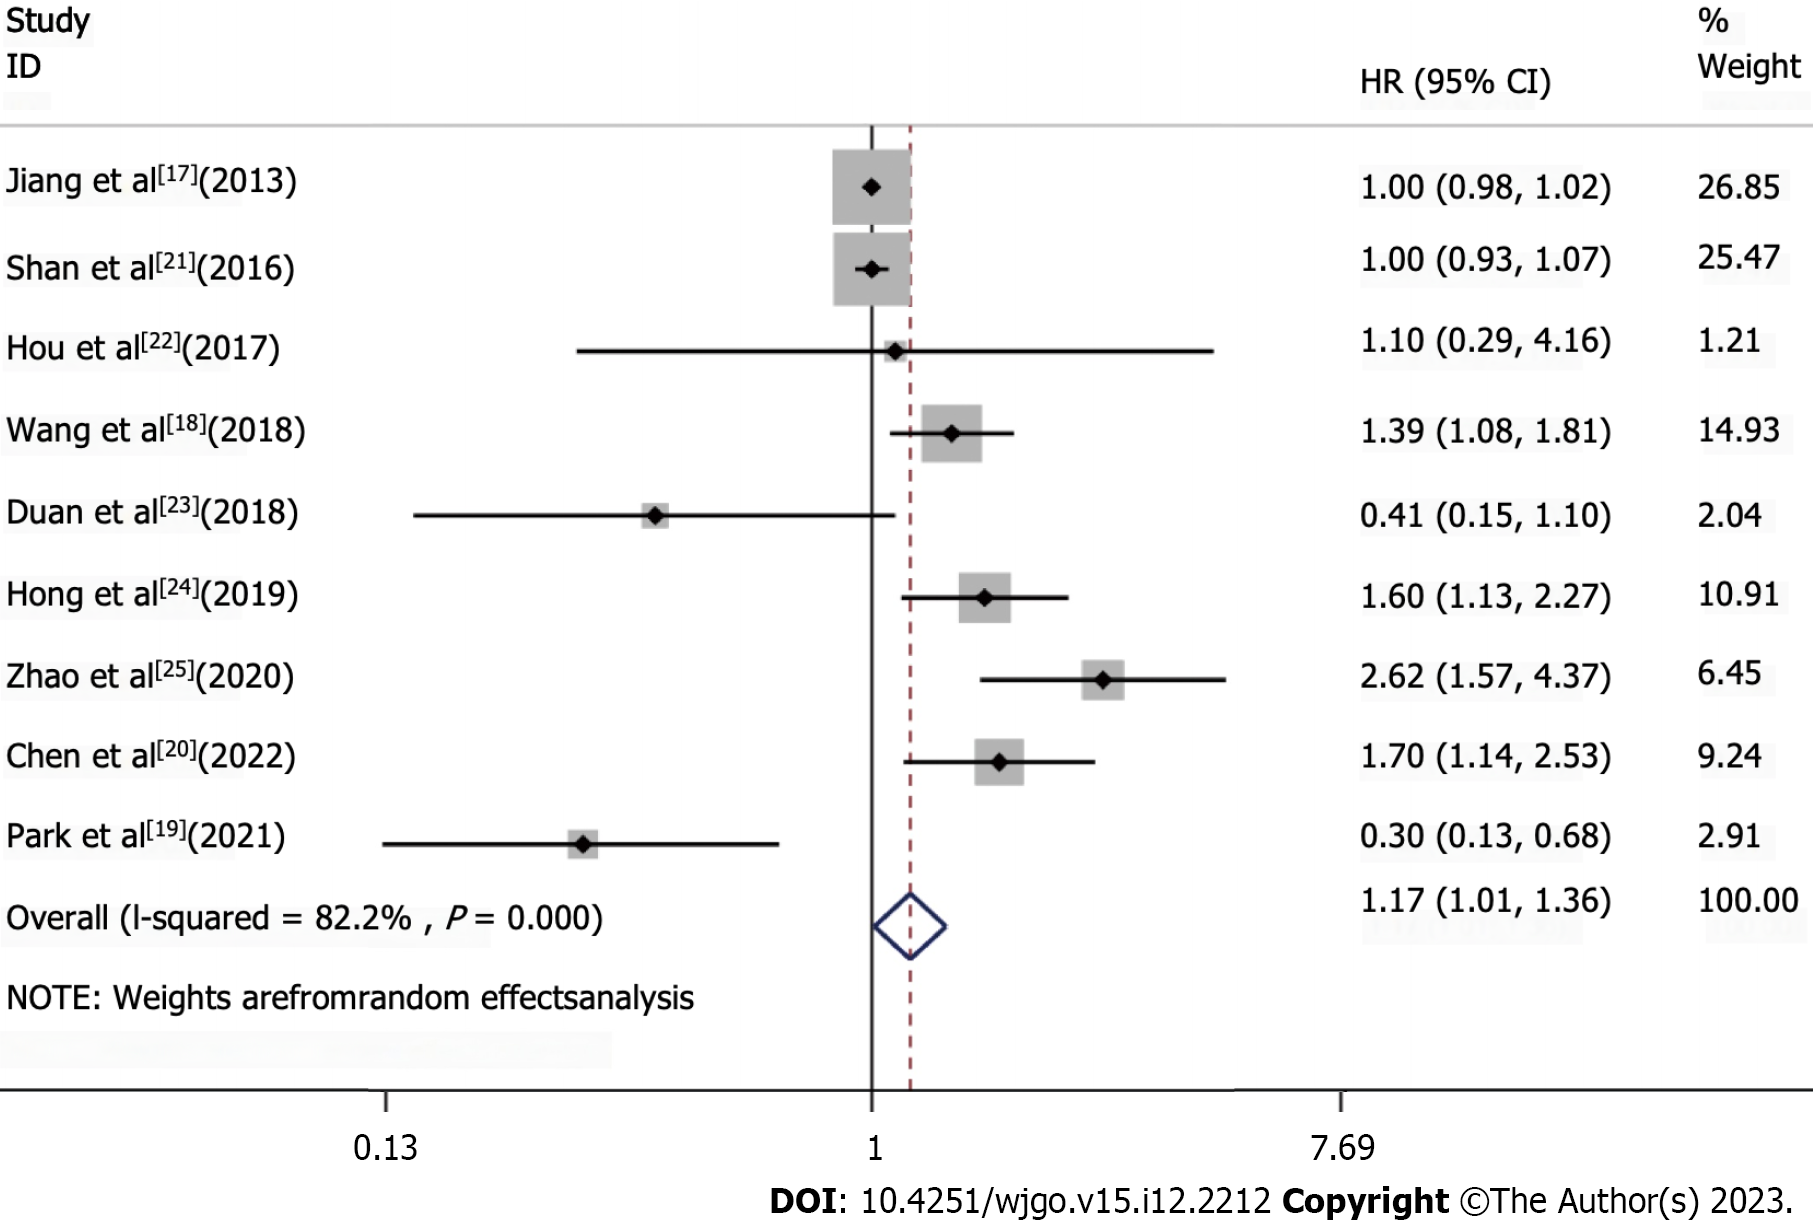
Figure 2 Meta-analysis of the association between T cell immunoglobulin and mucin-domain containing-3 expression and overall survival.
Hazard ratio forest plot for the association between the T cell immunoglobulin and mucin-domain containing-3 expression and overall survival in upper gastrointestinal tract tumors.
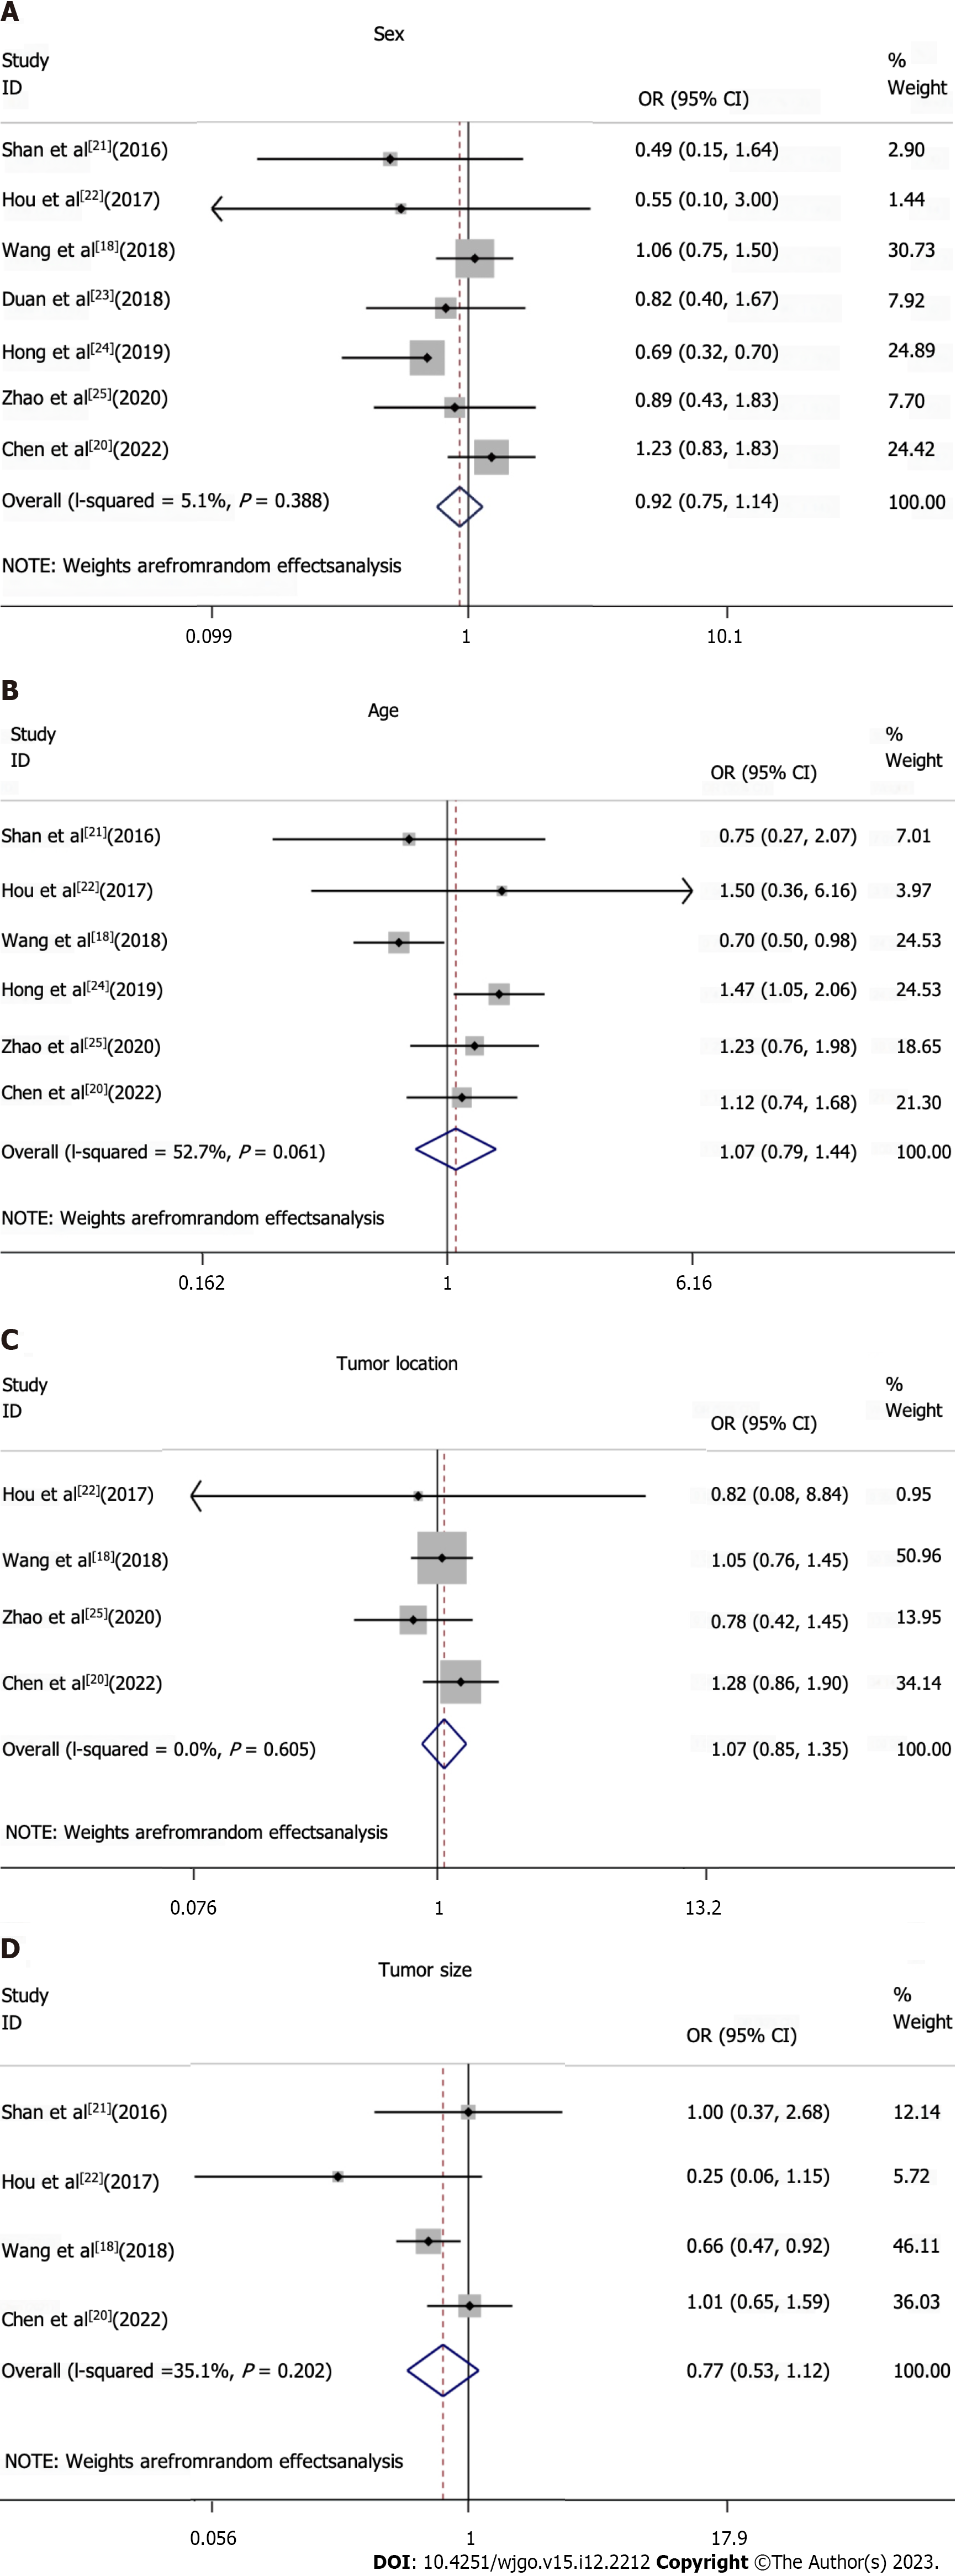
Figure 3 Association between T cell immunoglobulin and mucin-domain containing-3 expression and clinicopathological characteristics was analyzed.
Forest plots with Odds ratio (OR) and 95% confidence interval (CI) were drawn for the association of T cell immunoglobulin and mucin-domain containing-3 expression with clinicopathological characteristics. A: Sex; B: Age; C: Tumor location; D: Tumor size.
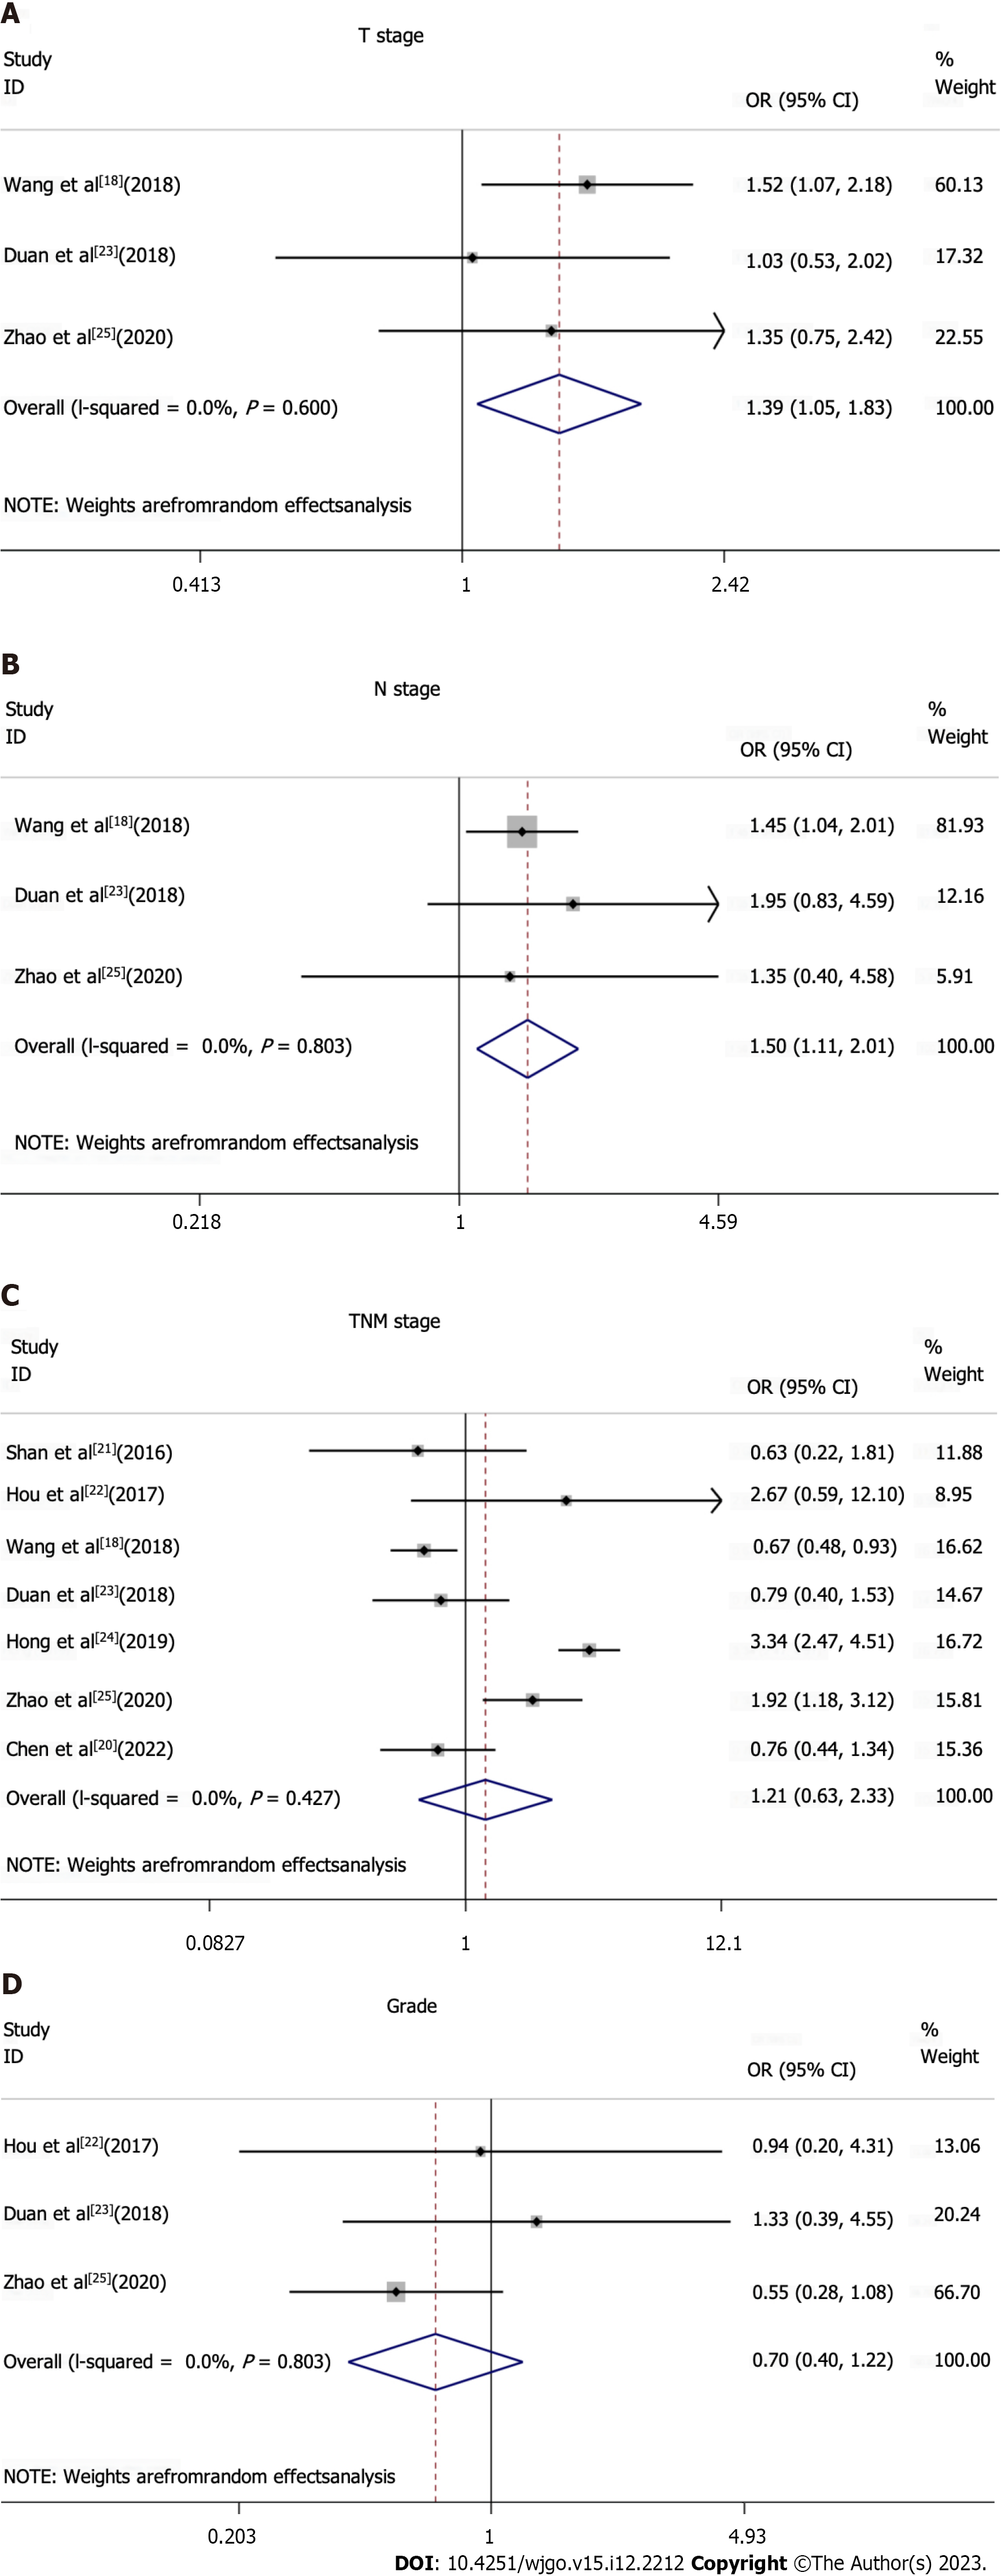
Figure 4 Association between T cell immunoglobulin and mucin-domain containing-3 expression and clinicopathological characteristics was analyzed.
Forest plots of odds ratio (OR) and 95% confidence interval (CI) were performed for correlation between T cell immunoglobulin and mucin-domain containing-3 expression and Tumor staging and grade of tissue differentiation. A: T stage; B: N stage; C: TNM stage; D: Grade of tissue differentiation.
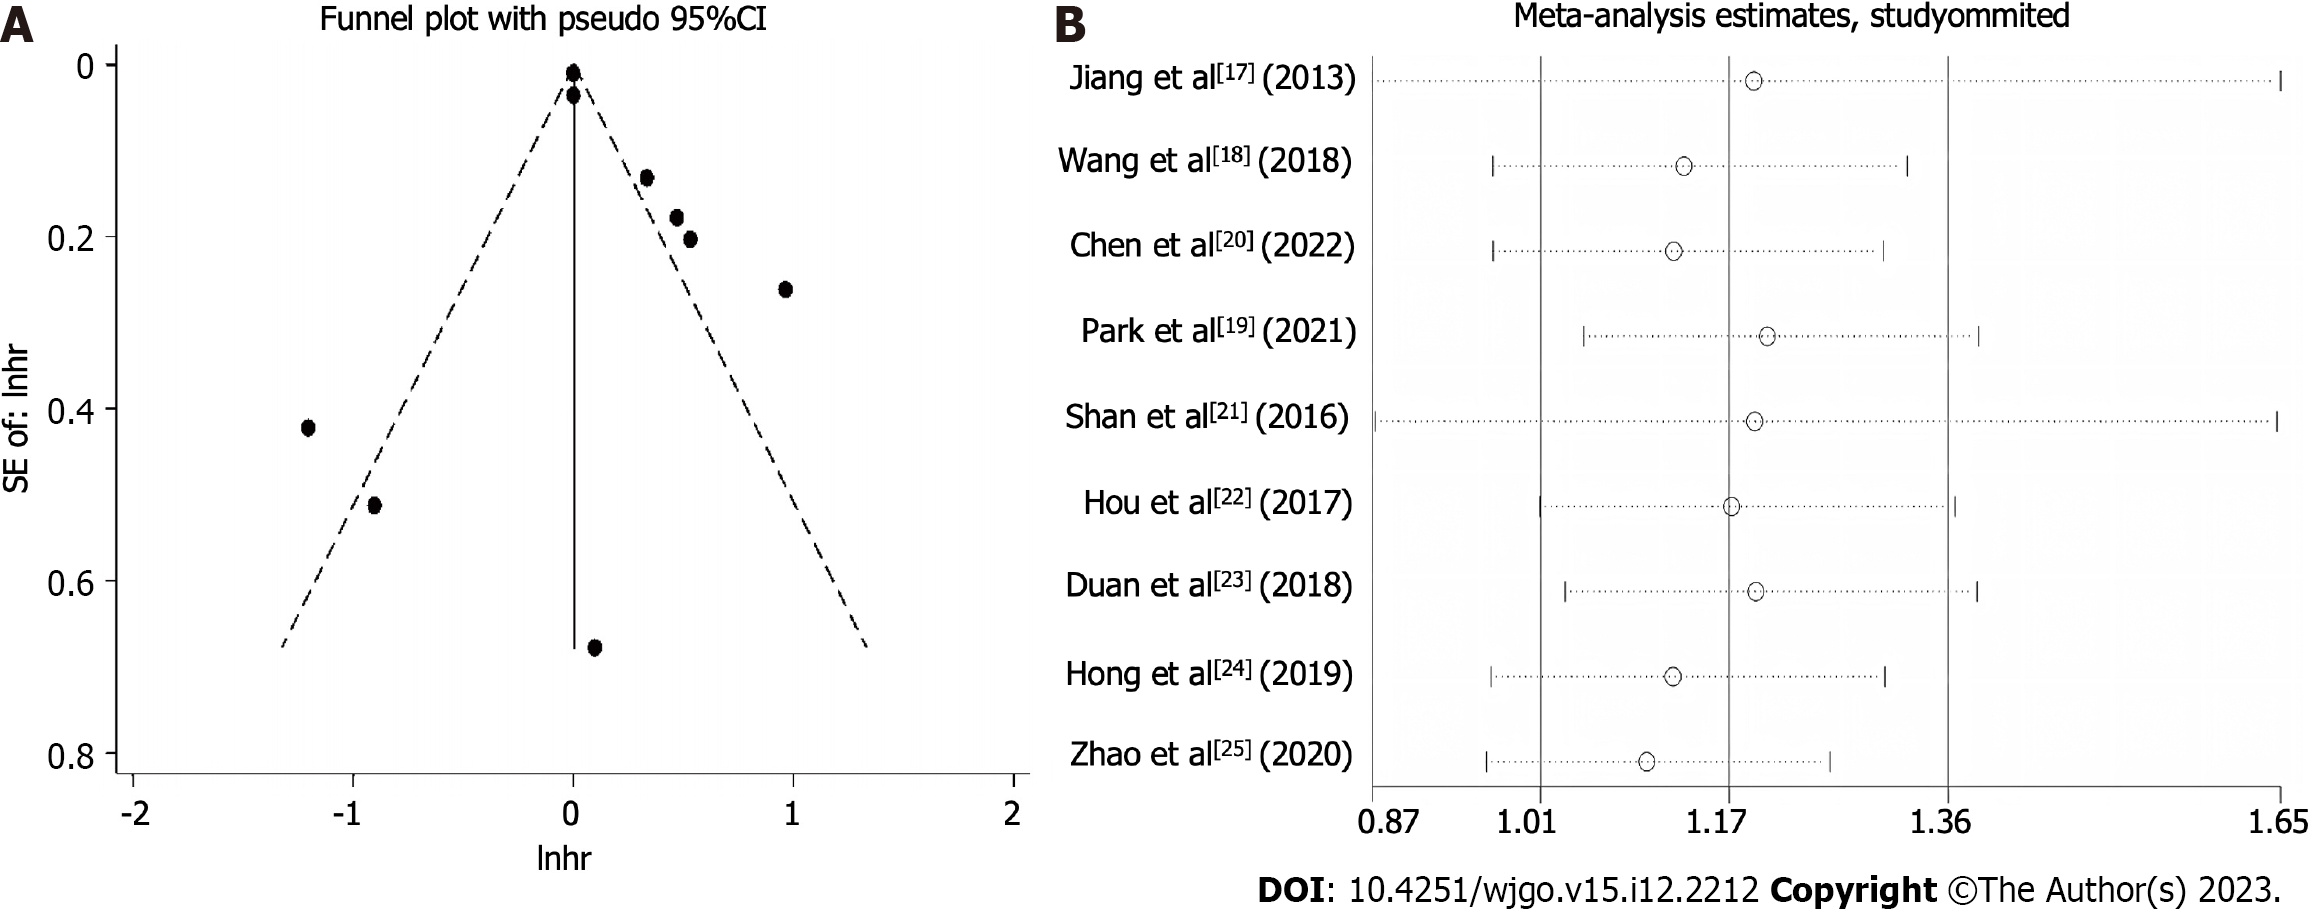
Figure 5 Assessment of publication bias and sensitivity analysis.
A: Funnel plot that assessed the effect of potential publication bias on the meta-analysis results; B: Sensitivity analysis that evaluated the impact of omitting individual studies on the pooled effect size estimate to determine the association between the T cell immunoglobulin and mucin-domain containing-3 expression and prognosis in upper gastrointestinal tumors. HR: Hazard ratio.
- Citation: Yan JJ, Liu BB, Yang Y, Liu MR, Wang H, Deng ZQ, Zhang ZW. Prognostic value of T cell immunoglobulin and mucin-domain containing-3 expression in upper gastrointestinal tract tumors: A meta-analysis. World J Gastrointest Oncol 2023; 15(12): 2212-2224
- URL: https://www.wjgnet.com/1948-5204/full/v15/i12/2212.htm
- DOI: https://dx.doi.org/10.4251/wjgo.v15.i12.2212


