Copyright
©The Author(s) 2023.
World J Gastrointest Oncol. Dec 15, 2023; 15(12): 2169-2184
Published online Dec 15, 2023. doi: 10.4251/wjgo.v15.i12.2169
Published online Dec 15, 2023. doi: 10.4251/wjgo.v15.i12.2169
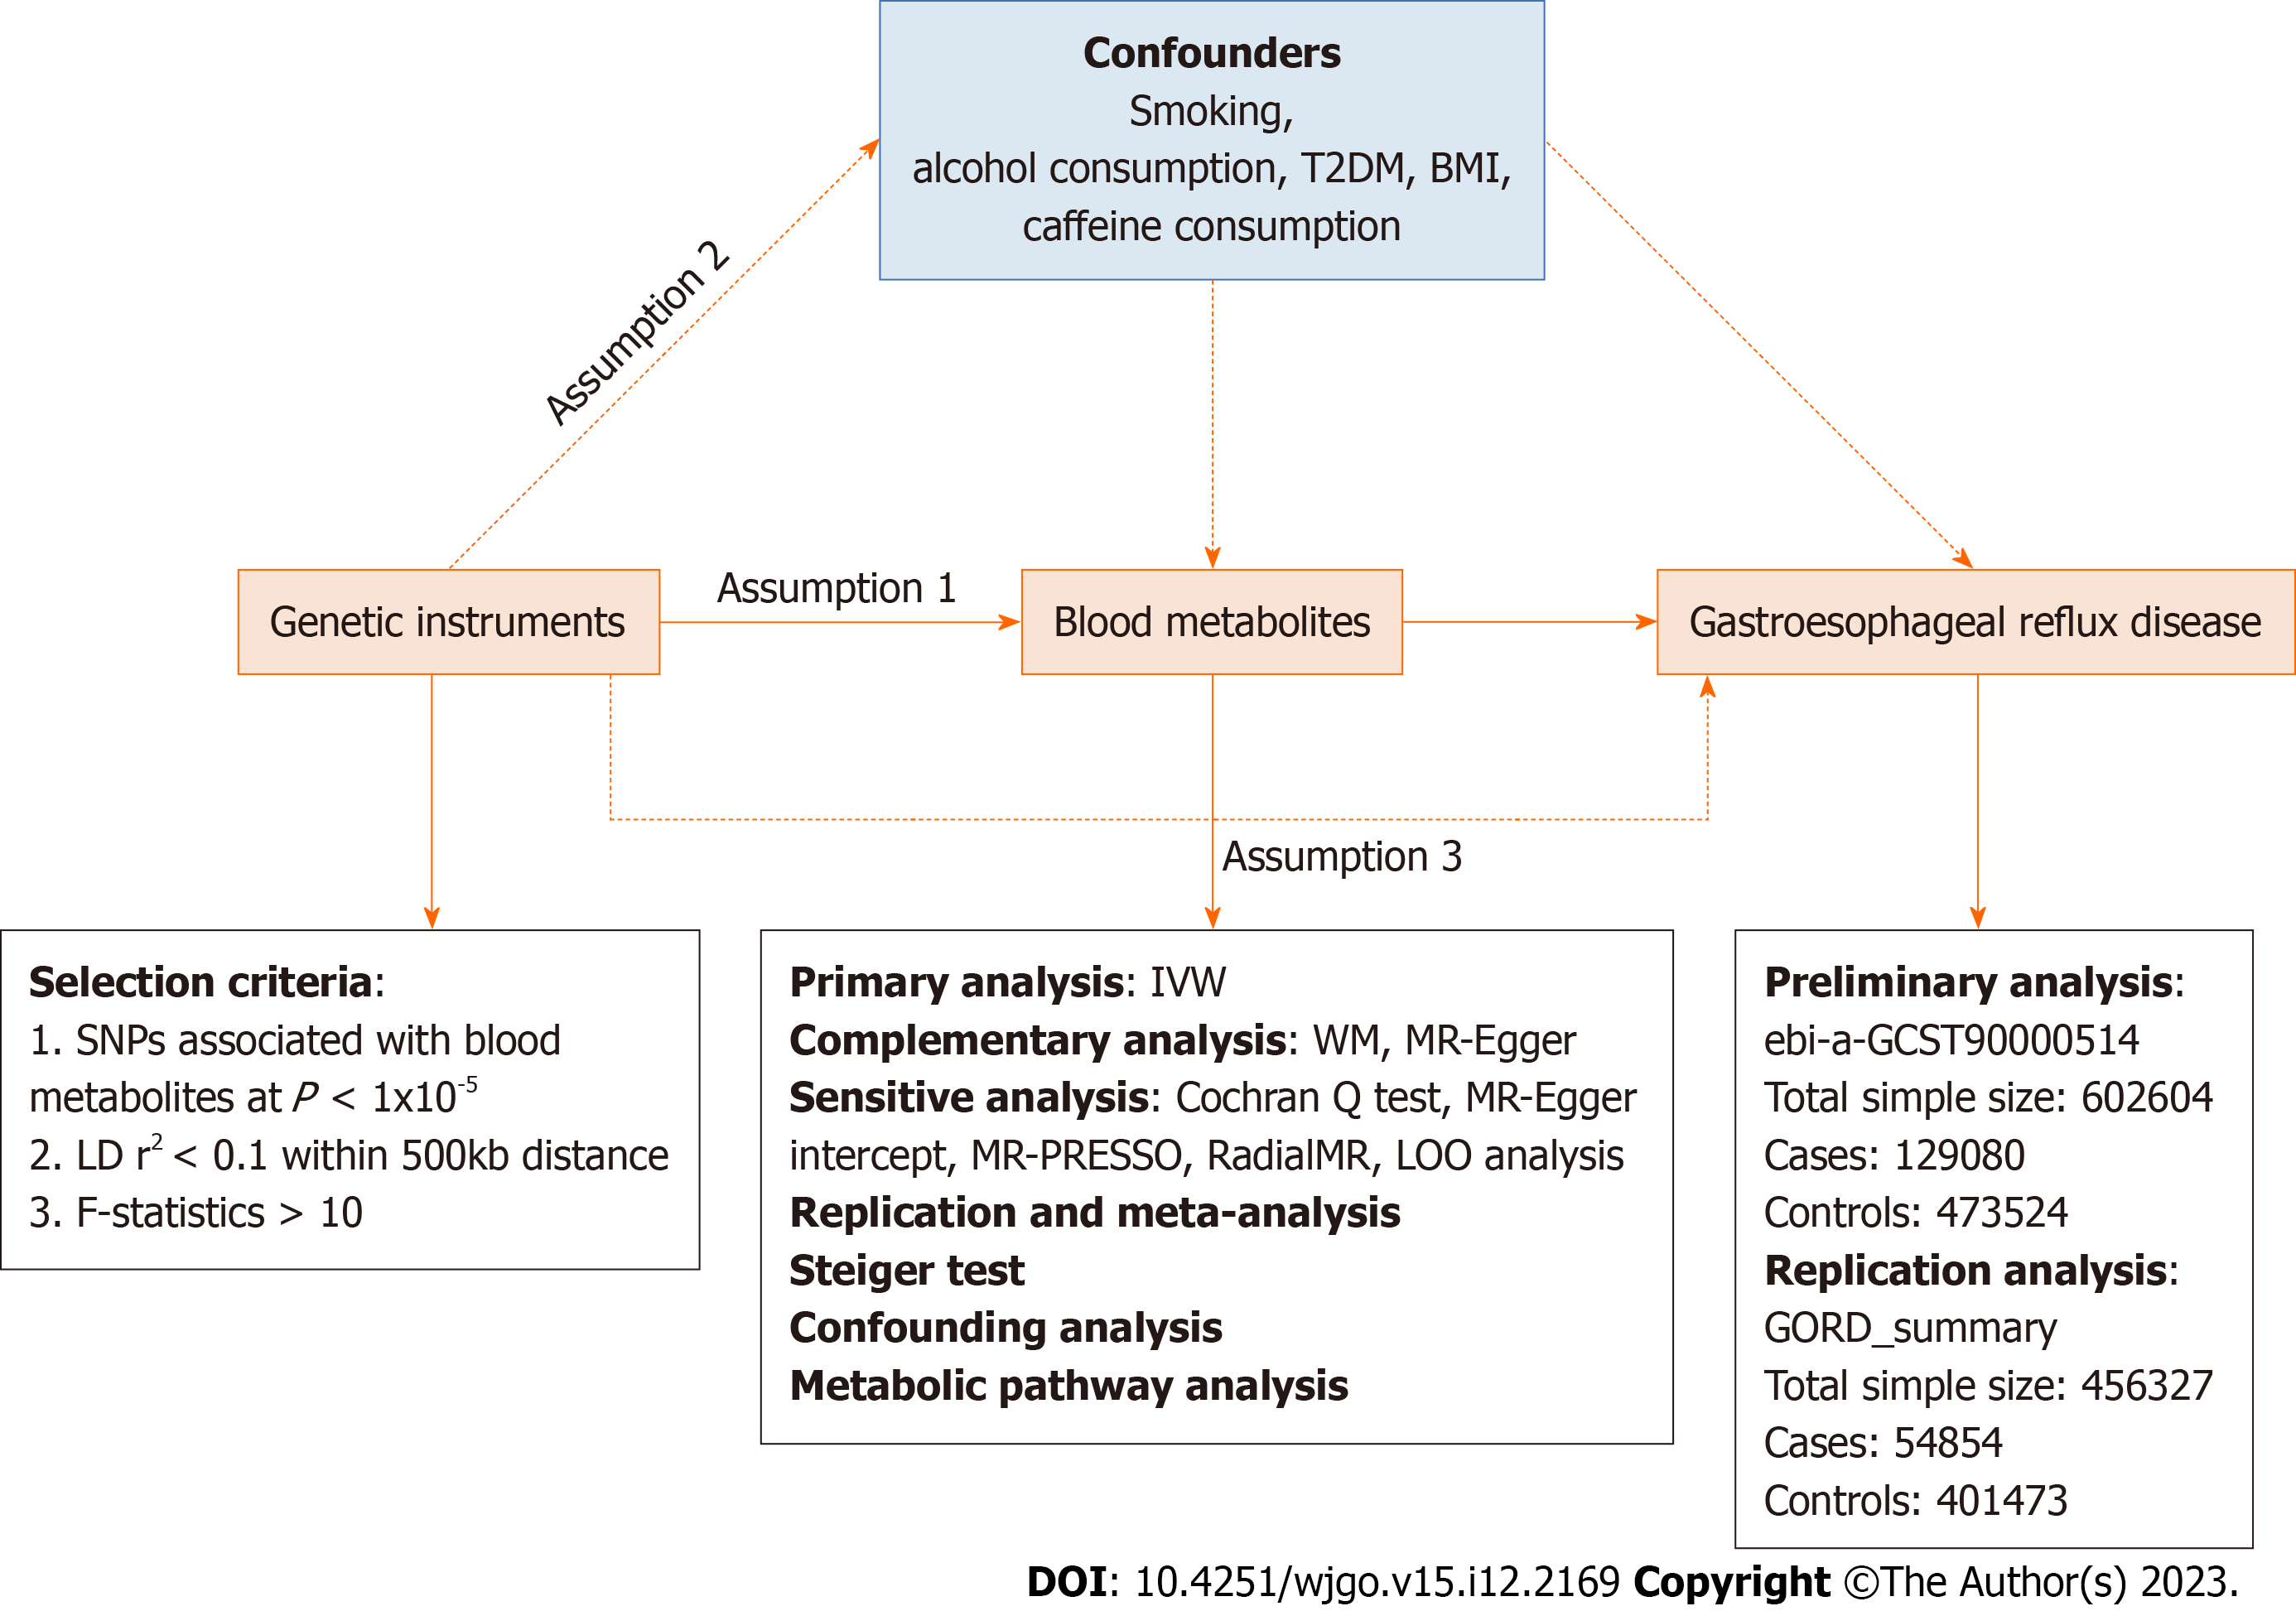
Figure 1 Overview of this Mendelian randomization analysis.
Assumption 1, genetic instruments are strongly associated with the exposures of interest; Assumption 2, genetic instruments are independent of confounding factors; Assumption 3, genetic instruments are not associated with outcome and affect outcome only via exposures. IVW: Inverse variance weighted; LD: Linkage disequilibrium; LOO analysis: Leave-one-out analysis; MR-PRESSO: MR-Pleiotropy RESidual sum and outlier; SNPs: Single nucleotide polymorphisms; WM: Weighted median; BMI: Body mass index; T2DM: Type 2 diabetes mellitus.
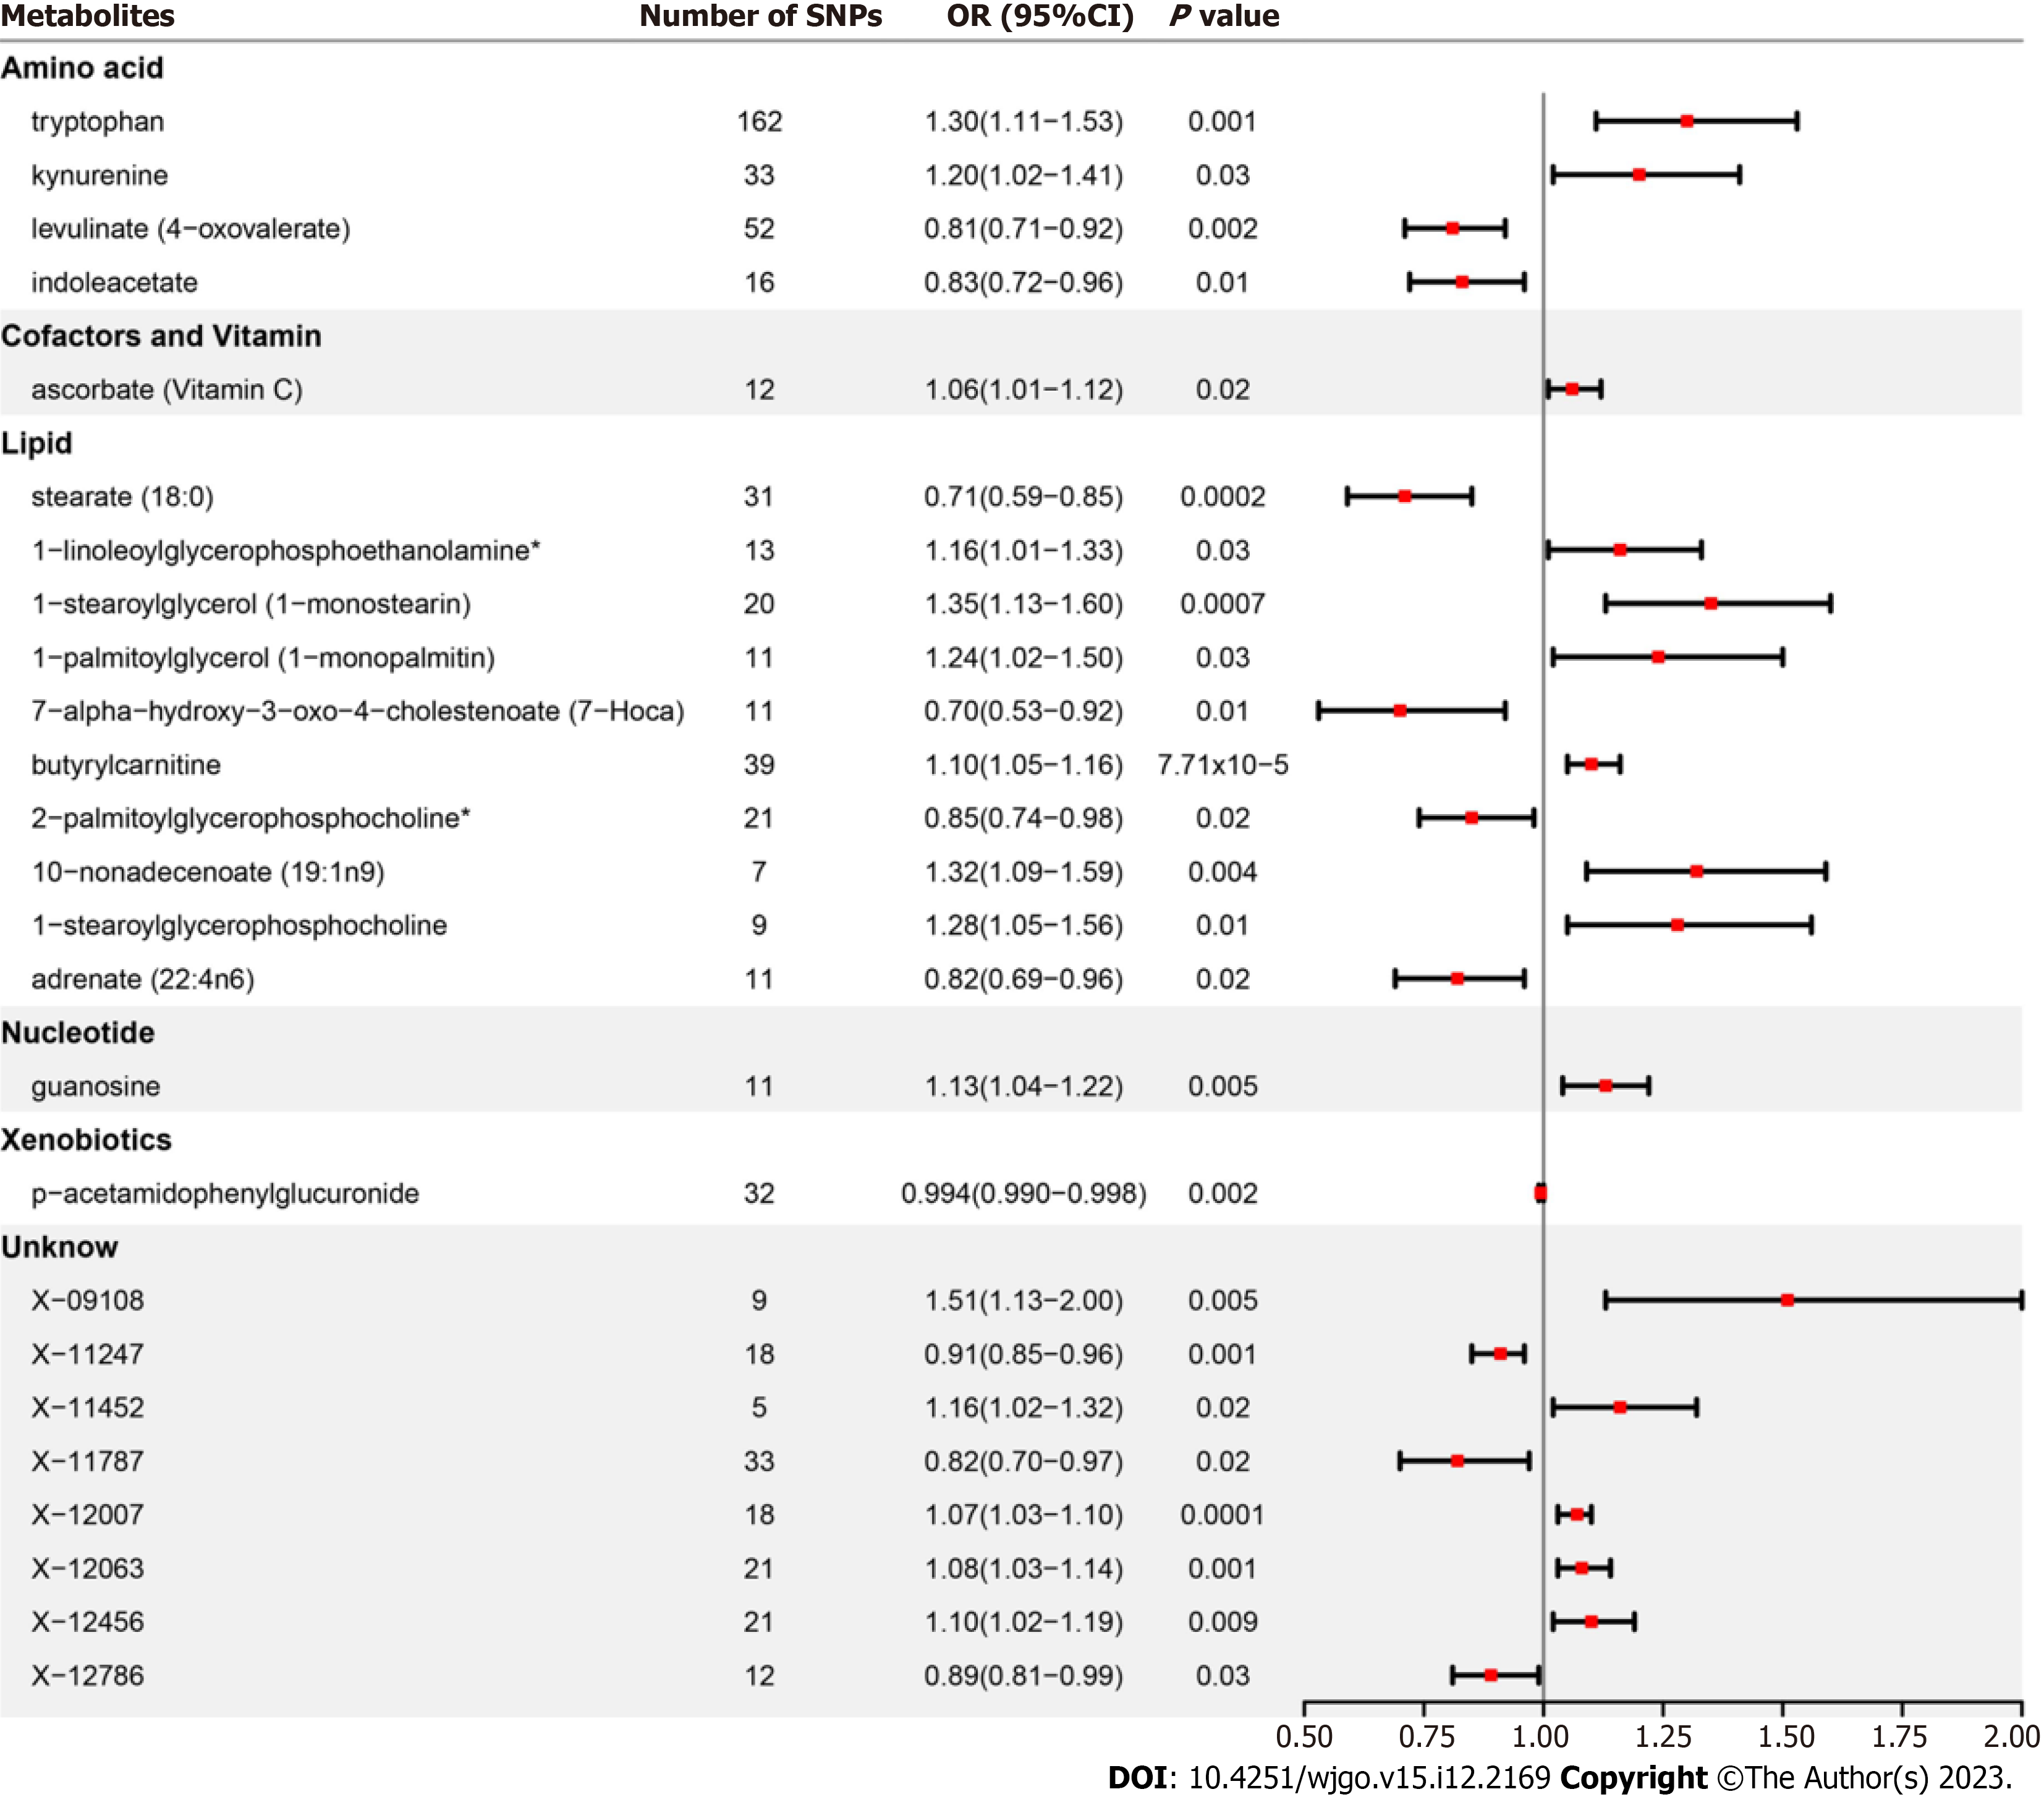
Figure 2 Forest plot for the causality of blood metabolites on gastroesophageal reflux disease derived from inverse variance weighted analysis.
CI: Confidence interval; OR: Odd ratio.
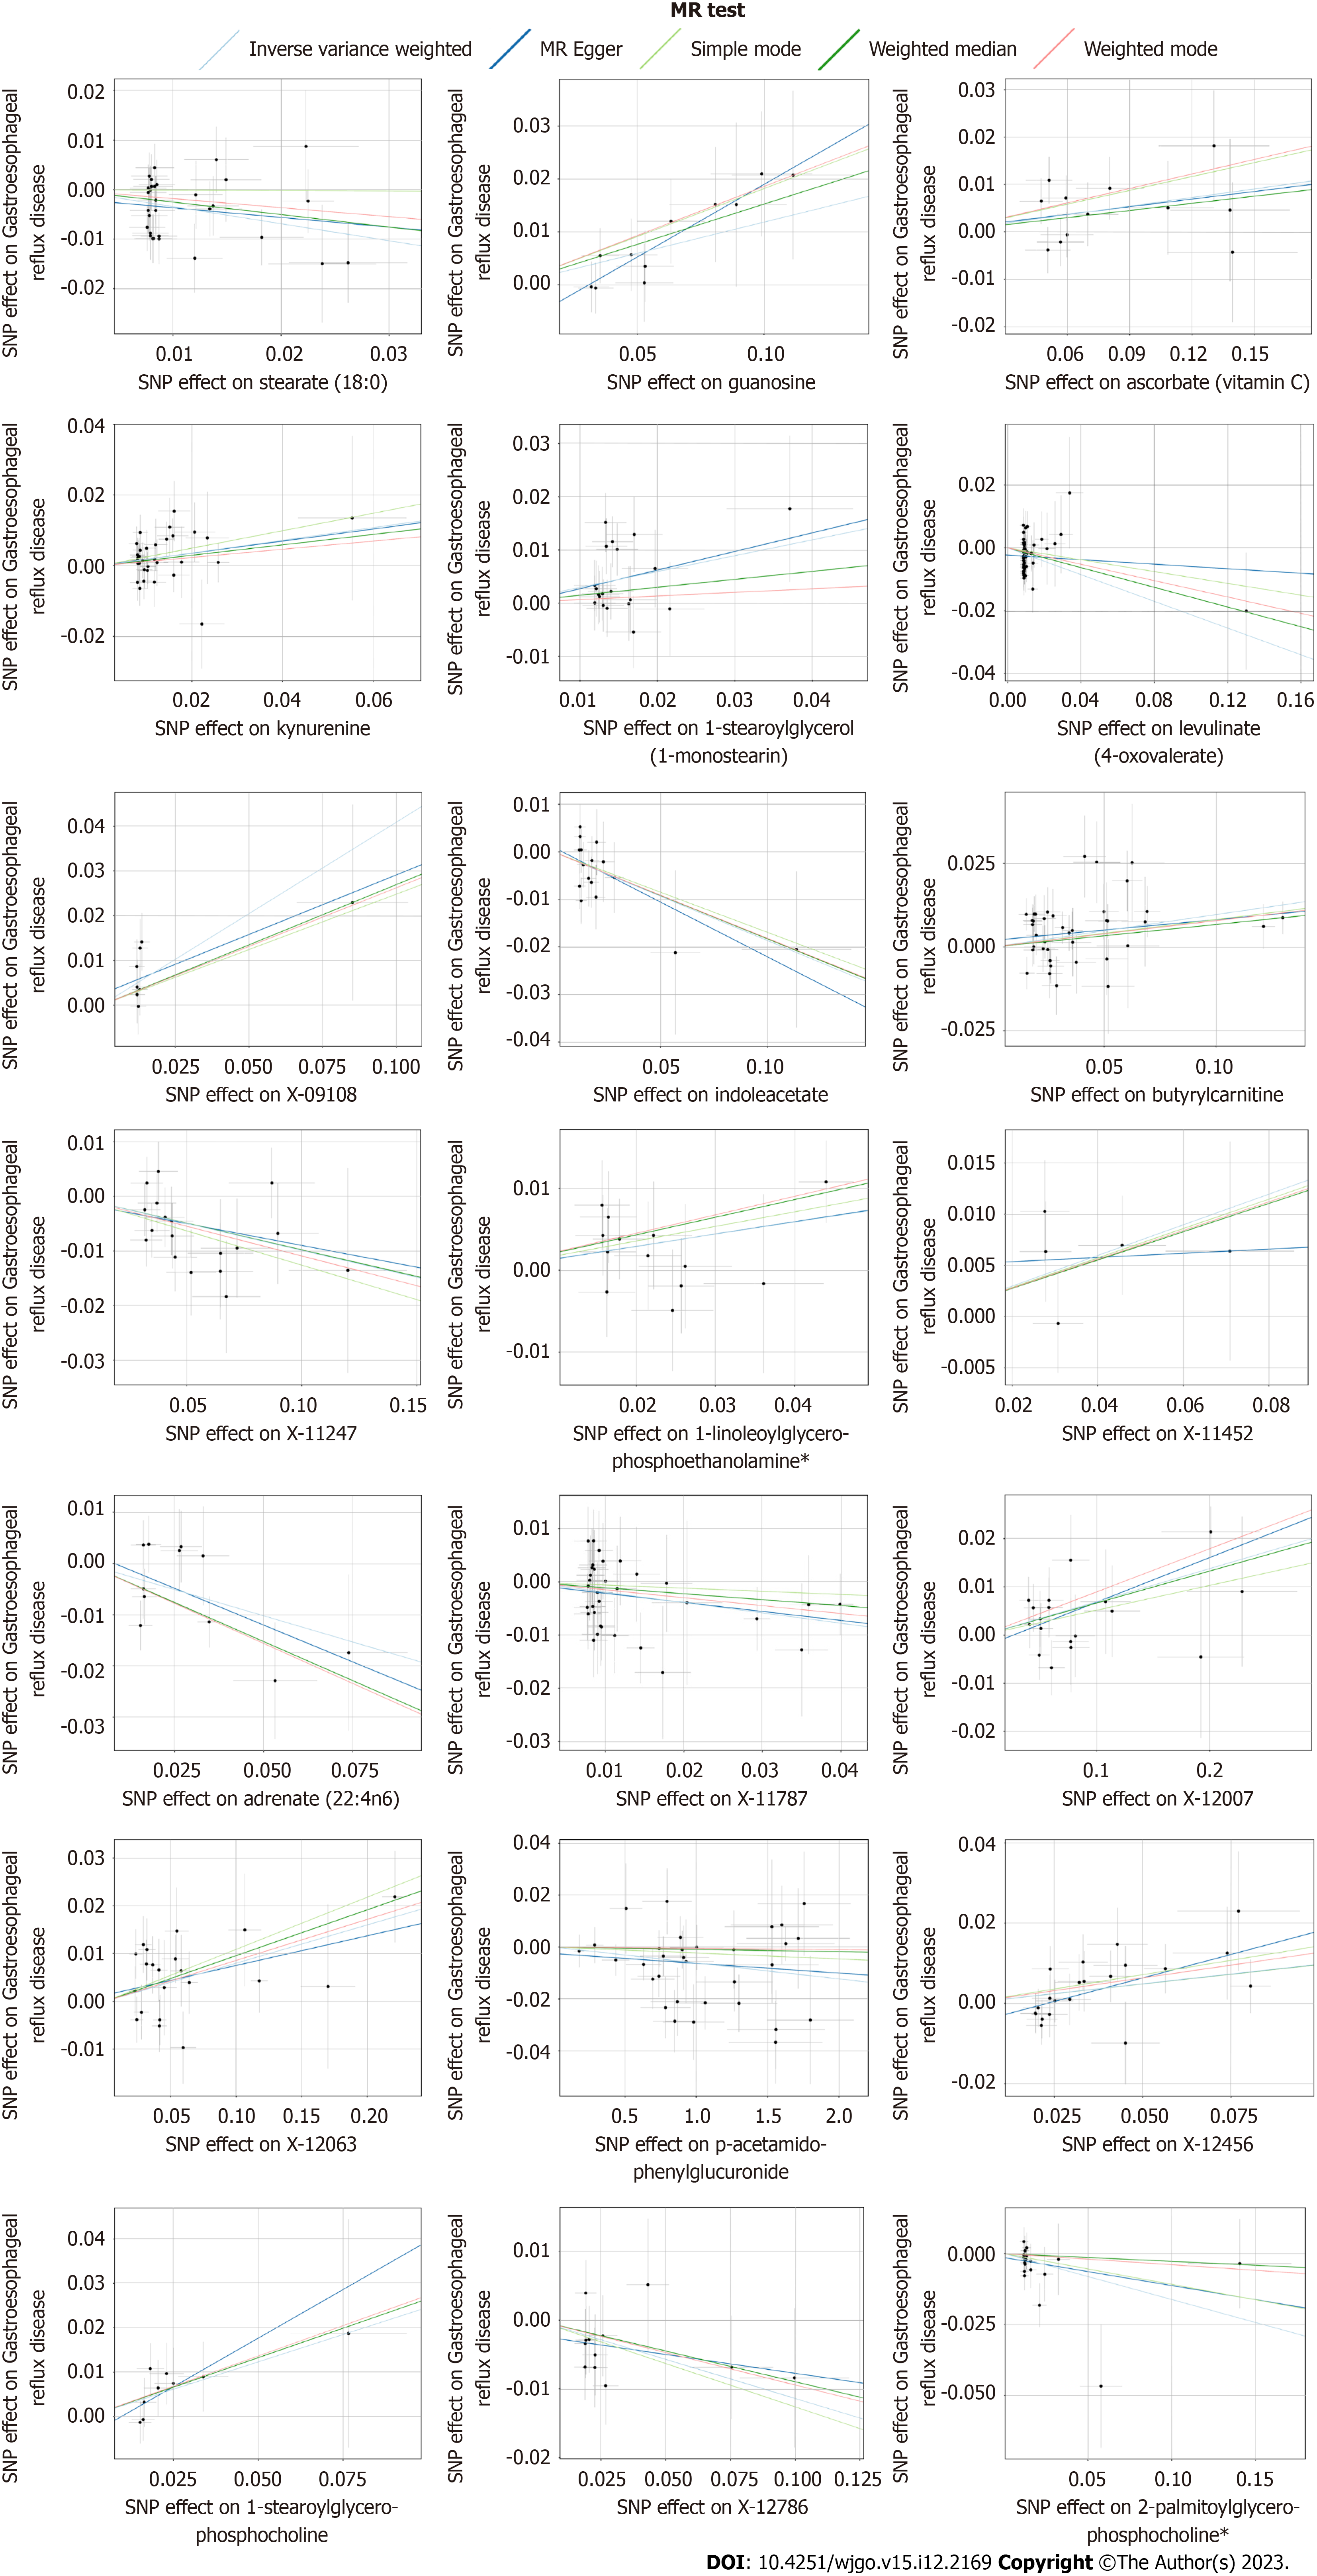
Figure 3 Scatterplot of significantly associated (inverse variance weighted derived P < 0.
05) and directionally consistent estimates. SNP: Single nucleotide polymorphisms.
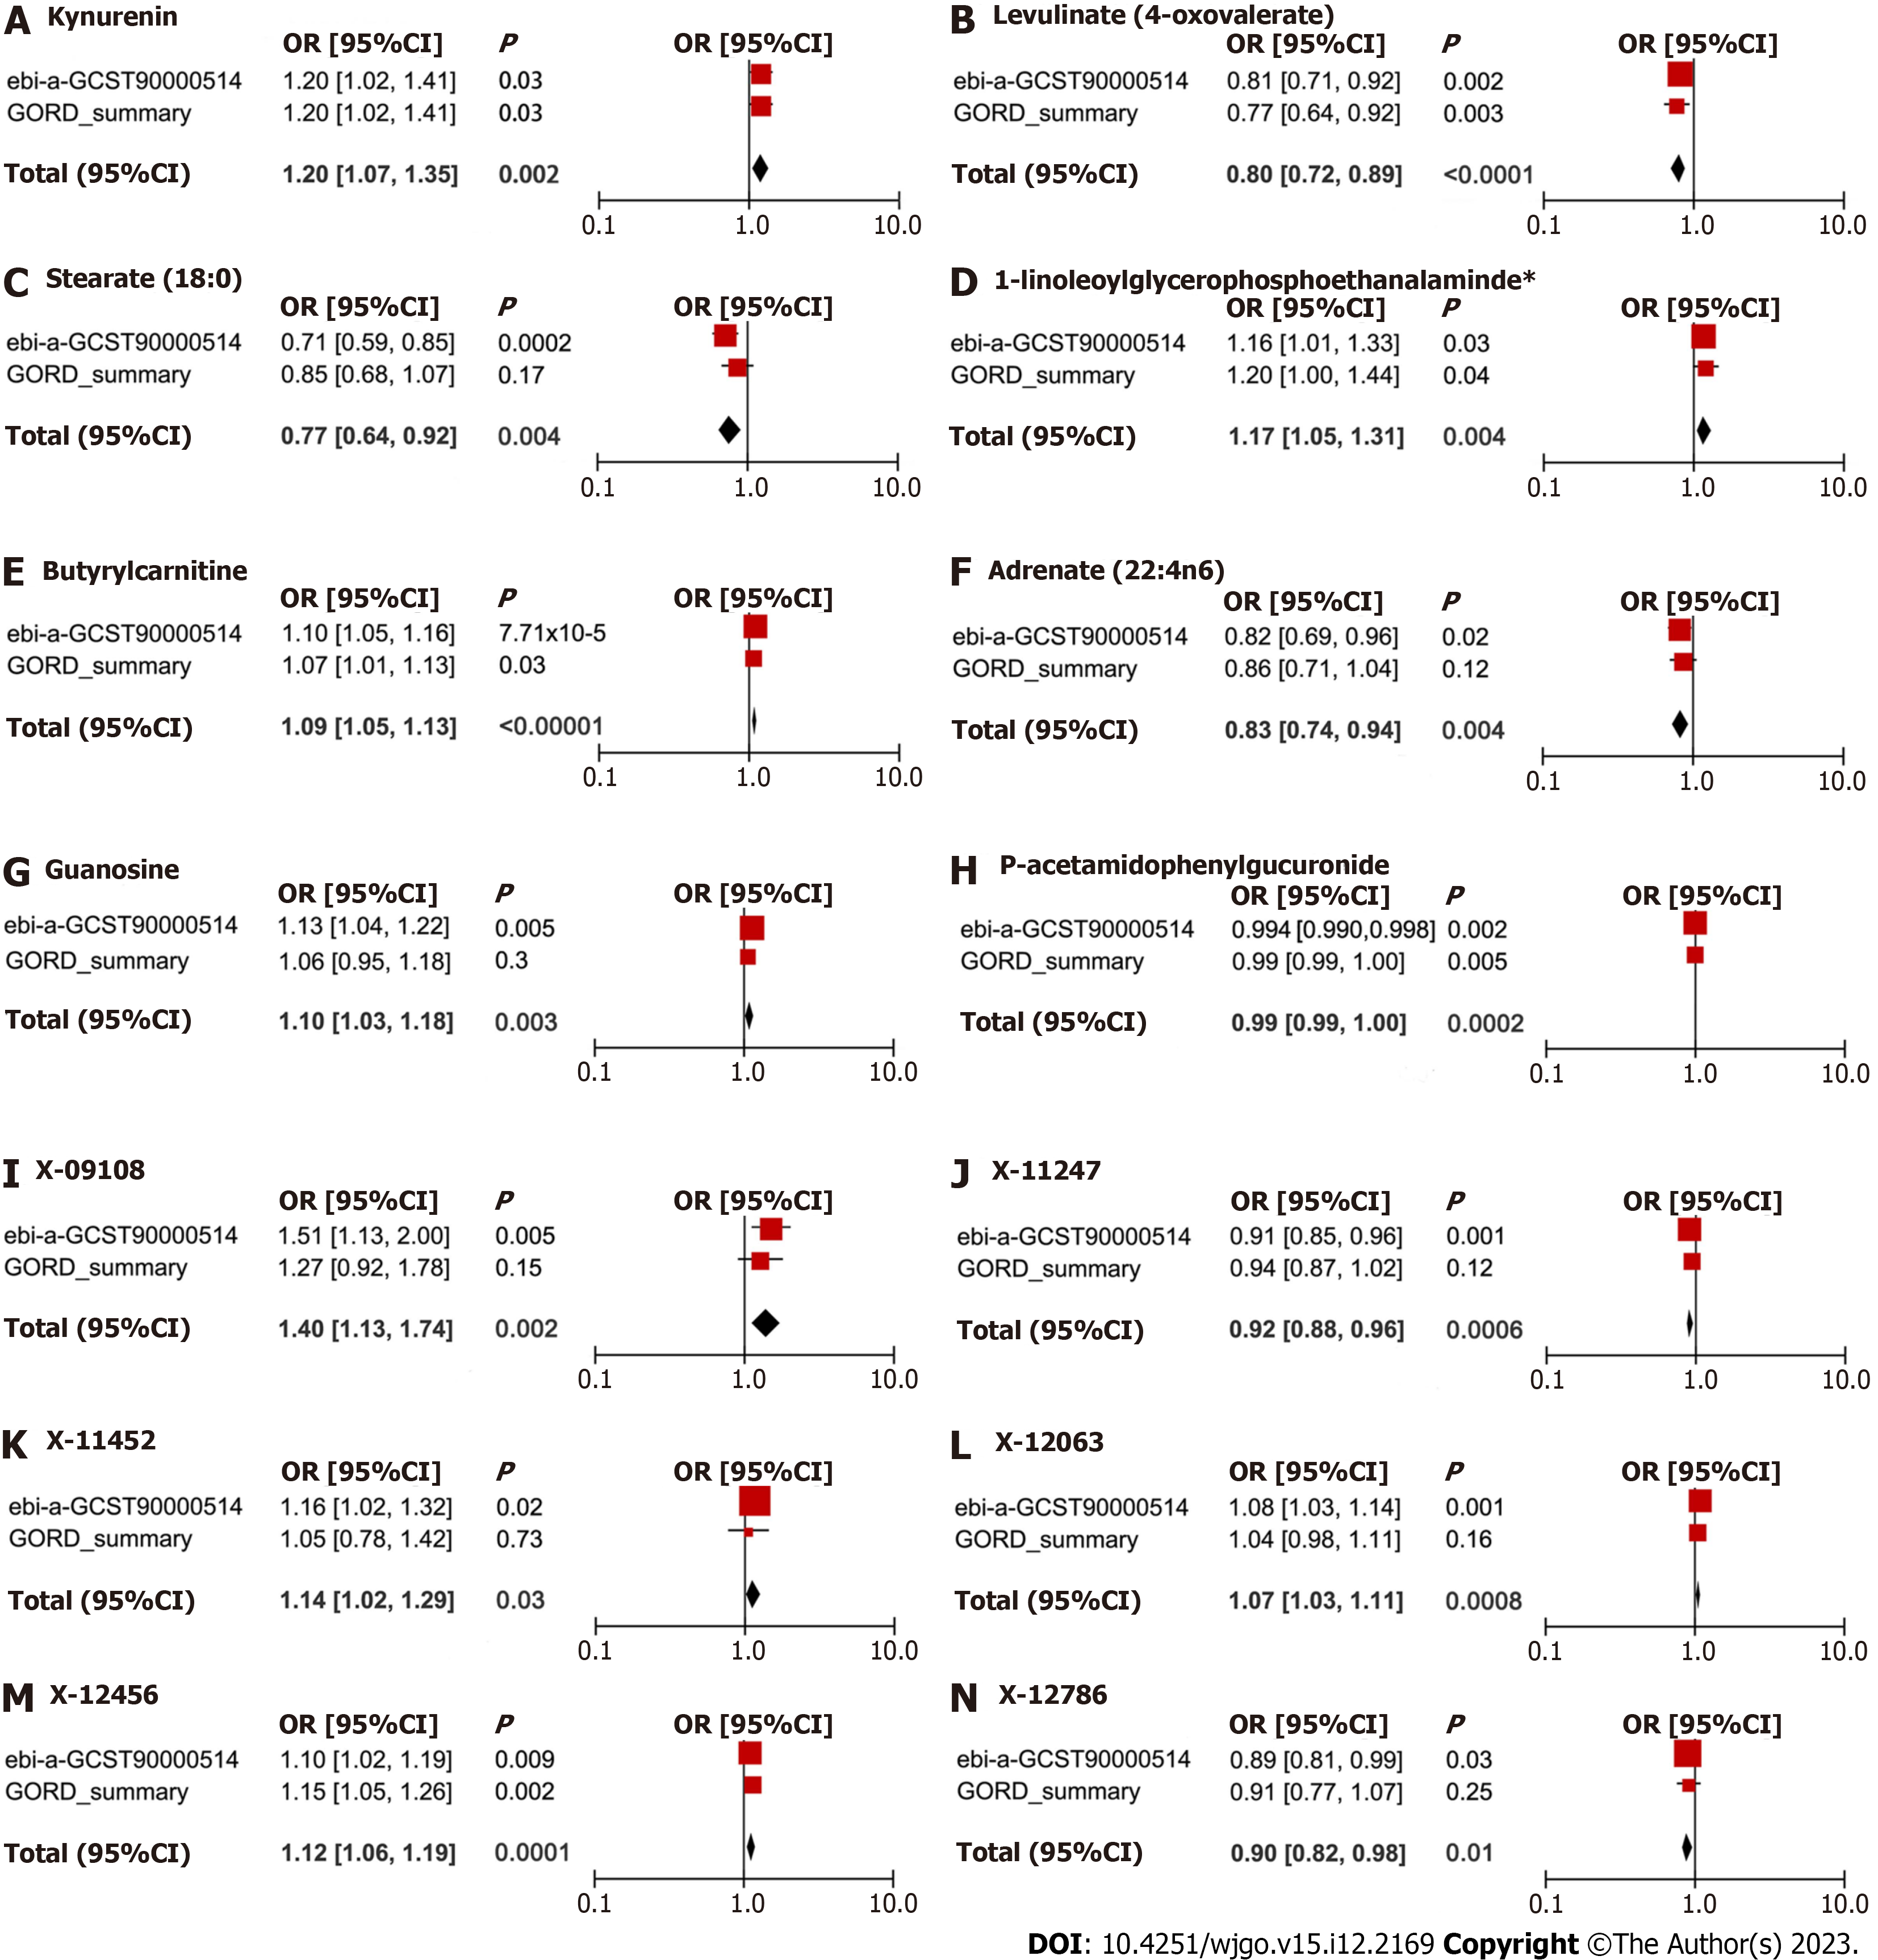
Figure 4 Meta-analysis of significantly associated (inverse variance weighted derived P < 0.
05) between metabolites and gastro
- Citation: Hu JY, Lv M, Zhang KL, Qiao XY, Wang YX, Wang FY. Evaluating the causal relationship between human blood metabolites and gastroesophageal reflux disease. World J Gastrointest Oncol 2023; 15(12): 2169-2184
- URL: https://www.wjgnet.com/1948-5204/full/v15/i12/2169.htm
- DOI: https://dx.doi.org/10.4251/wjgo.v15.i12.2169


