Copyright
©The Author(s) 2023.
World J Gastrointest Oncol. Dec 15, 2023; 15(12): 2138-2149
Published online Dec 15, 2023. doi: 10.4251/wjgo.v15.i12.2138
Published online Dec 15, 2023. doi: 10.4251/wjgo.v15.i12.2138
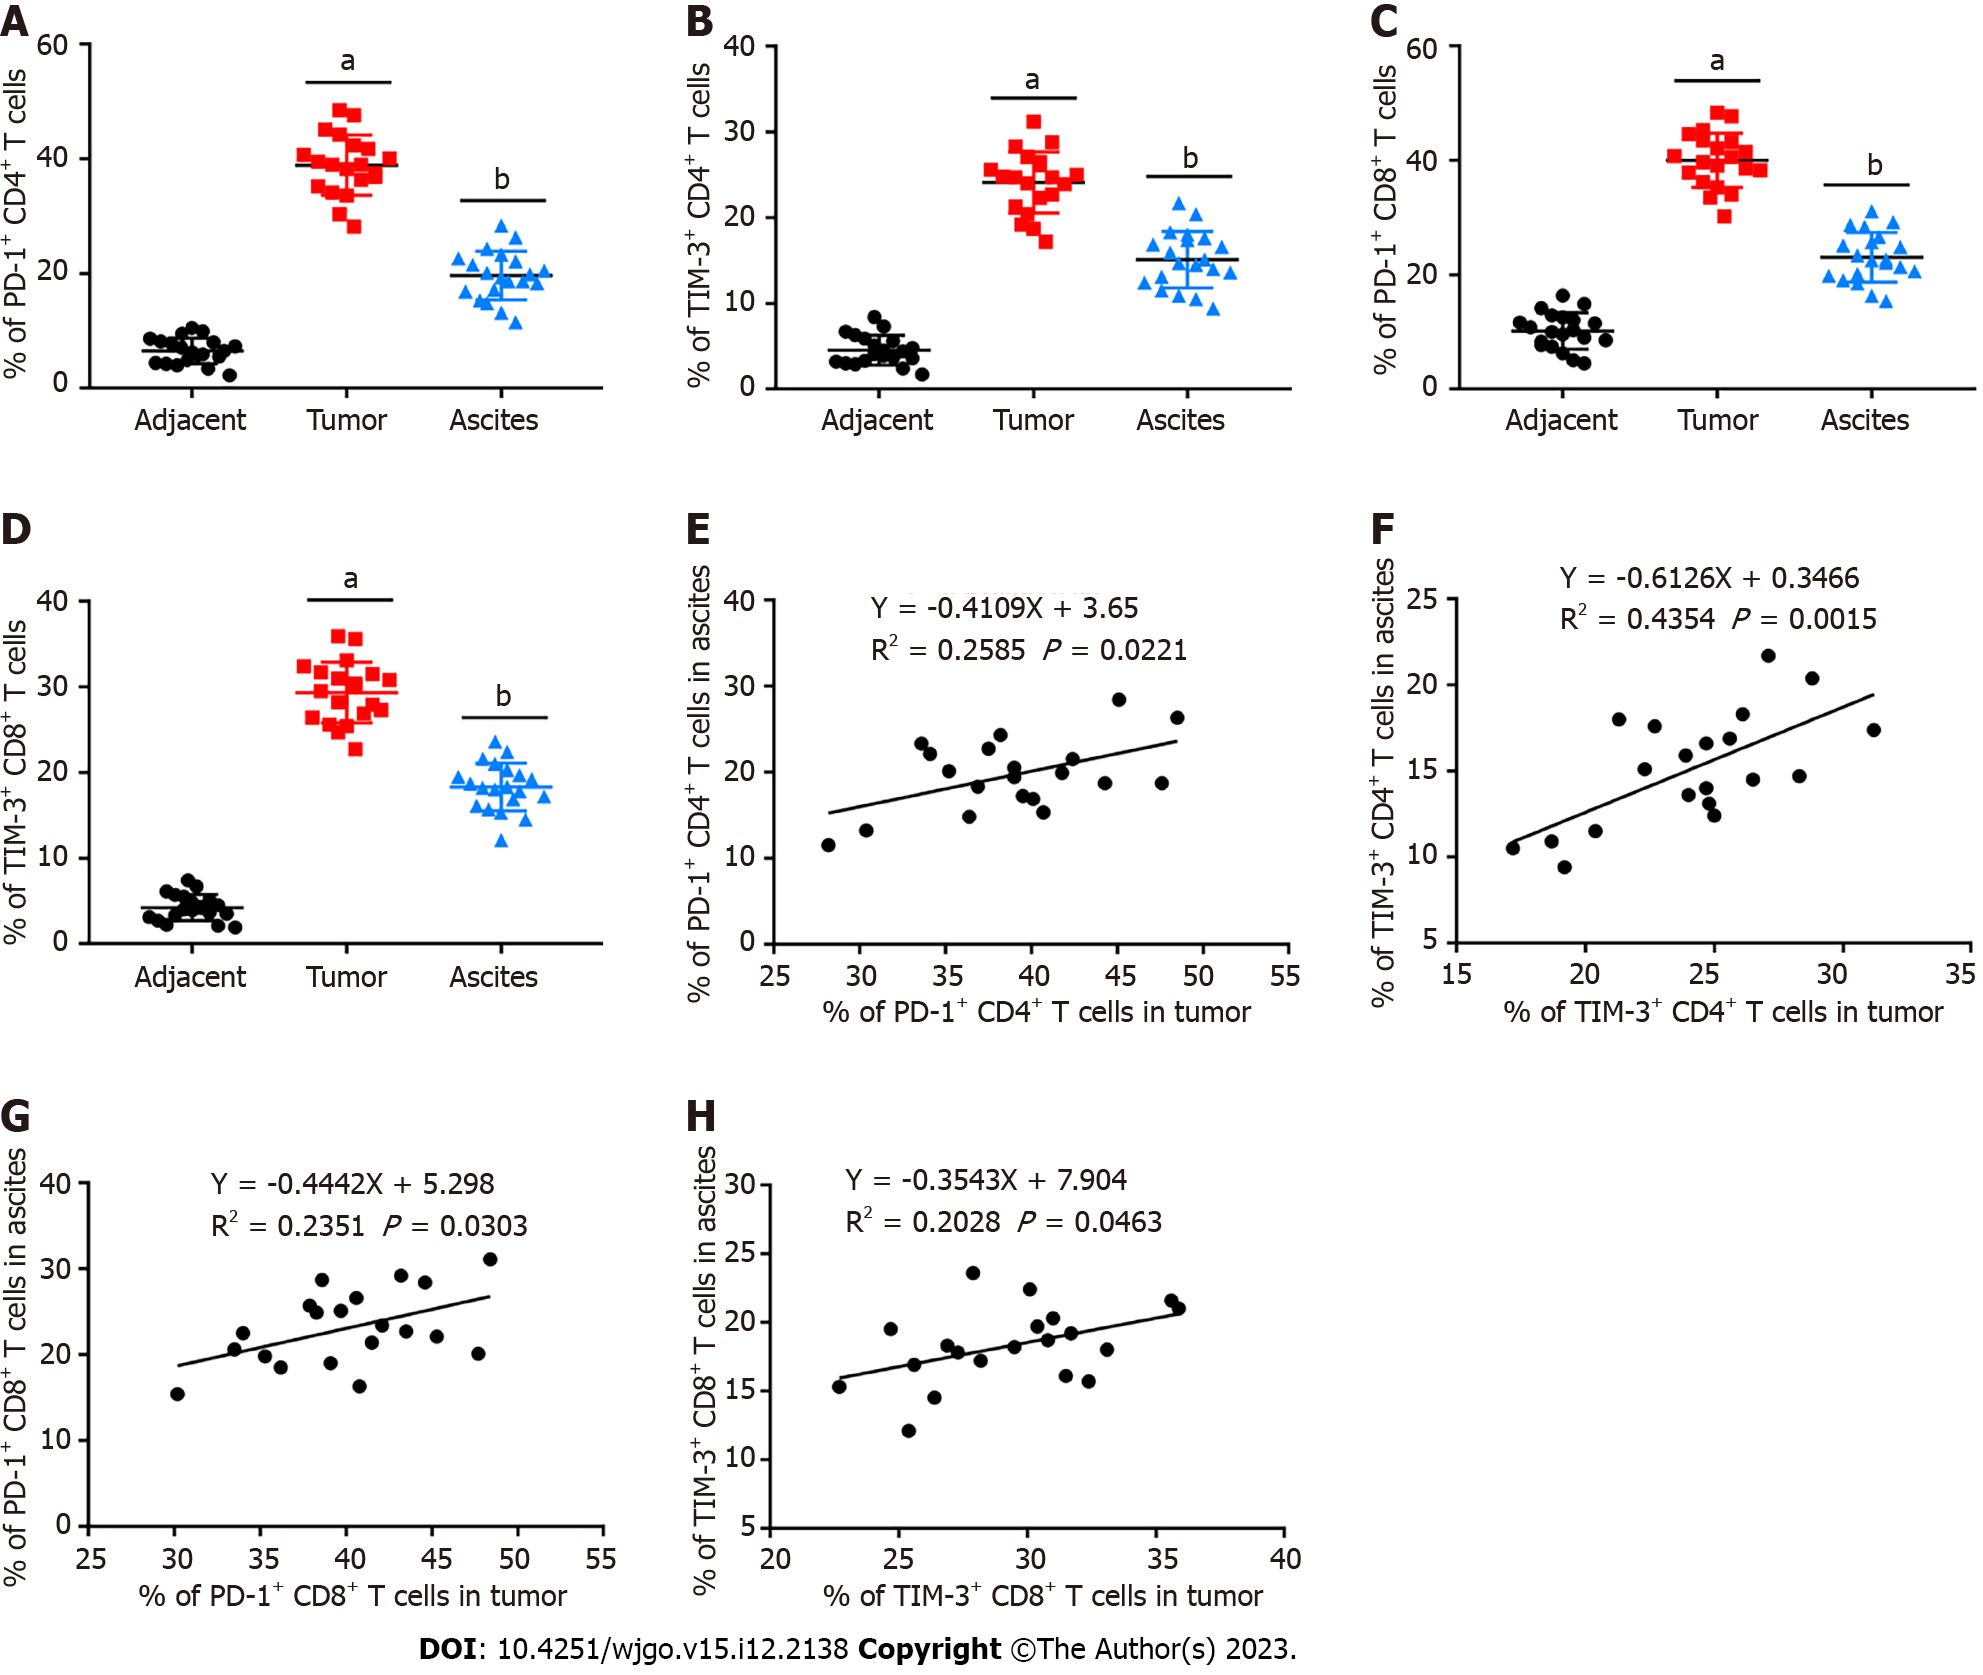
Figure 1 Programmed cell death protein 1 and T cell immunoglobulin and mucin domain-containing protein 3 were upregulated in CD4+ and CD8+ T cells isolated from hepatocellular carcinoma patients.
Mononuclear cells were isolated from tumor tissues, ascites, and matched adjacent tissues of hepatocellular carcinoma (HCC) patients. A and B: Programmed cell death protein 1 (PD-1) (A) and T cell immunoglobulin and mucin domain-containing protein 3 (TIM-3) (B) expression on CD4+ T cells in tumor tissues, ascites, and matched adjacent tissues of HCC patients (n = 20) was assessed with flow cytometry; C and D: PD-1 (C) and TIM-3 (D) expression on CD8+ T cells in tumor tissues, ascites, and matched adjacent tissues of HCC patients (n = 20) was assessed with flow cytometry; E and F: PD-1 expression on CD4+ (E) cells and CD8+ (F) T cells in tumor tissues was positively correlated with that in ascites; G and H: TIM-3 expression on CD4+ cells and CD8+ T cells in tumor tissues was positively correlated with that in ascites. Data from at least three independent experiments were presented as mean ± SD. aP < 0.01, tumor group compared with the adjacent group; bP < 0.01, ascites group compared with the adjacent group. PD-1: Programmed cell death protein 1; TIM-3: T cell immunoglobulin and mucin domain-containing protein 3.
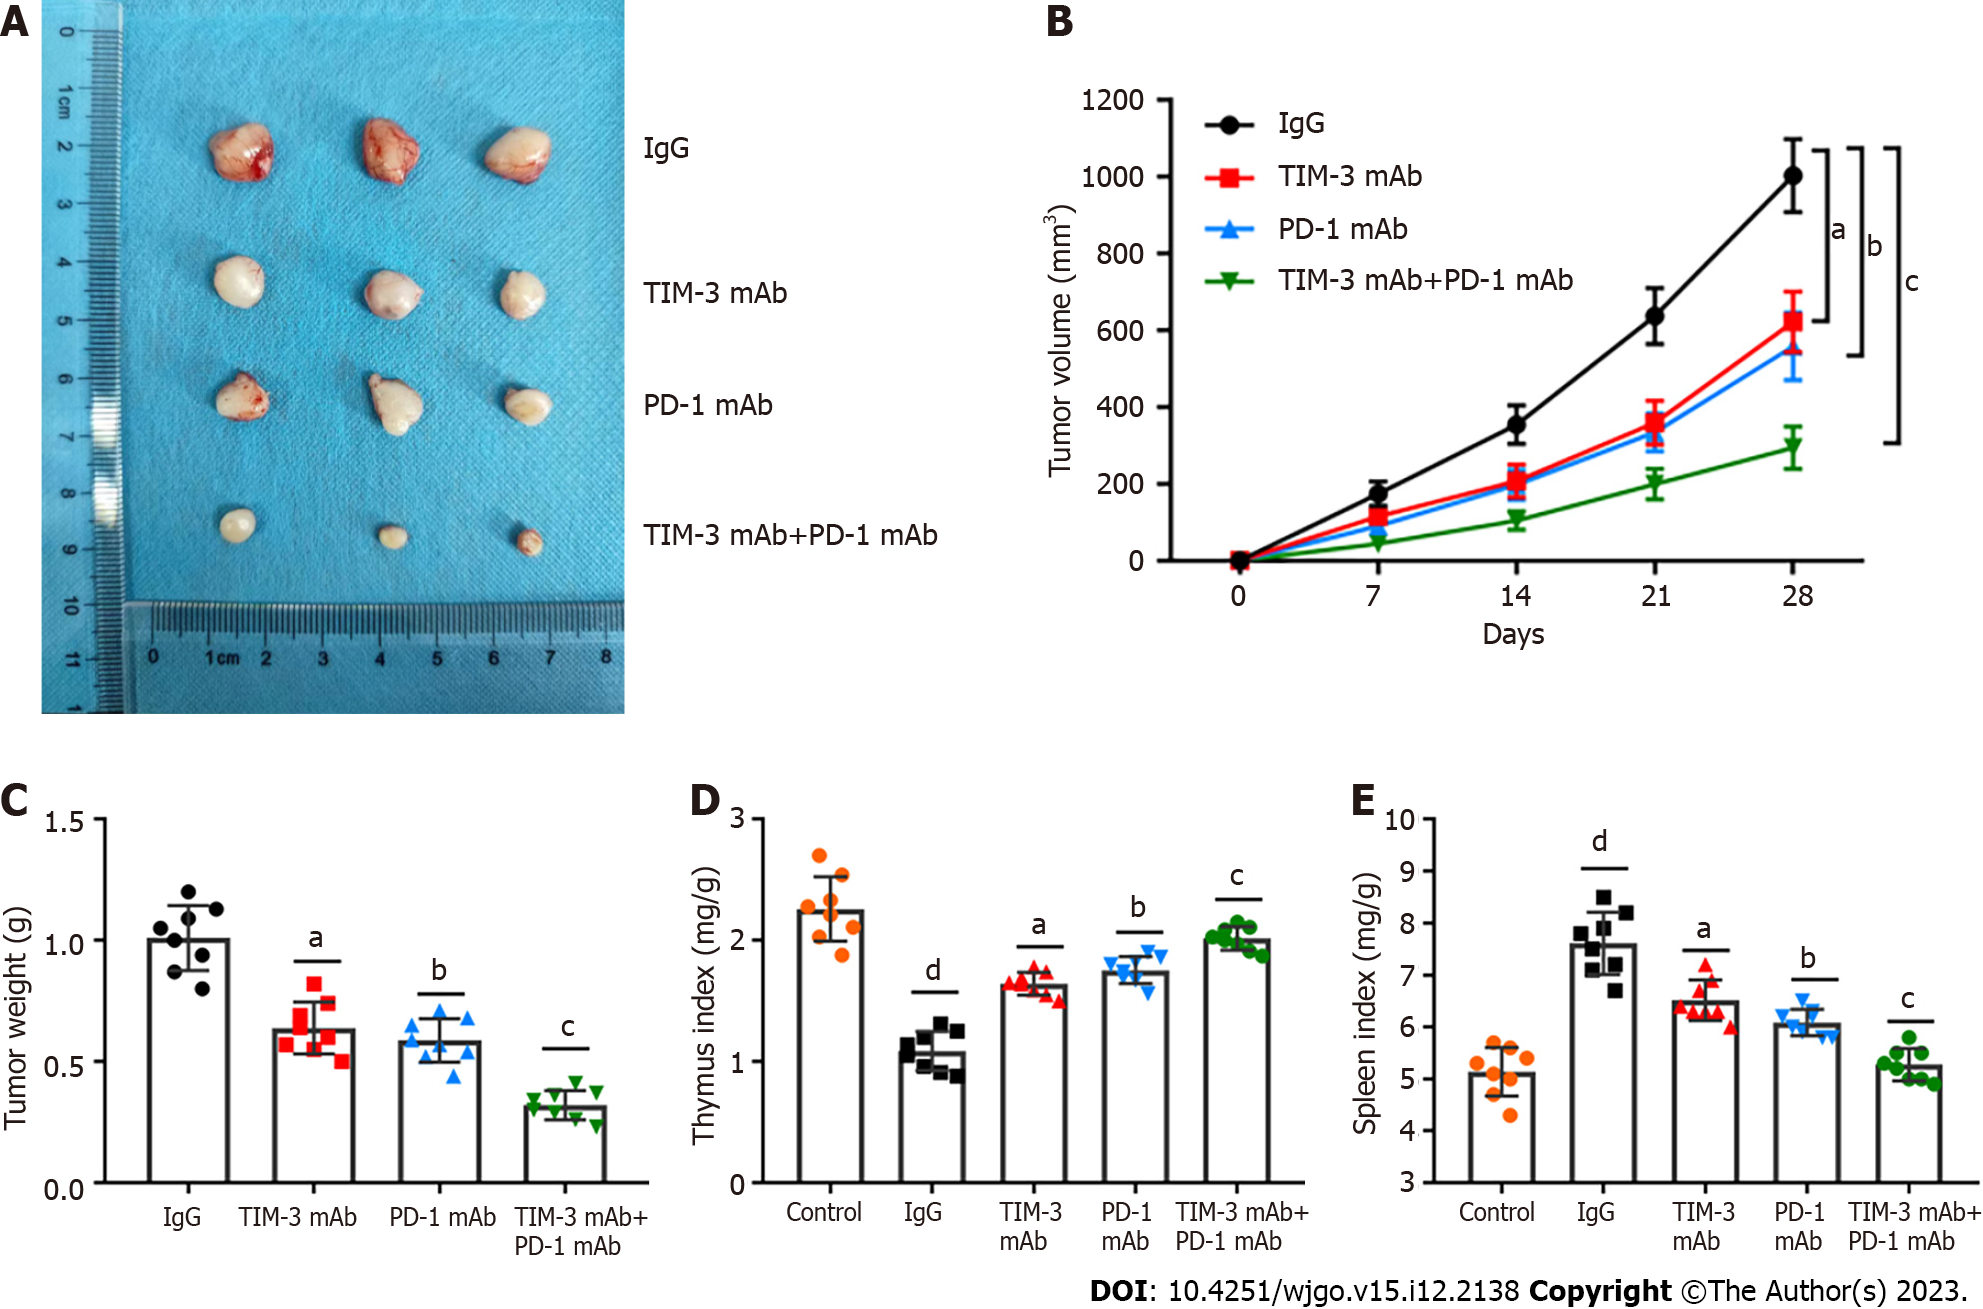
Figure 2 Combined T cell immunoglobulin and mucin domain-containing protein 3 and programmed cell death protein 1 blockade restrained xenograft tumor growth in mice.
A xenograft mouse model of hepatocellular carcinoma was established by subcutaneously injecting HepG2 cells into mice. These model mice were treated with immunoglobulin G (IgG) isotype control (IgG group; n = 8), anti-T cell immunoglobulin and mucin domain-containing protein 3 (TIM-3) monoclonal antibody (mAb) (TIM-3 mAb group; n = 8), anti-programmed cell death protein 1 (PD-1) mAb (PD-1 mAb group; n = 8), and combined anti-TIM-3 mAb and anti-PD-1 mAb (TIM-3 mAb + PD-1 mAb group; n = 8) for 4 wk. A: Tumor images in the four groups; B: Tumor volume; C: Tumor weight of mice in the four groups were recorded; D and E: The spleen index (D) and thymus index (E) were determined after euthanasia. Data from at least three independent experiments were presented as mean ± SD. dP < 0.01, compared with healthy control mice; aP < 0.01, bP < 0.01, cP < 0.01, compared with the immunoglobulin G isotype control group. PD-1: Programmed cell death protein 1; TIM-3: T cell immunoglobulin and mucin domain-containing protein 3; IgG: Immunoglobulin G; mAb: Monoclonal antibody.
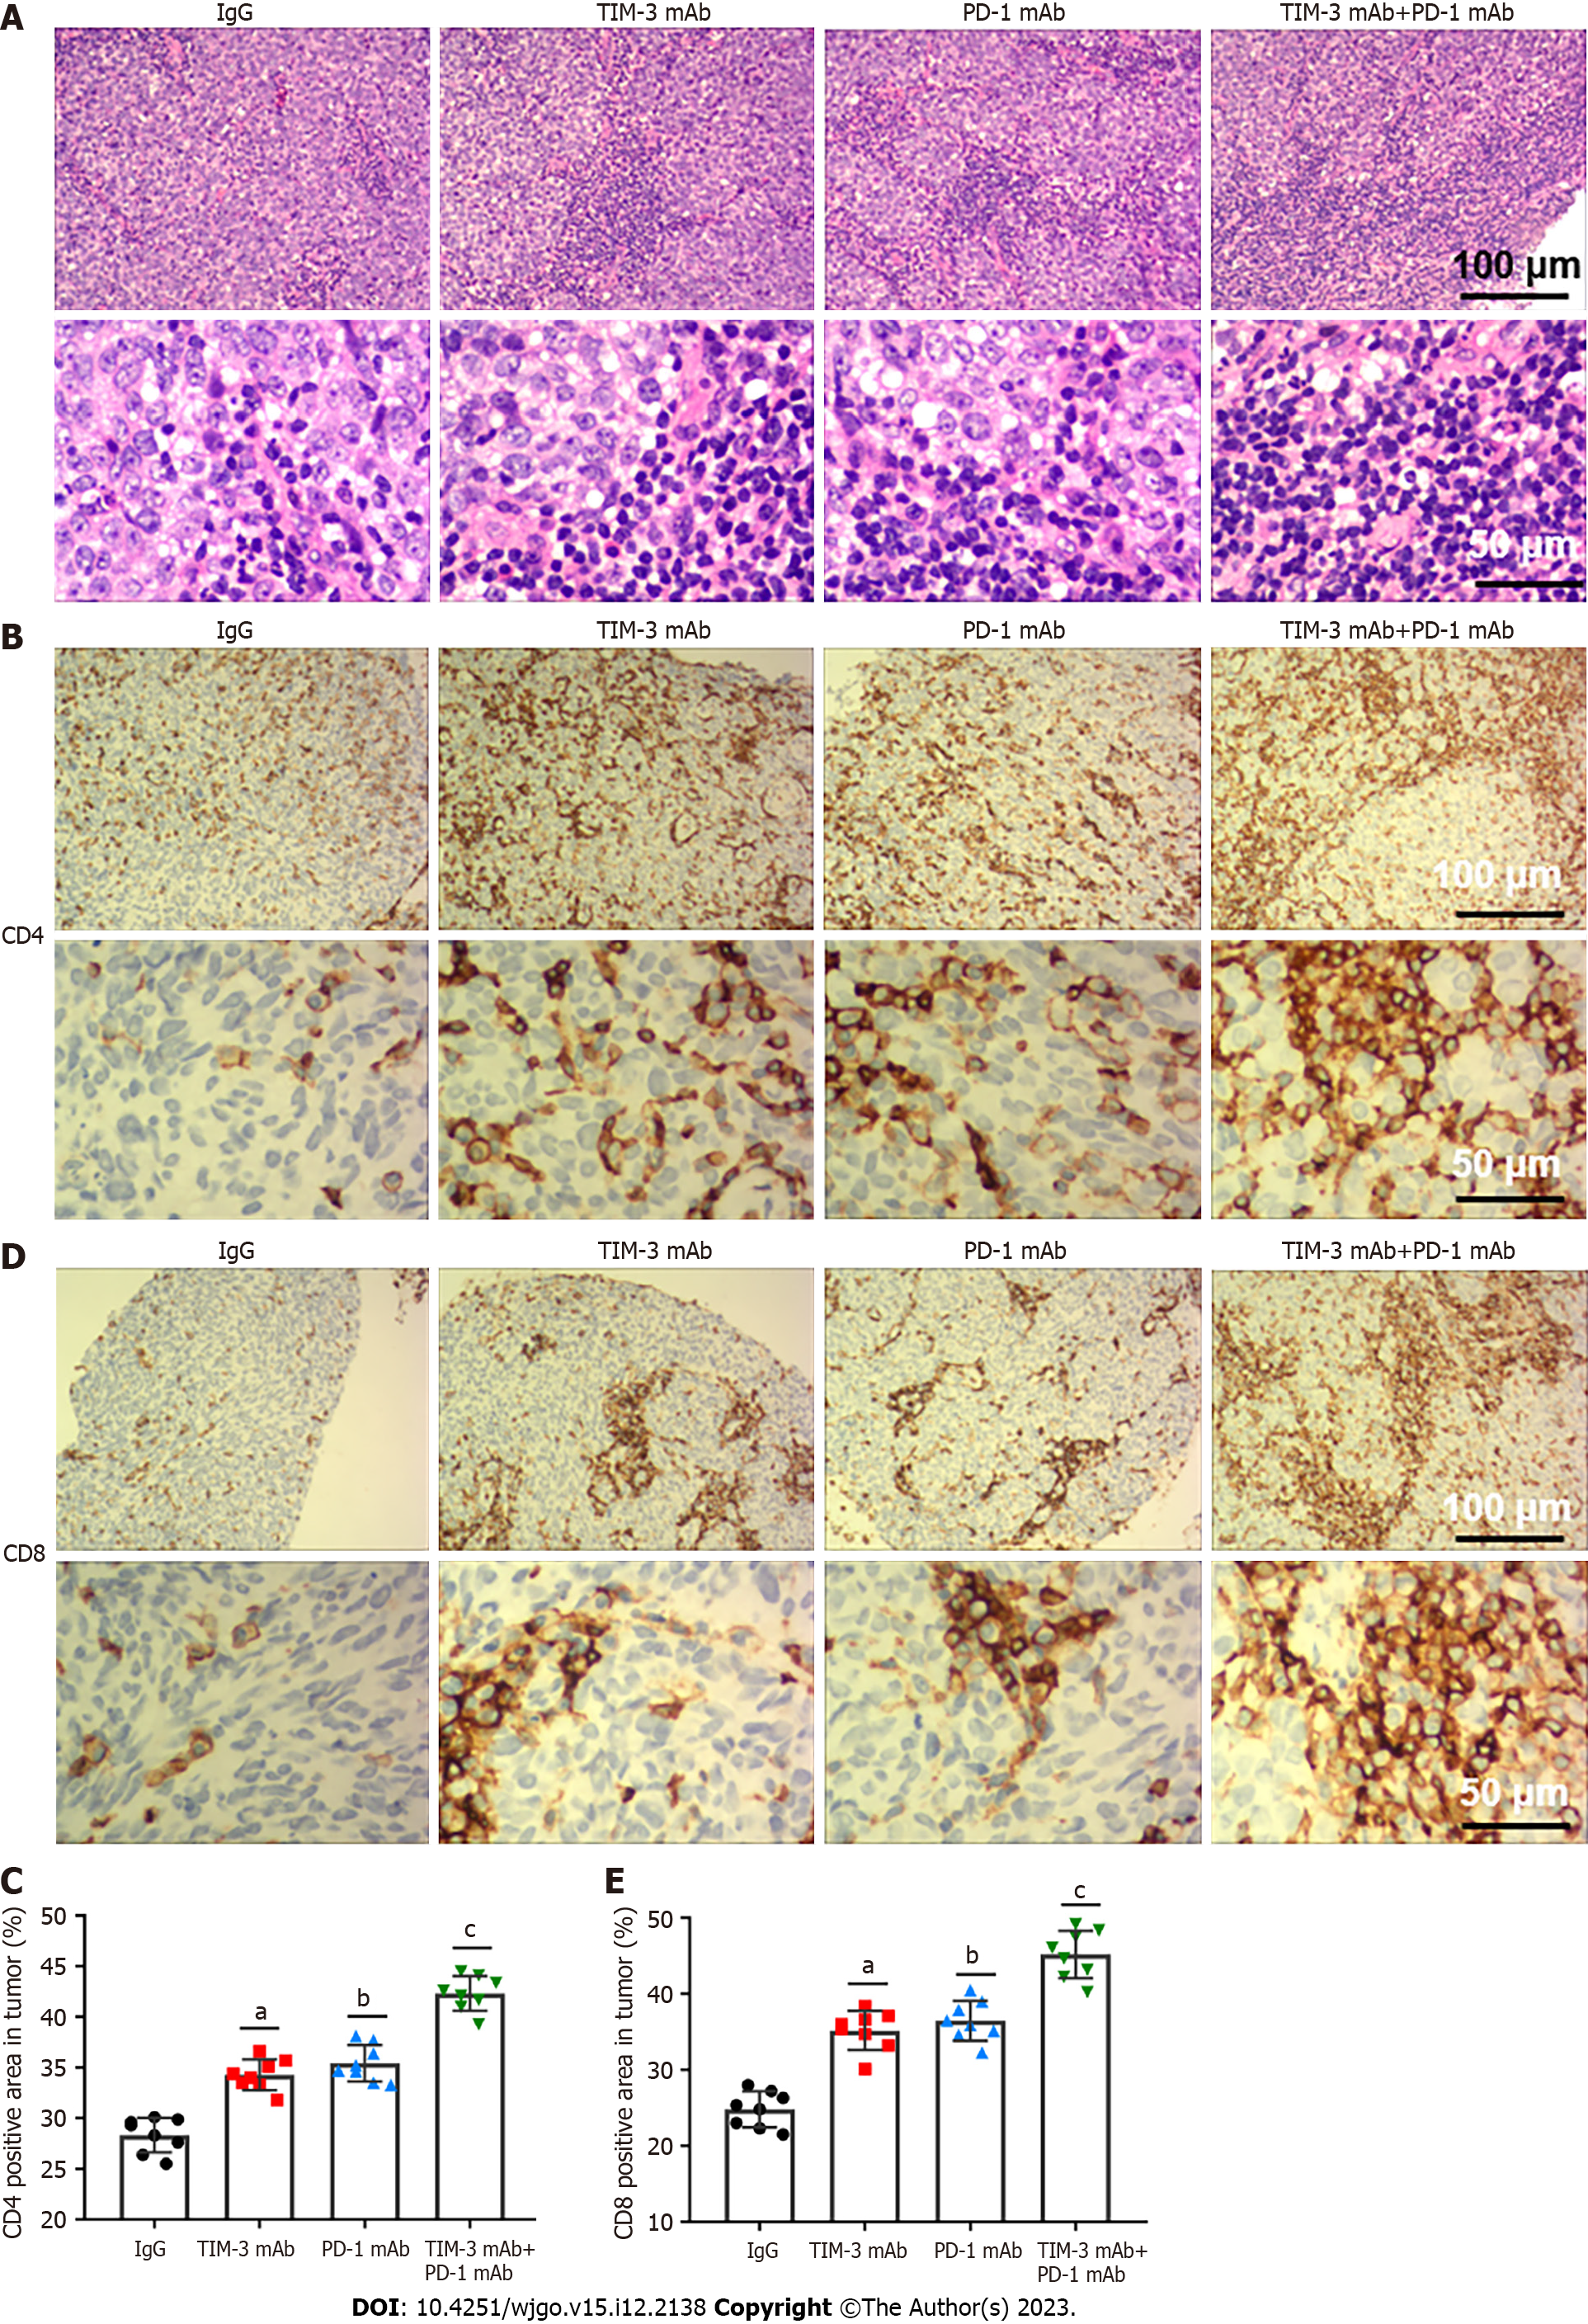
Figure 3 Combined blockade activated CD4+ and CD8+ T cell infiltration into tumor tissues.
A: The infiltration of tumor-infiltrating lymphocytes into tumor tissues was evaluated with hematoxylin and eosin staining; B-E: Immunohistochemical staining was employed to assess CD4+ (B, C) and CD8+ (D, E) T cell numbers in tumor tissues. Data from at least three independent experiments were presented as mean ± SD. aP < 0.01, bP < 0.01, cP < 0.01, compared with the immunoglobulin G isotype control group. PD-1: Programmed cell death protein 1; TIM-3: T cell immunoglobulin and mucin domain-containing protein 3; IgG: Immunoglobulin G; mAb: Monoclonal antibody.
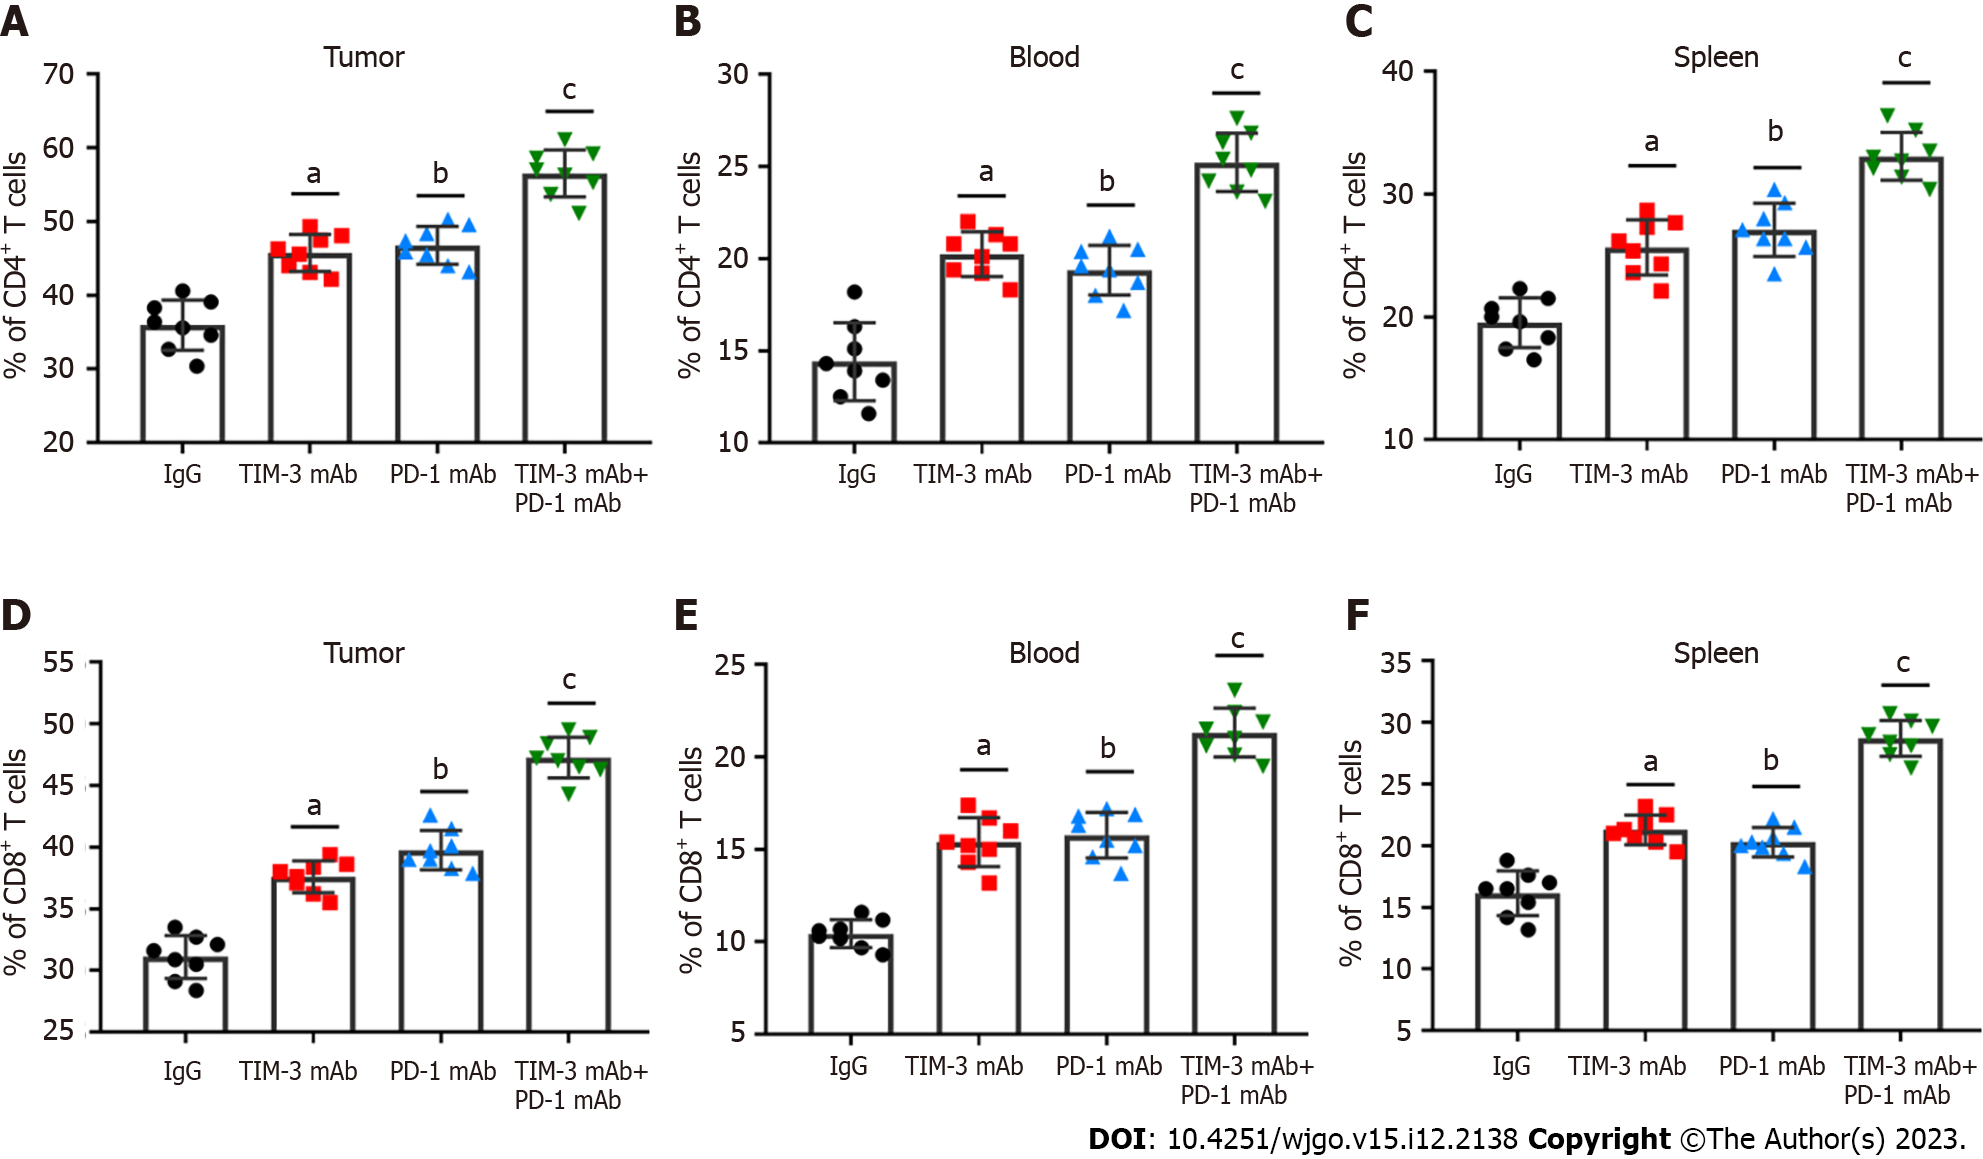
Figure 4 Combined blockade increased the percentage of CD4+ and CD8+ T cells in mice.
A-C: The percentage of CD4+ T cells in tumor tissues (A), peripheral blood (B) and spleen (C) of mice in four groups was tested with flow cytometry. E and F: The percentage of CD8+ T cells in (D) tumor tissues, peripheral blood (E) and spleen (F) of mice in four groups was tested with flow cytometry. Data from at least three independent experiments were presented as mean ± SD. aP < 0.01, bP < 0.01, cP < 0.01, compared with the immunoglobulin G isotype control group. PD-1: Programmed cell death protein 1; TIM-3: T cell immunoglobulin and mucin domain-containing protein 3; IgG: Immunoglobulin G; mAb: Monoclonal antibody.
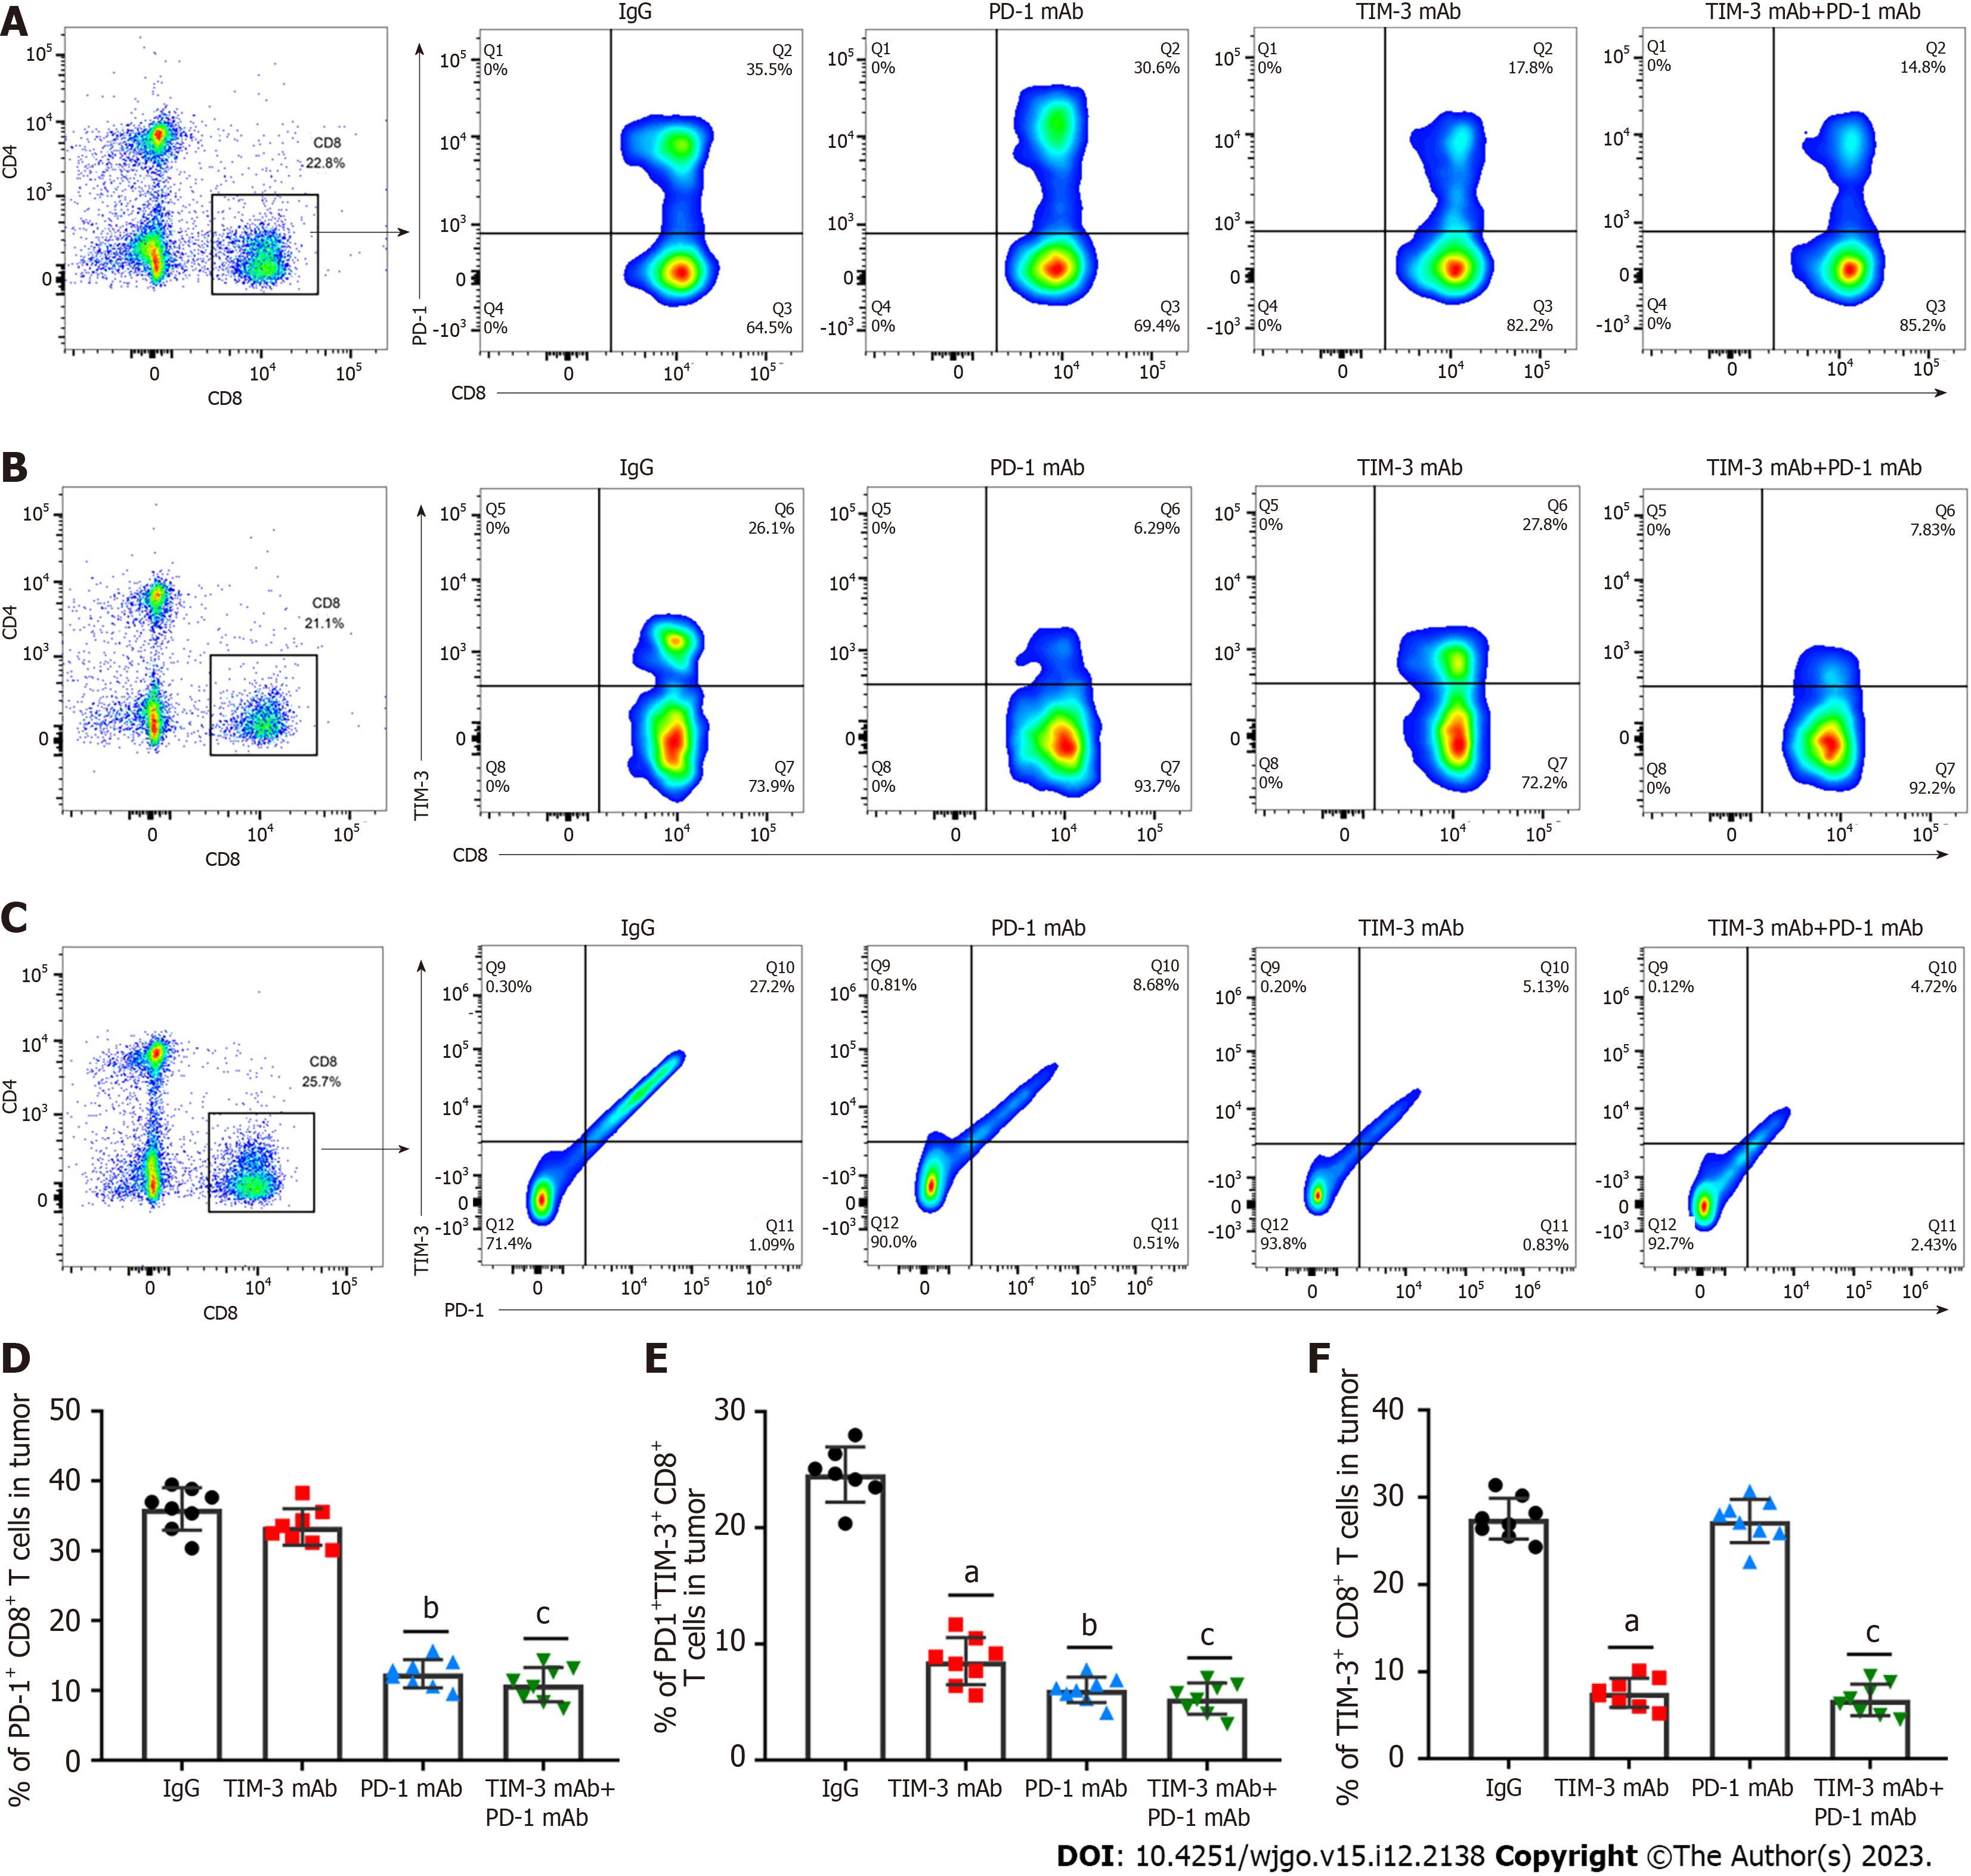
Figure 5 Combined blockade ameliorated T cell exhaustion.
A and D: The percentages of programmed cell death protein 1 (PD-1)+CD8+ T cells; B and E: T cell immunoglobulin and mucin domain-containing protein 3 (TIM-3)+CD8+ T cells; C and F: PD-1+TIM-3+CD8+ T cells in the tumor tissues of mice in the four groups was assessed with flow cytometry. Data from at least three independent experiments were presented as mean ± SD. aP < 0.01, bP < 0.01, cP < 0.01, compared with the immunoglobulin G isotype control group. PD-1: Programmed cell death protein 1; TIM-3: T cell immunoglobulin and mucin domain-containing protein 3; IgG: Immunoglobulin G; mAb: Monoclonal antibody.
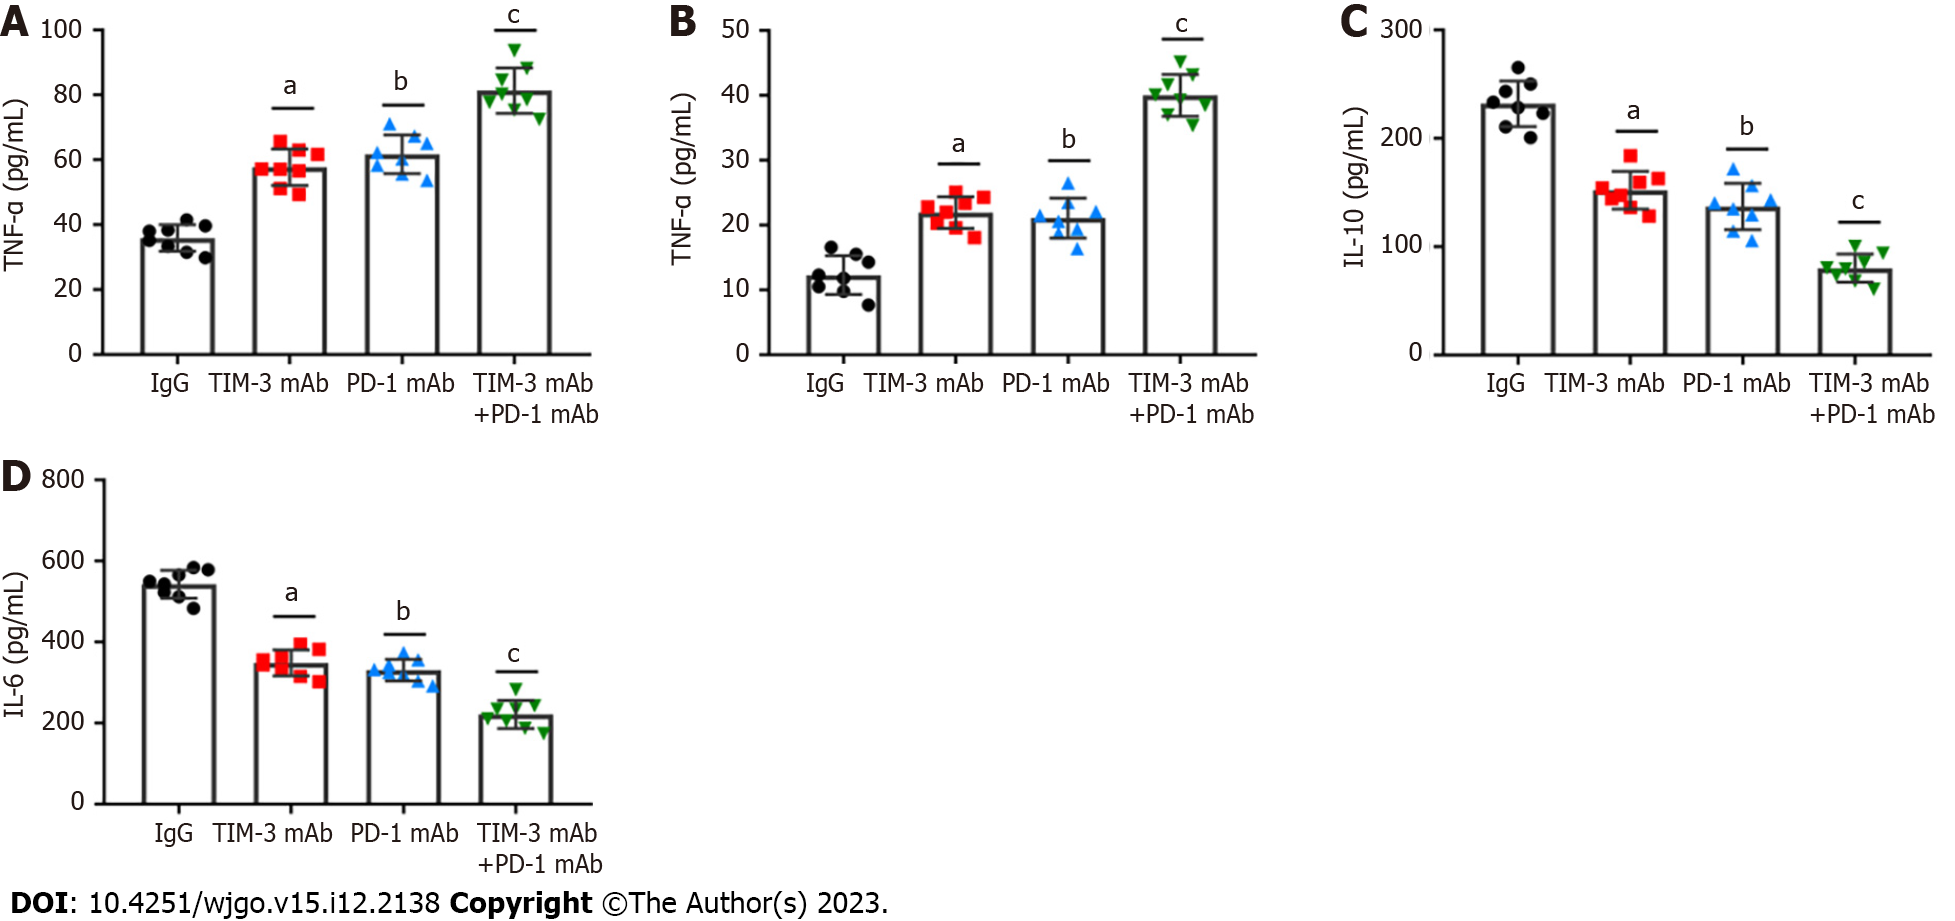
Figure 6 Combined blockade of T cell immunoglobulin and mucin domain-containing protein 3 and programmed cell death protein 1 affected immune effector chemokines in mice.
A-D: The levels of T cell effector cytokines interferon-γ (A) and (B) tumor necrosis factor-α, and immunosuppressive cytokines interleukin (IL)-10 (C) and IL-6 (D) in tumor tissues of mice in four groups were gauged with enzyme-linked immunosorbent assay kits. Data from at least three independent experiments were presented as mean ± SD. aP < 0.01, bP < 0.01, cP < 0.01, compared with the immunoglobulin G isotype control group. PD-1: Programmed cell death protein 1; TIM-3: T cell immunoglobulin and mucin domain-containing protein 3; IgG: Immunoglobulin G. IL: Interleukin; TNF-α: Tumor necrosis factor-α; IFN-γ: Interferon-γ; mAb: Monoclonal antibody.
- Citation: Zhang XS, Zhou HC, Wei P, Chen L, Ma WH, Ding L, Liang SC, Chen BD. Combined TIM-3 and PD-1 blockade restrains hepatocellular carcinoma development by facilitating CD4+ and CD8+ T cell-mediated antitumor immune responses. World J Gastrointest Oncol 2023; 15(12): 2138-2149
- URL: https://www.wjgnet.com/1948-5204/full/v15/i12/2138.htm
- DOI: https://dx.doi.org/10.4251/wjgo.v15.i12.2138


