Copyright
©The Author(s) 2023.
World J Gastrointest Oncol. Dec 15, 2023; 15(12): 2064-2076
Published online Dec 15, 2023. doi: 10.4251/wjgo.v15.i12.2064
Published online Dec 15, 2023. doi: 10.4251/wjgo.v15.i12.2064
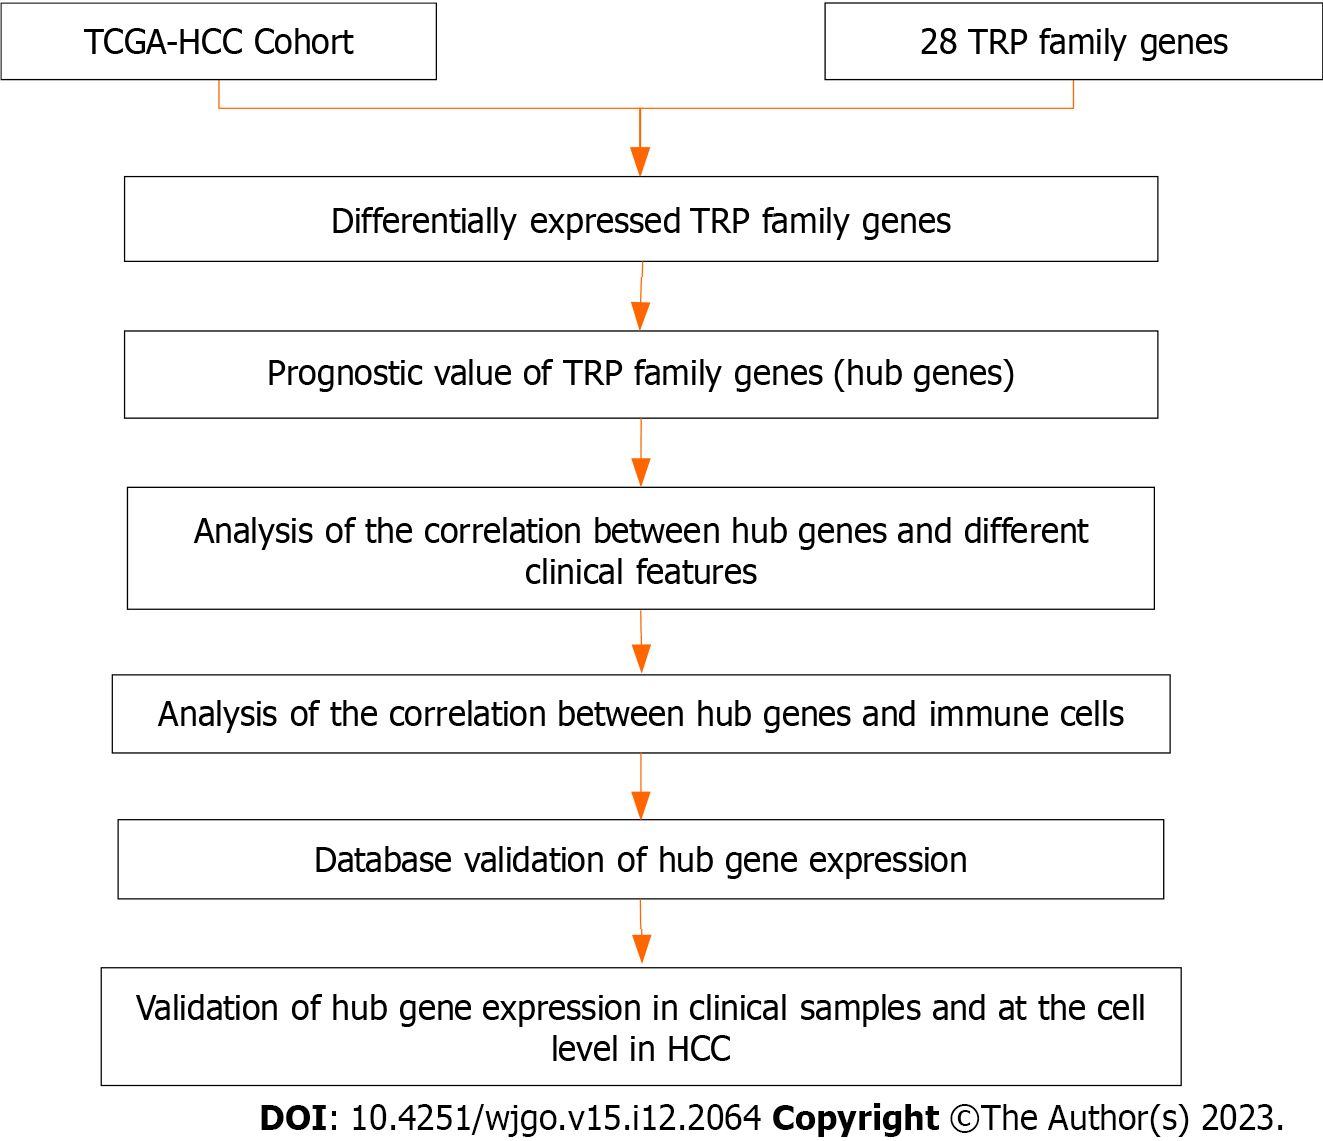
Figure 1 Study flow chart.
HCC: Hepatocellular carcinoma; TCGA-HCC: The Cancer Genome Atlas-hepatocellular carcinoma; TRP: Transient receptor potential.
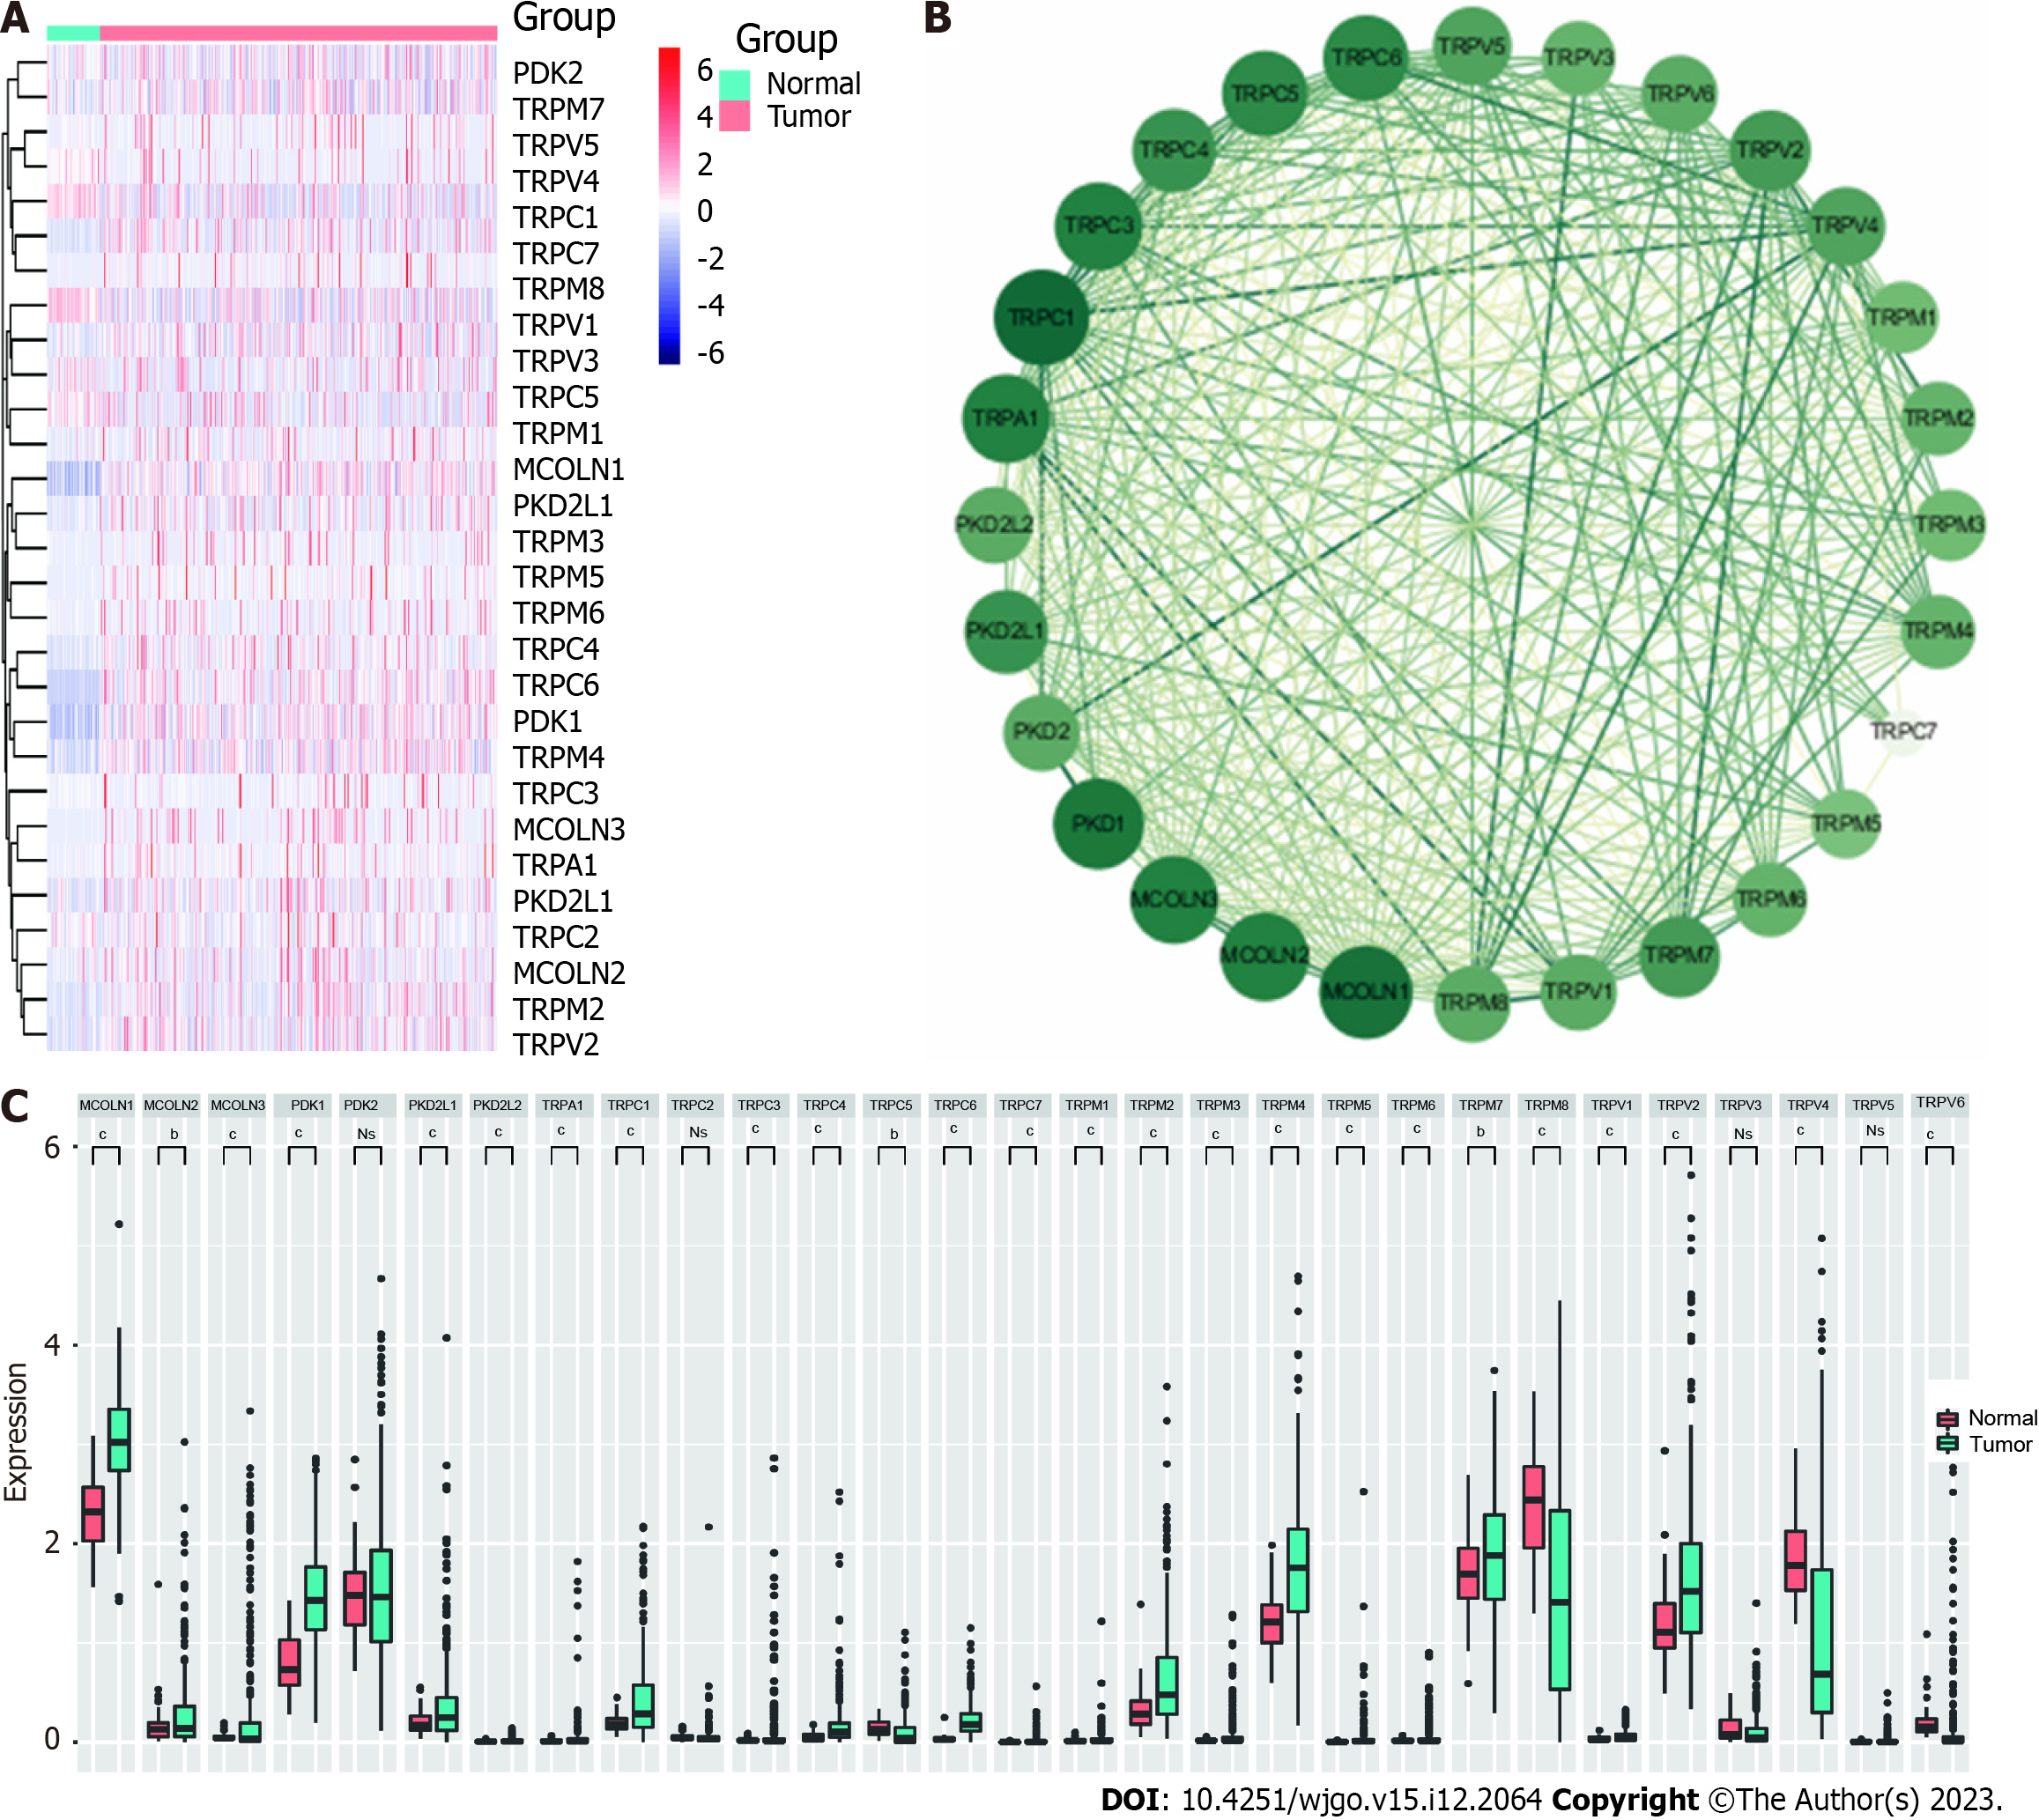
Figure 2 Analyses of differential transient receptor potential family gene expression in hepatocellular carcinoma.
A: Heatmap representing the relative expression levels of 28 transient receptor potential (TRP) family genes in hepatocellular carcinoma (HCC) patients and control individuals in The Cancer Genome Atlas-HCC (TCGA-HCC) cohort; B: Violin plots representing the expression of 28 TRP family genes in HCC patients and control individuals from TCGA-HCC cohort; C: Protein-protein interaction network highlighting interactions among differentially expressed TRP family genes. bP < 0.01; cP < 0.001; NS: Not significant.
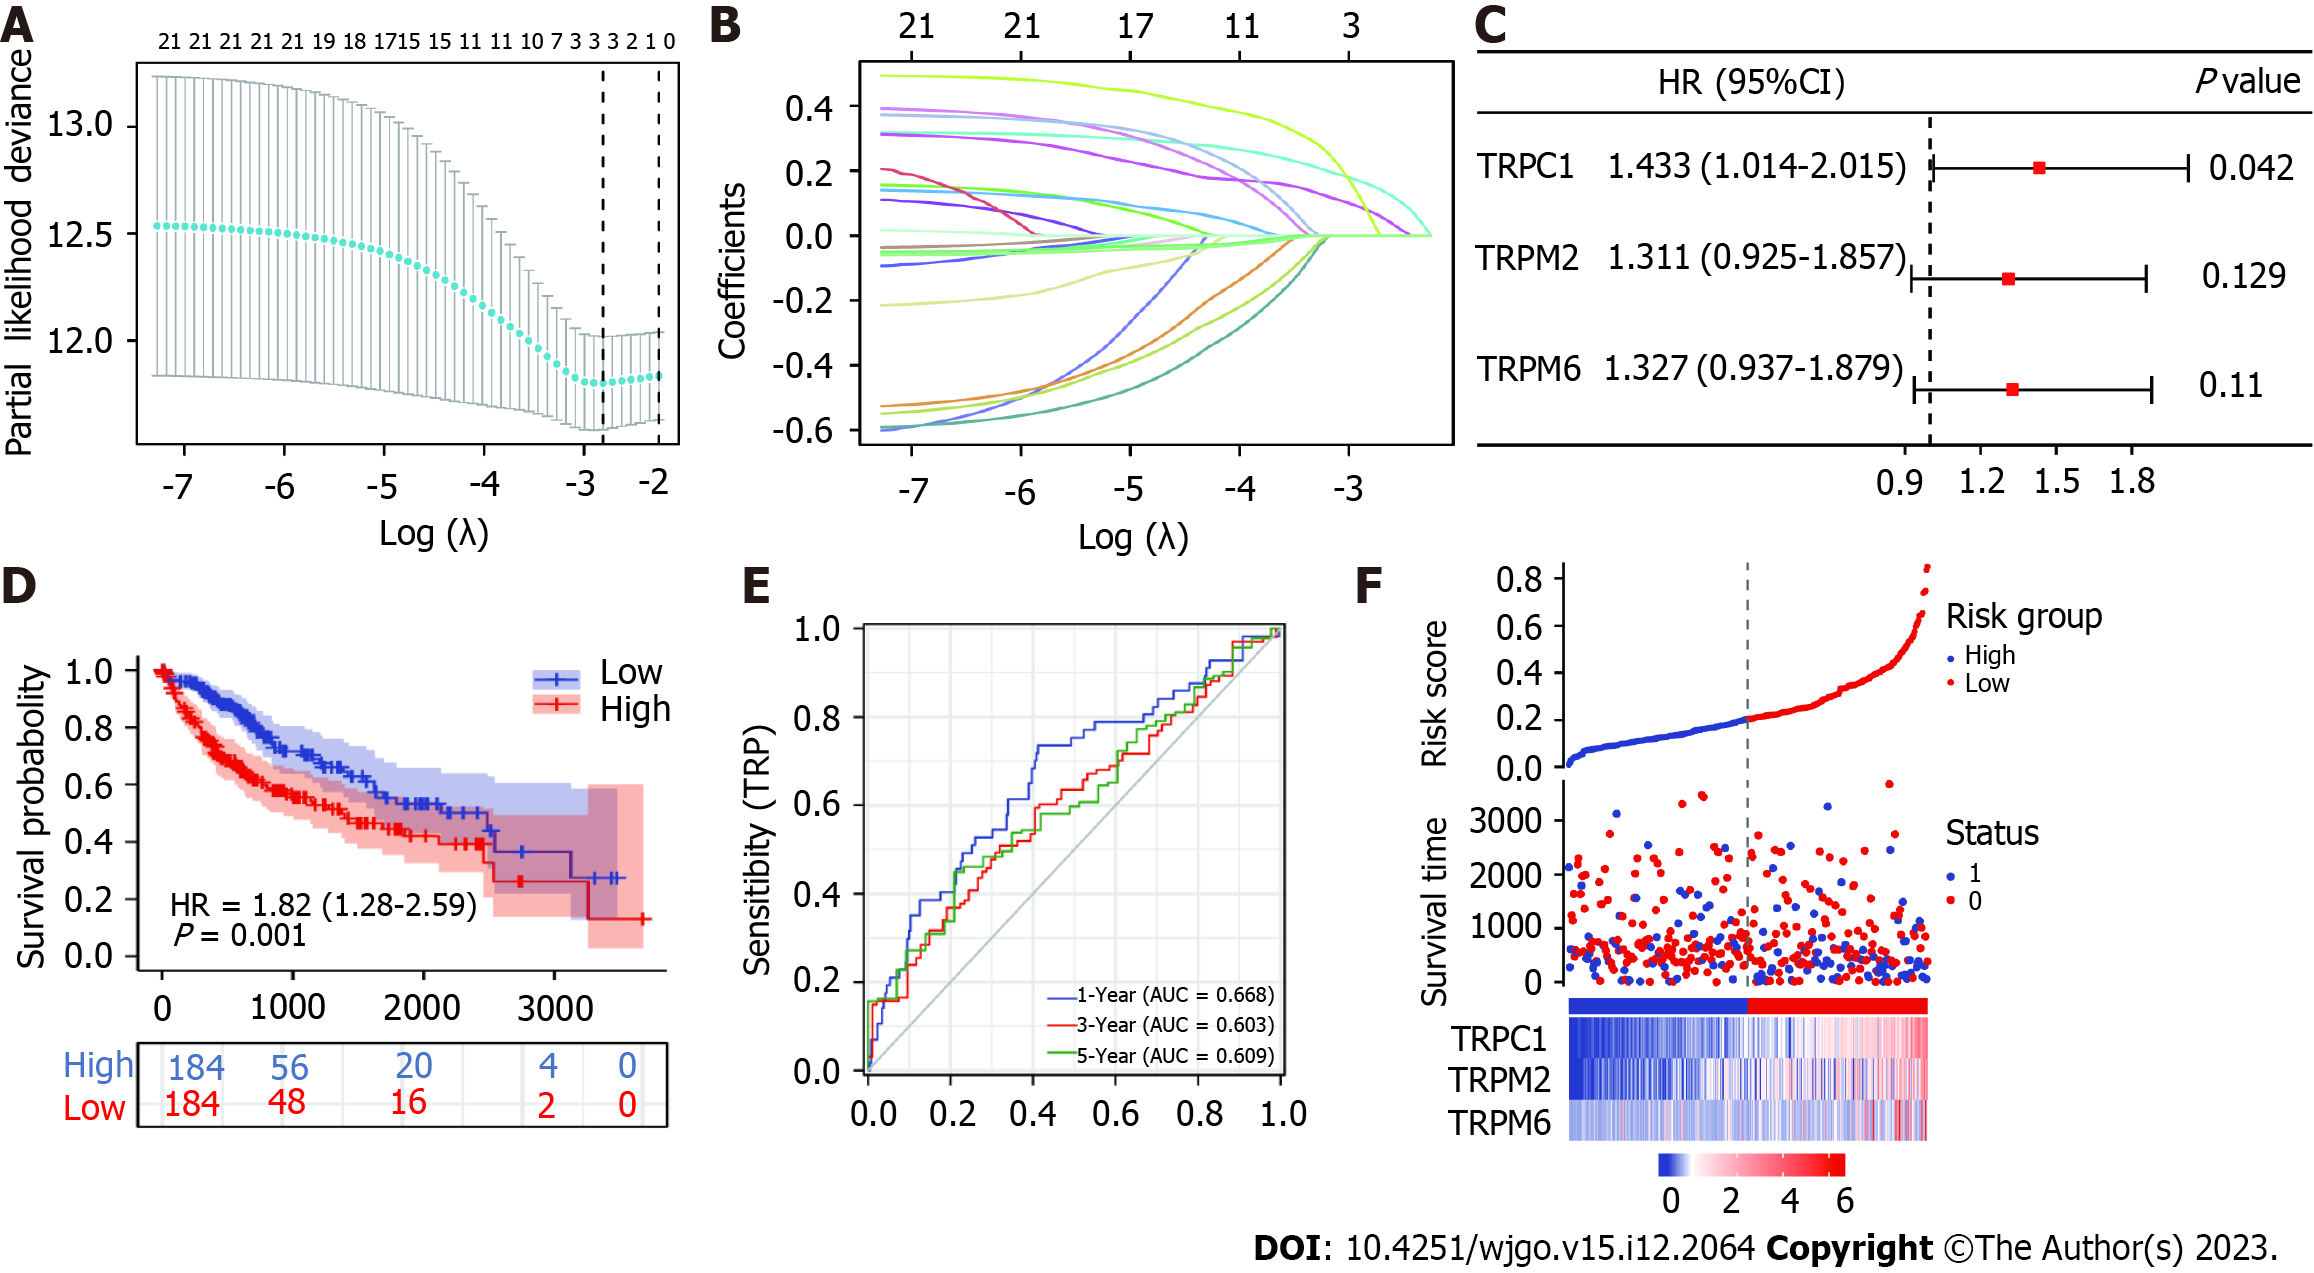
Figure 3 Prognostic analyses of hepatocellular carcinoma patients based on transient receptor potential family gene expression.
A: Cross-validation of tuning parameter selection in the least absolute shrinkage and selection operator model by a factor of 10 using The Cancer Genome Atlas-hepatocellular carcinoma (HCC) data; B: Least absolute shrinkage and selection operator coefficients for selected transient receptor potential (TRP) family-related genes; C: Forest plots representing risk associated with prognostic TRP family genes in HCC; D: Kaplan-Meier curves comparing outcomes for low- and high-risk HCC patients classified according to risk scores; E: Receiver operating characteristic curves corresponding to HCC patient 1-, 3-, and 5-year survival rates based on TRP family gene expression; F: Relationship between TRP family gene expression and survival status. HR: Hazard ratio; TRPC1: Transient receptor potential canonical type 1; TRPM: Transient receptor potential cation channel subfamily M.
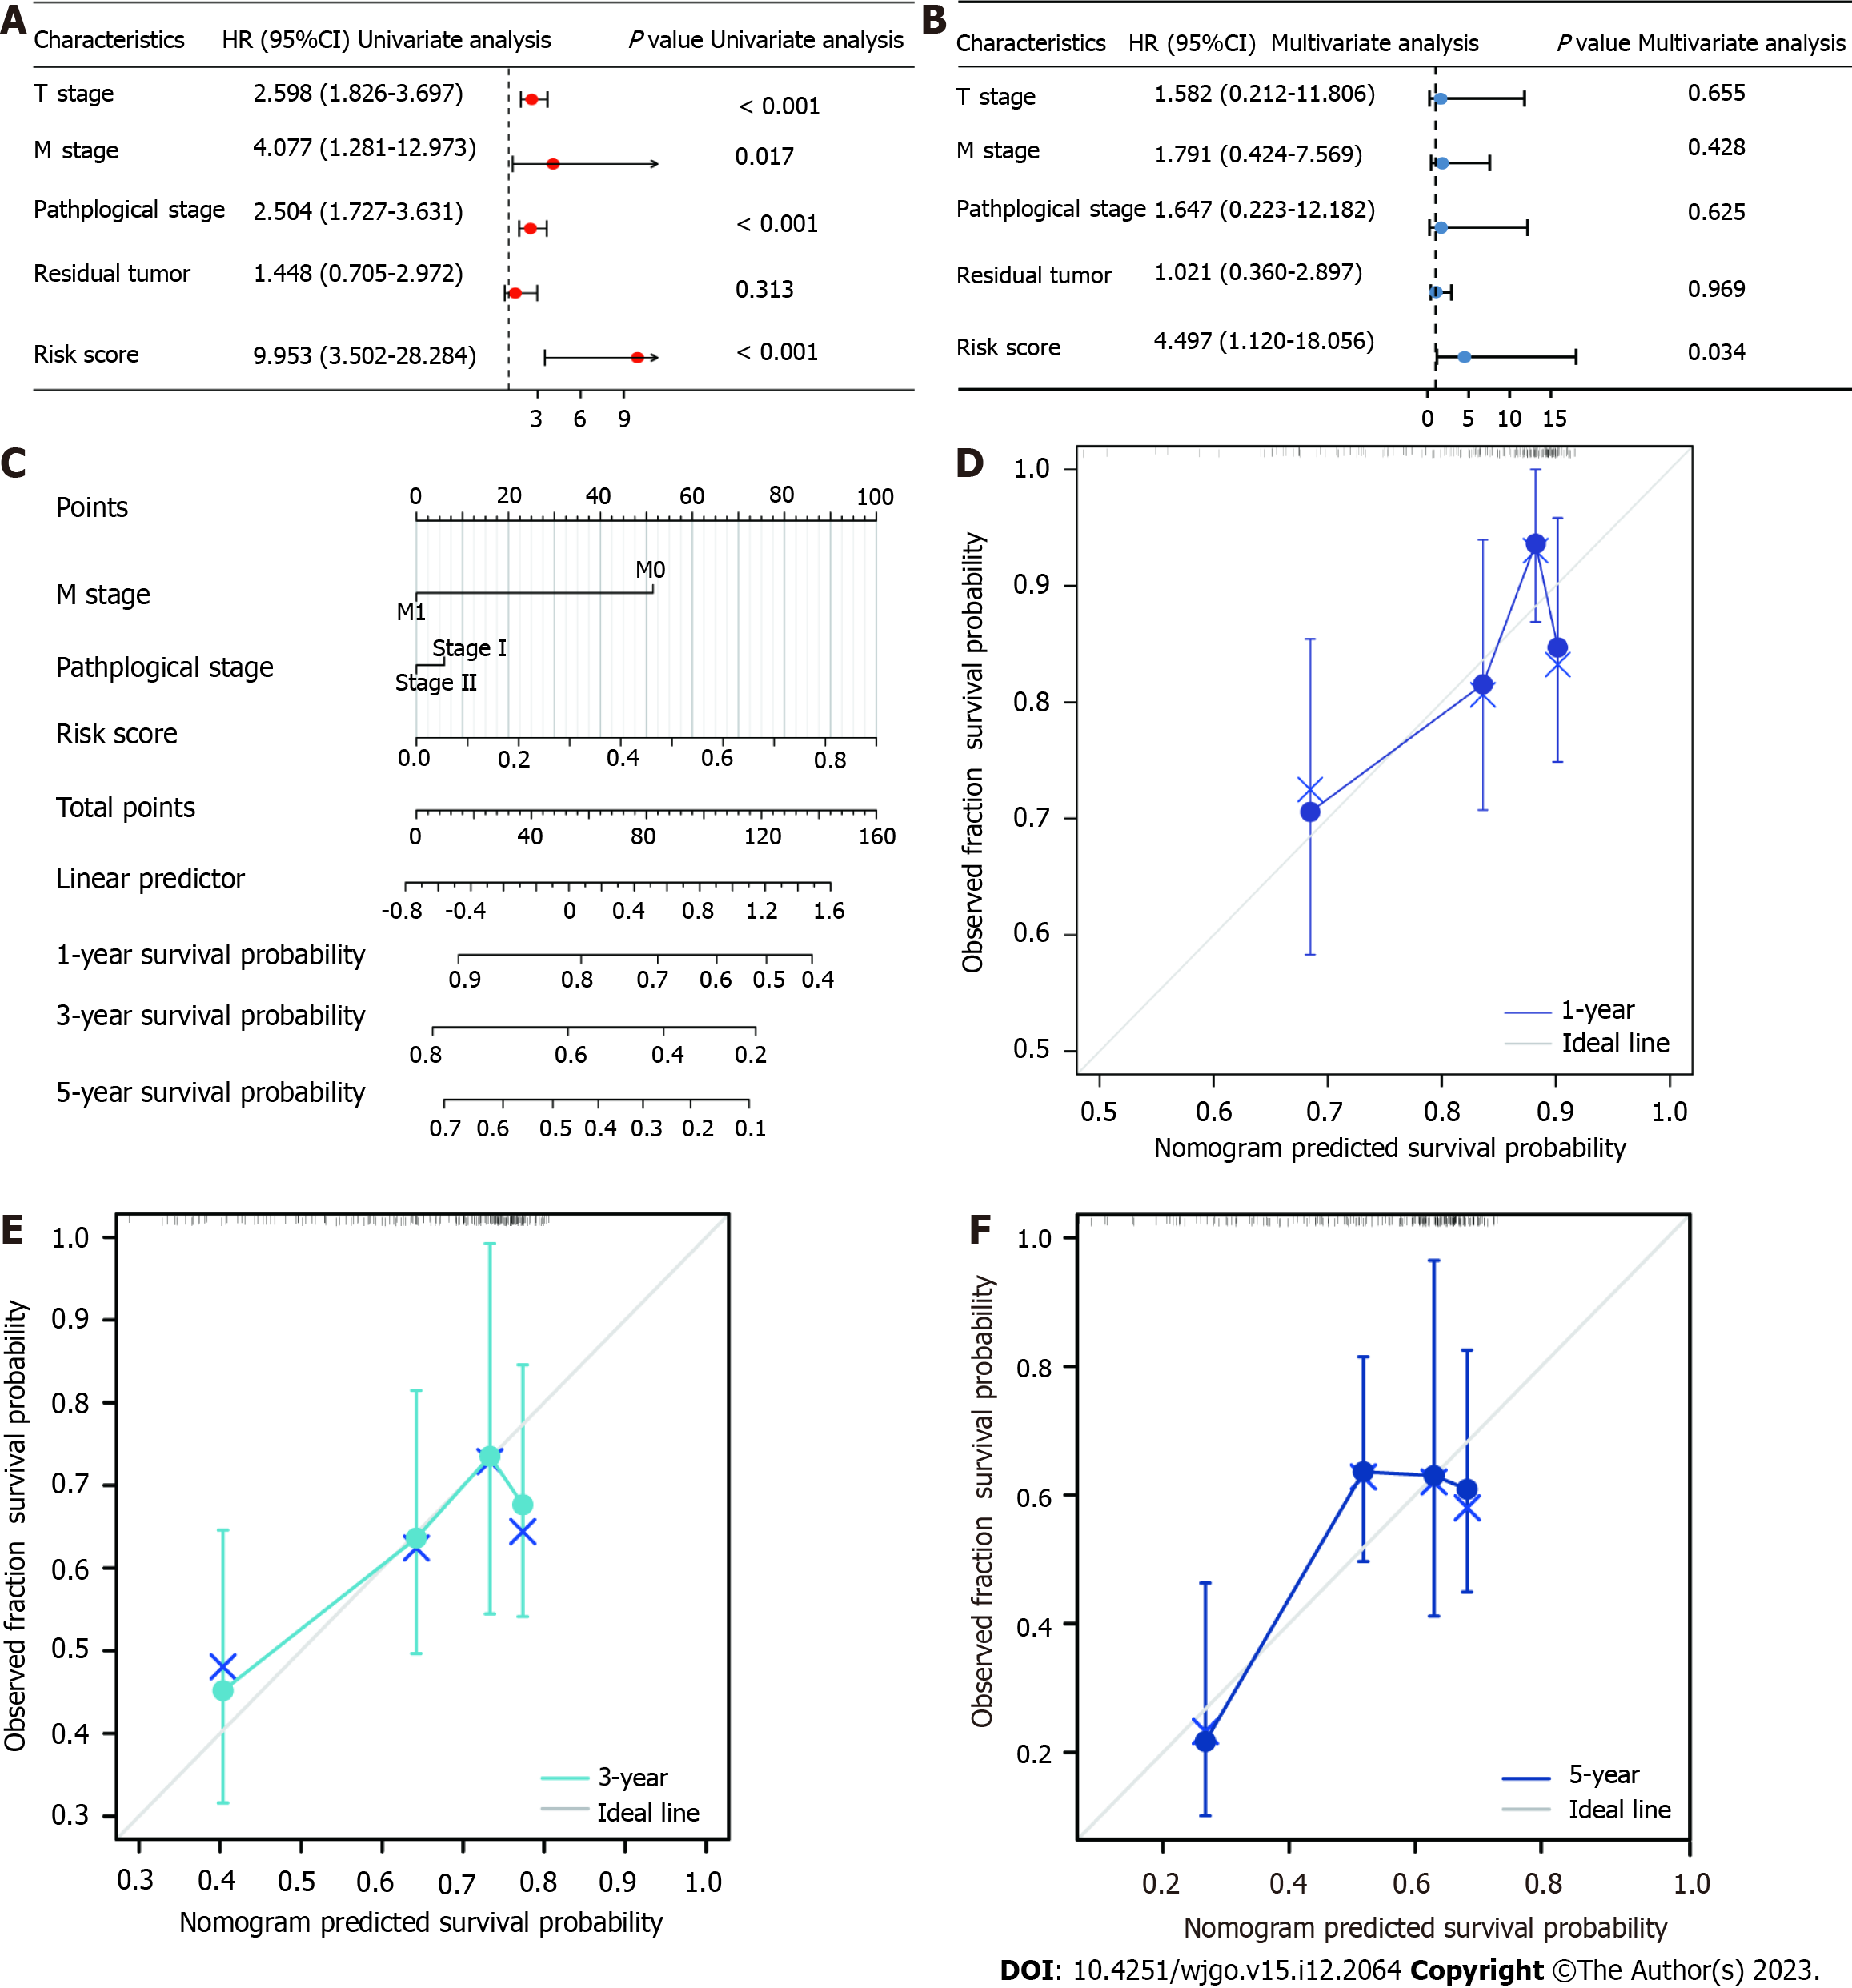
Figure 4 Analyses of the independent prognostic significance of transient receptor potential family gene expression.
A and B: Univariate and multivariate Cox regression analyses of hepatocellular carcinoma (HCC) patients included within The Cancer Genome Atlas database; C: Model developed based on a combination of HCC patient clinical characteristics and risk signatures; D-F: Calibration curve plots demonstrating model predictive performance for 1-, 3-, and 5-year overall survival. HR: Hazard ratio.
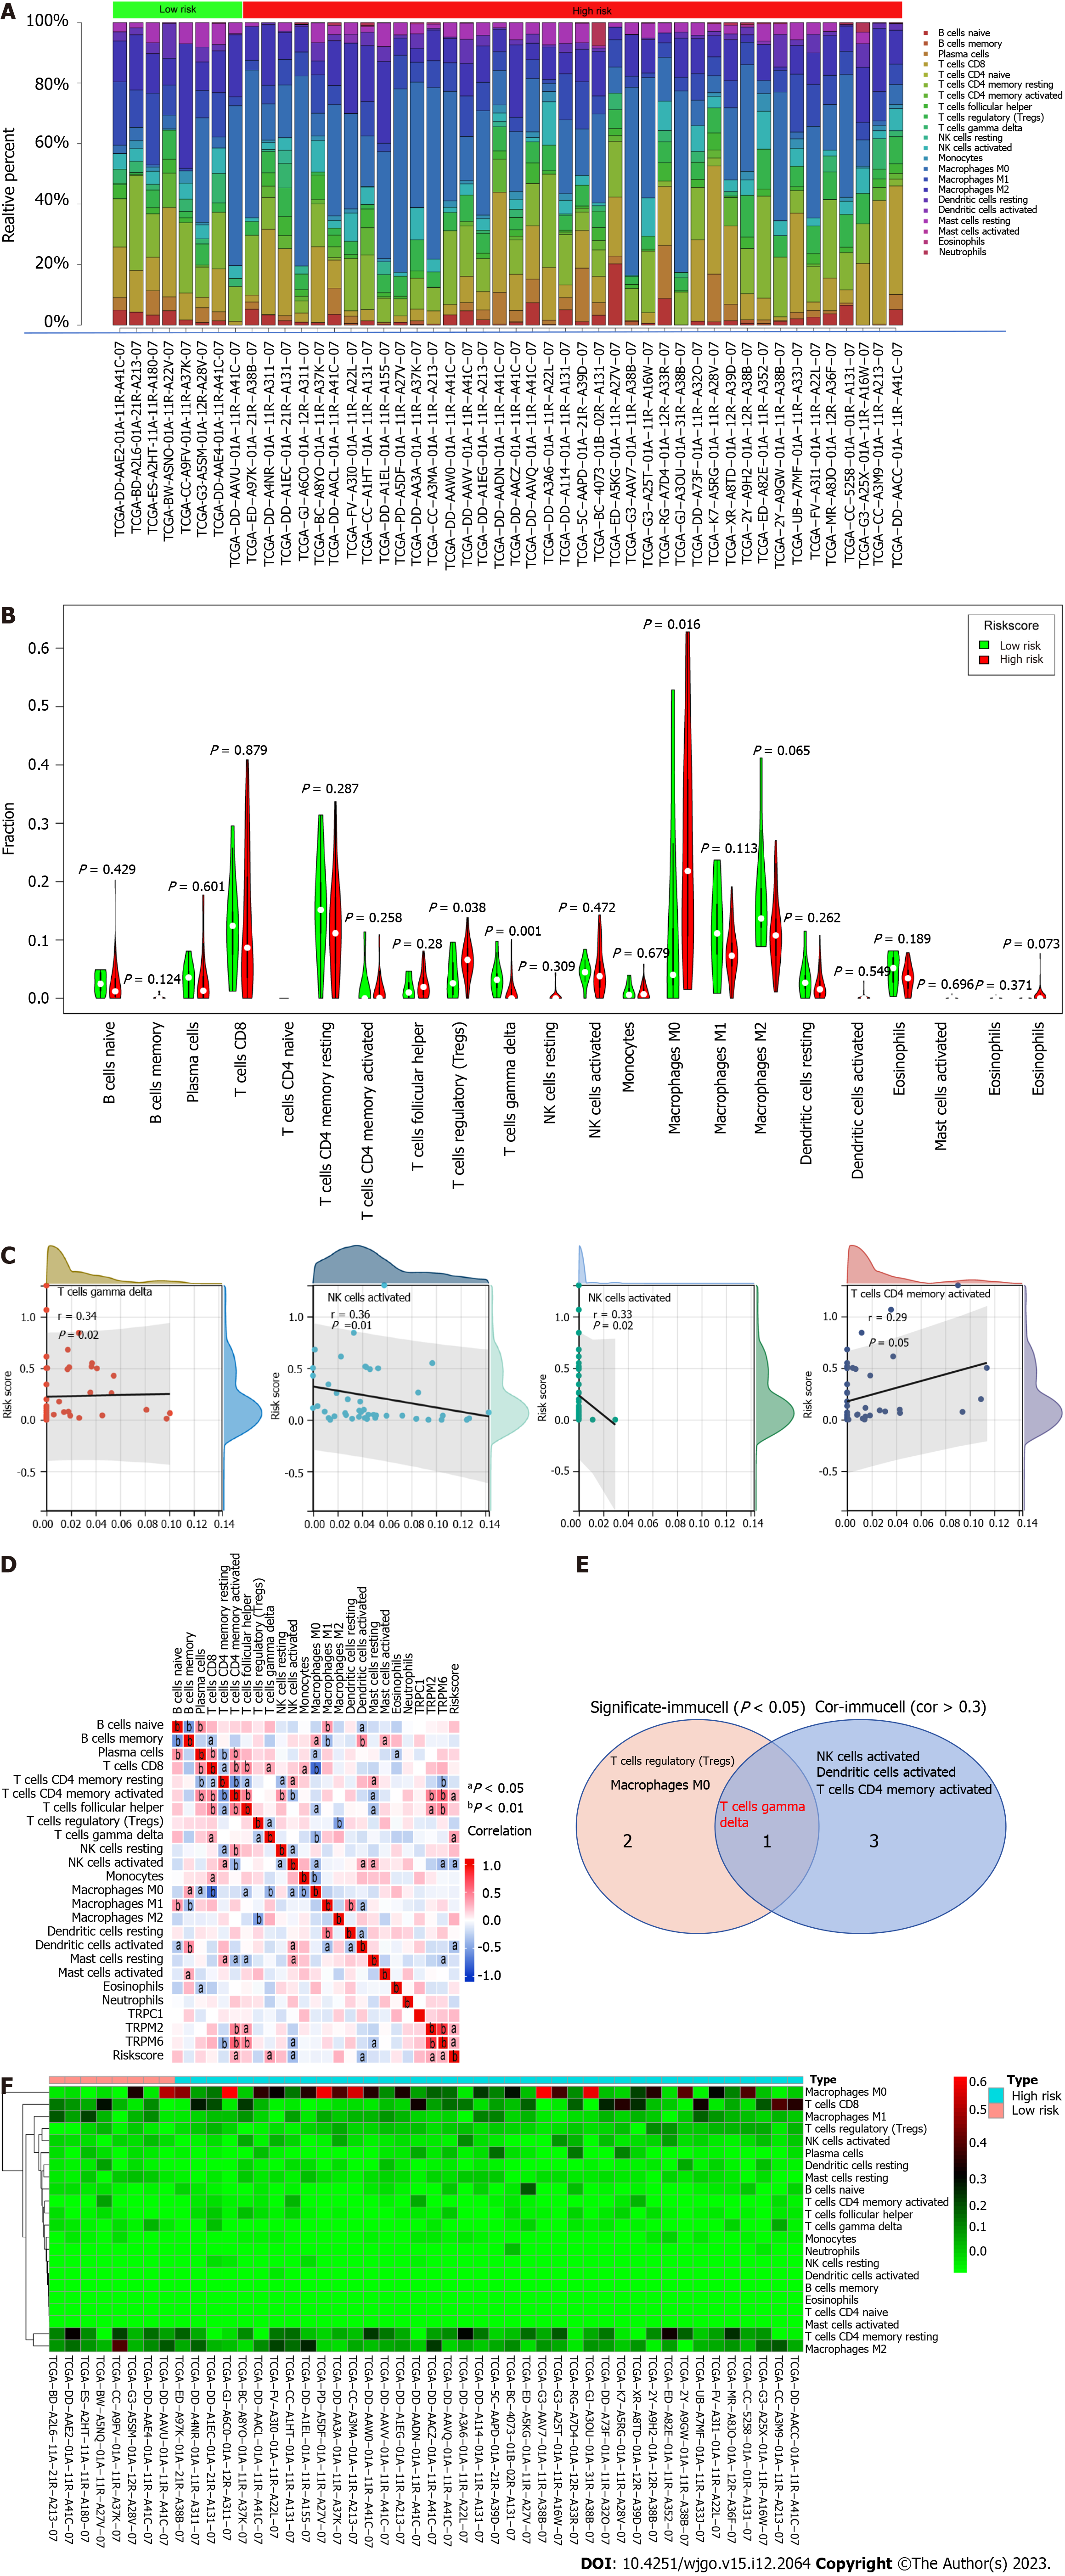
Figure 5 Analyses of the association between transient receptor potential family genes and the tumor immune microenvironment.
A: Immune cell infiltration analysis for 22 types of immune cells in hepatocellular carcinoma (HCC) and control patient samples from The Cancer Genome Atlas-HCC cohort; B: Violin plot revealing differences in the relative infiltration of 22 immune cell types in HCC and control patient samples; C: Scatter plot exhibiting correlations between hub transient receptor potential family genes and 22 different immune cell types; D: Heatmap revealing correlations between hub gene expression and 22 different immune cell types; E: Venn diagram revealing overlapping immune cell types exhibiting differential expression and relevance; F: Heatmap corresponding to the association of high- and low-risk groups with immune cell infiltration. NK: Natural killer.
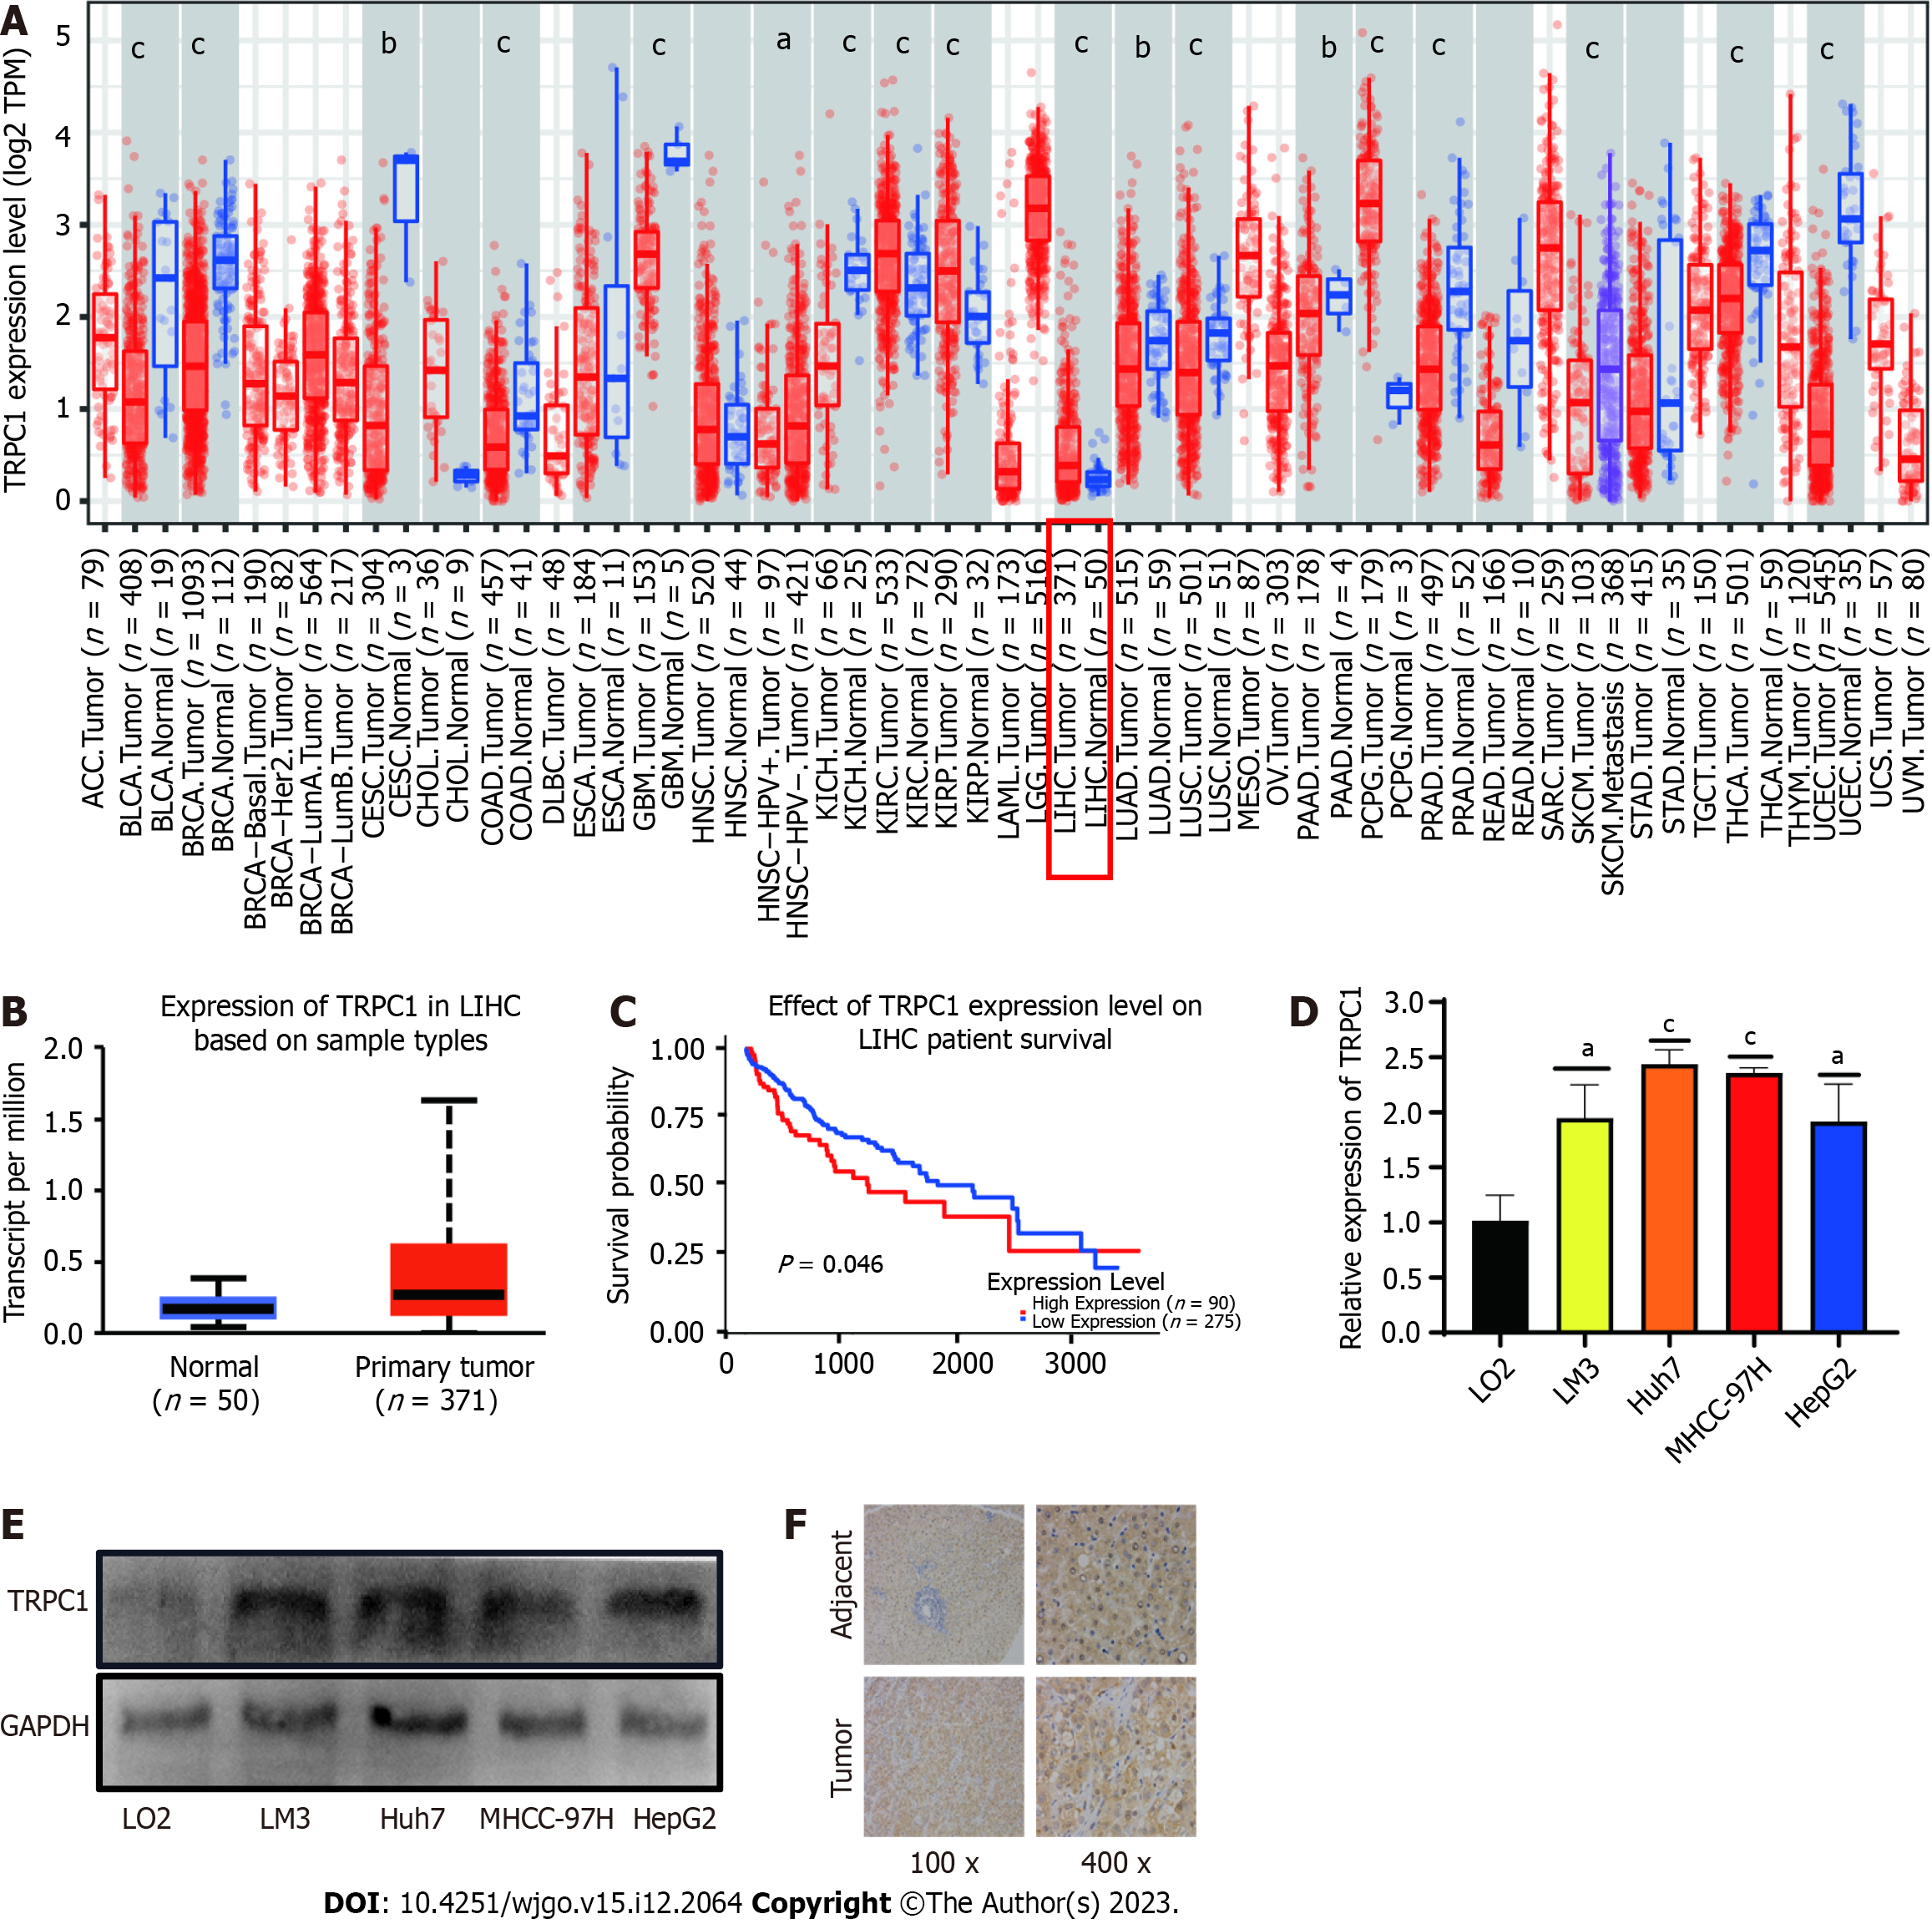
Figure 6 Transient receptor potential canonical type 1 expression analyses in hepatocellular carcinoma.
A: Transient receptor potential canonical type 1 (TRPC1) expression levels in different cancers; B: TRPC1 expression in hepatocellular carcinoma (HCC) tumors and adjacent tissues; C: Differences in the prognostic outcomes of patients expressing different TRPC1 levels in HCC; D and E: Comparisons of TRPC1 mRNA levels in the control LO2 liver epithelial cell line and in HCC cell lines; F: Immunohistochemical analysis of TRPC1 expression levels in HCC tumors and adjacent normal tissue. aP < 0.05; cP < 0.001.
- Citation: Mei XC, Chen Q, Zuo S. Transient receptor potential-related risk model predicts prognosis of hepatocellular carcinoma patients. World J Gastrointest Oncol 2023; 15(12): 2064-2076
- URL: https://www.wjgnet.com/1948-5204/full/v15/i12/2064.htm
- DOI: https://dx.doi.org/10.4251/wjgo.v15.i12.2064


