Copyright
©The Author(s) 2023.
World J Gastrointest Oncol. Jan 15, 2023; 15(1): 90-101
Published online Jan 15, 2023. doi: 10.4251/wjgo.v15.i1.90
Published online Jan 15, 2023. doi: 10.4251/wjgo.v15.i1.90
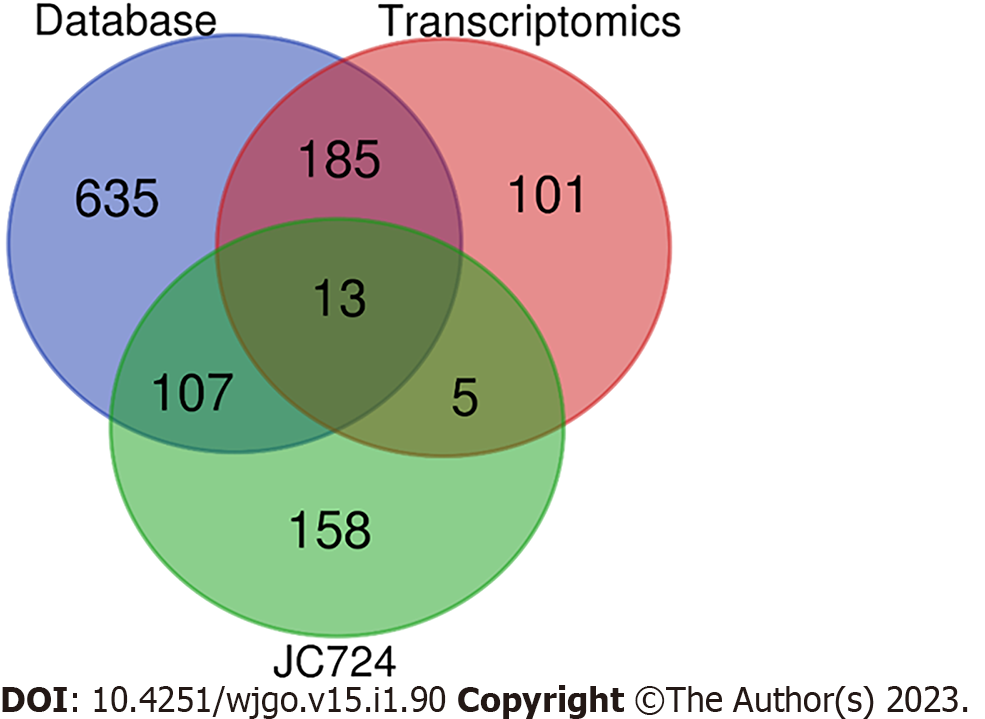
Figure 1 Venn diagram and candidate targets of JC724 and colorectal cancer.
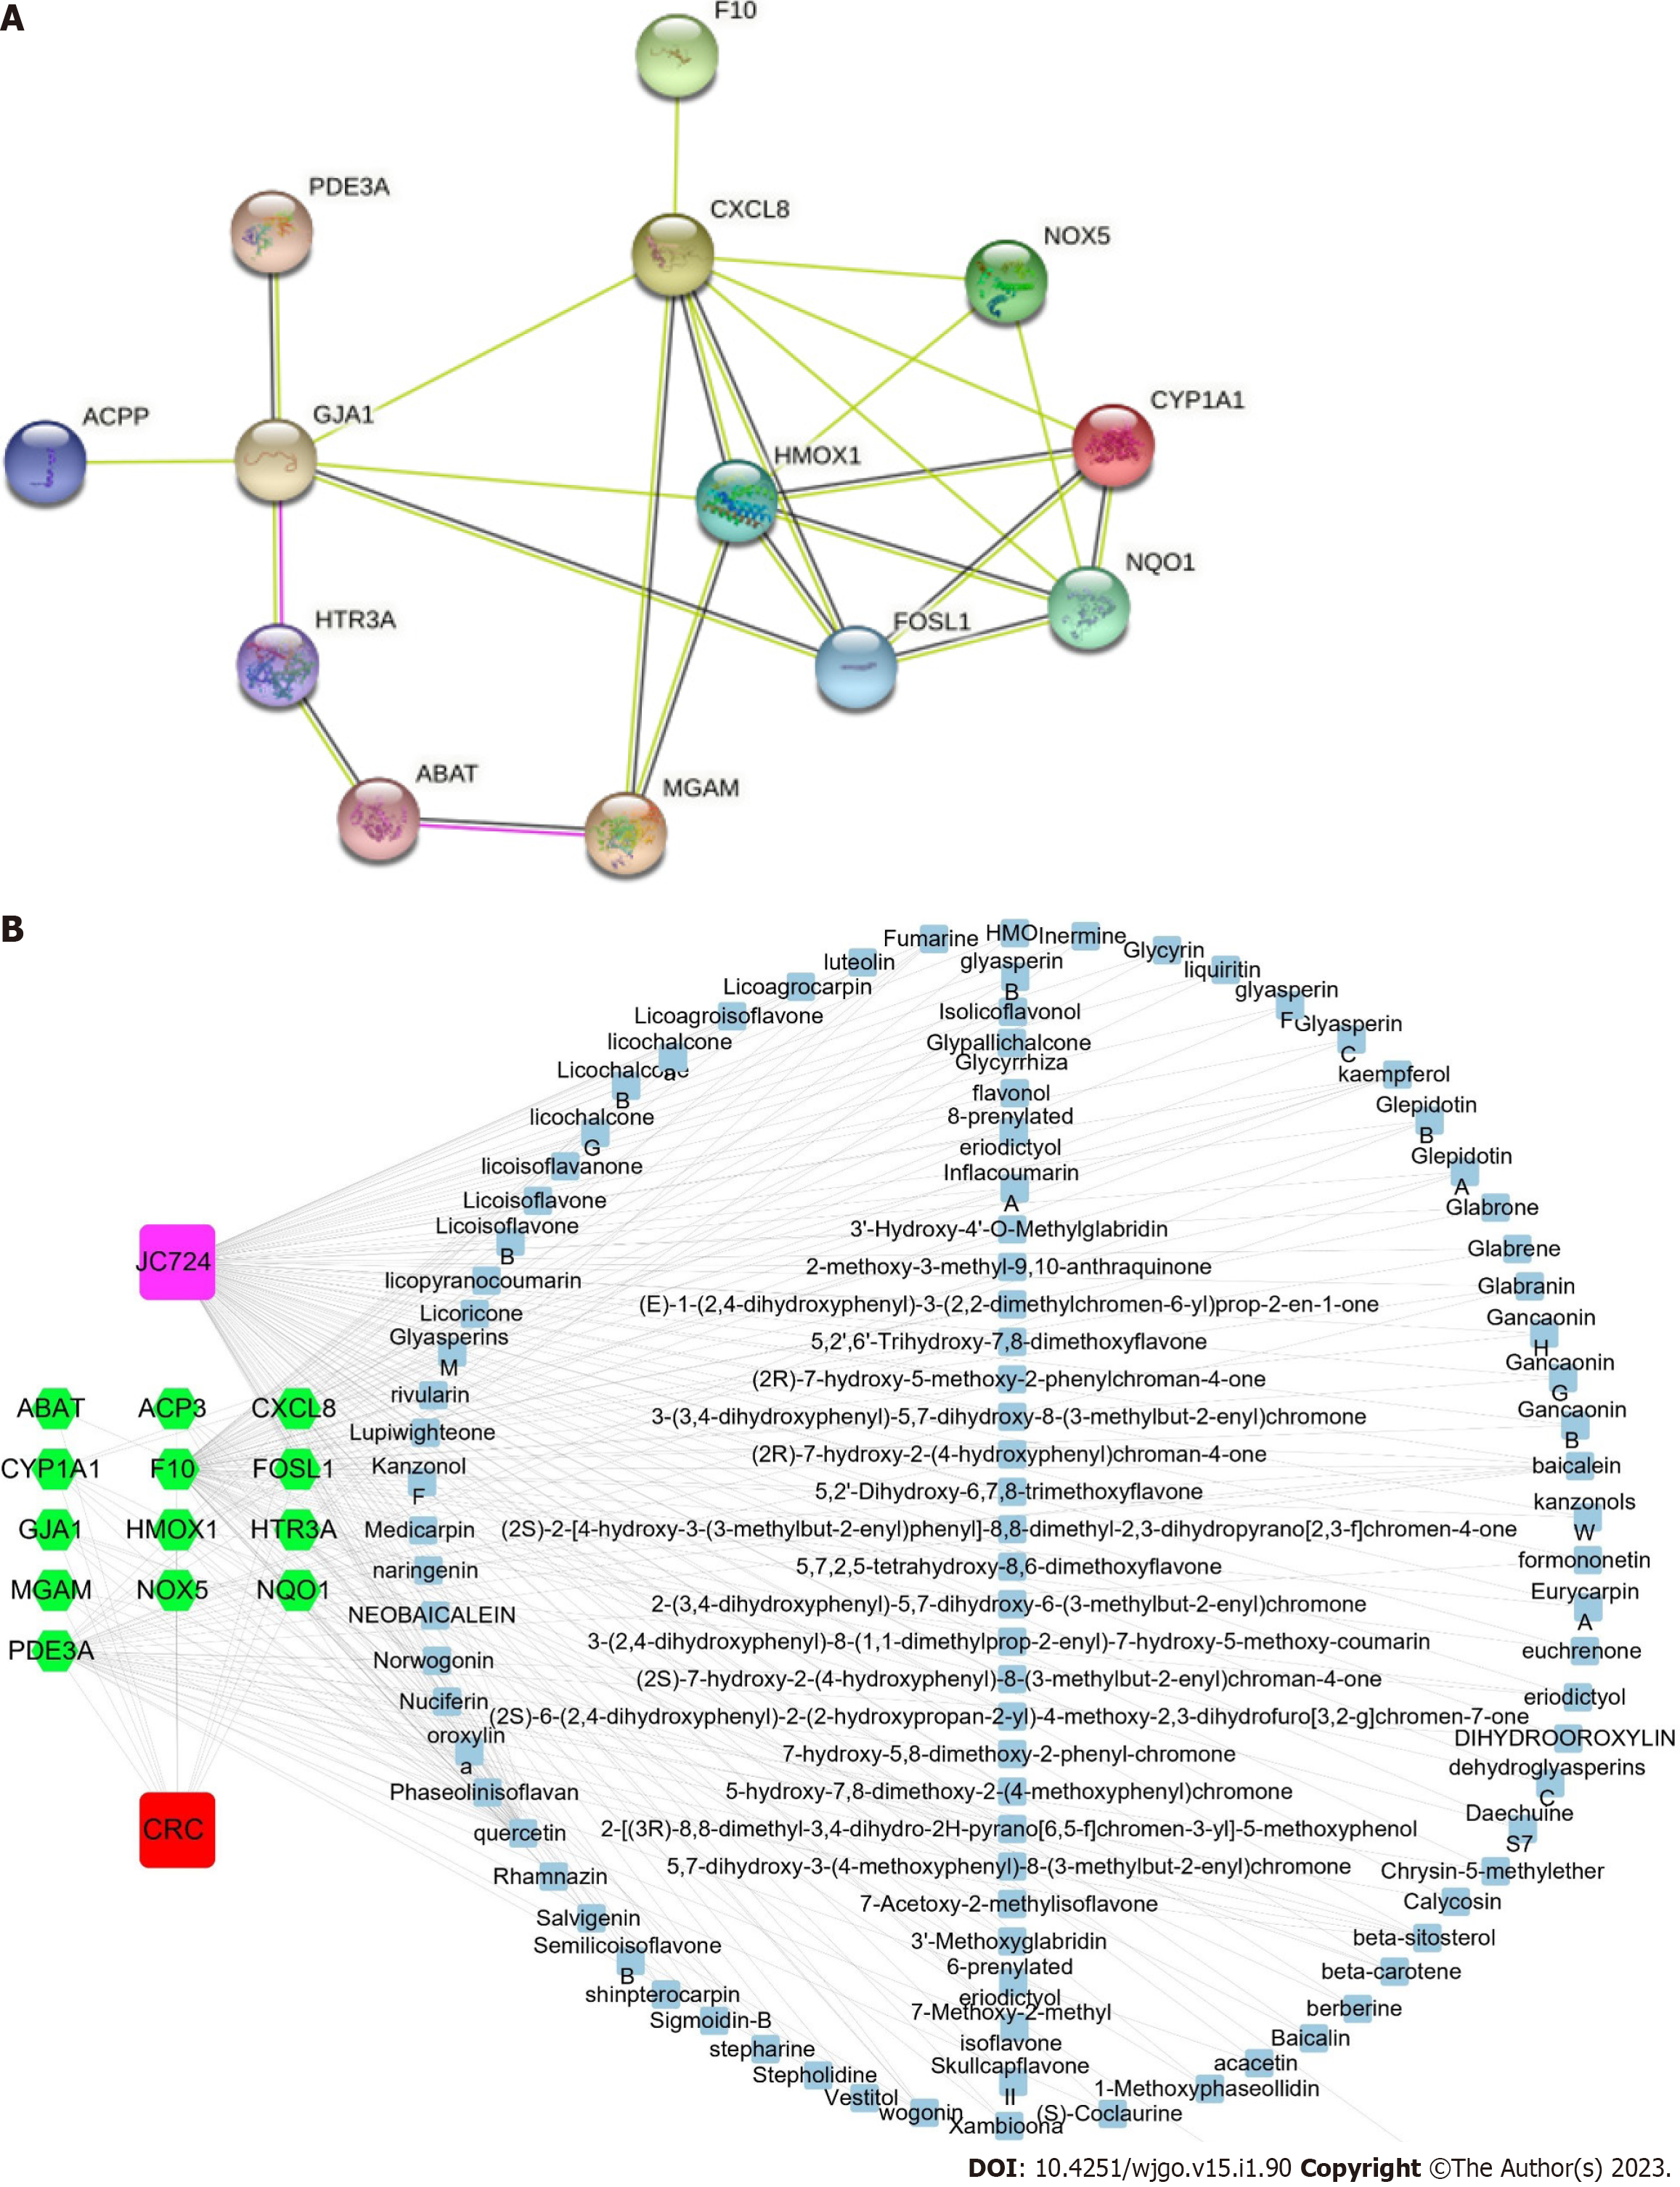
Figure 2 Overlapping genes of protein-protein interaction network and JC724-colorectal cancer targets network anlysis.
A: Protein-protein interaction network of the 13 overlapping genes. The lines represent interaction relationship between the nodes; B: JC724-colorectal cancer (CRC) targets interaction network. The blue square nodes represent active ingredients in JC724, green hexagon nodes represent the 13 overlapping genes, purple square nodes represent heat clearing and detoxifying drug JC724, and red square nodes represent CRC.
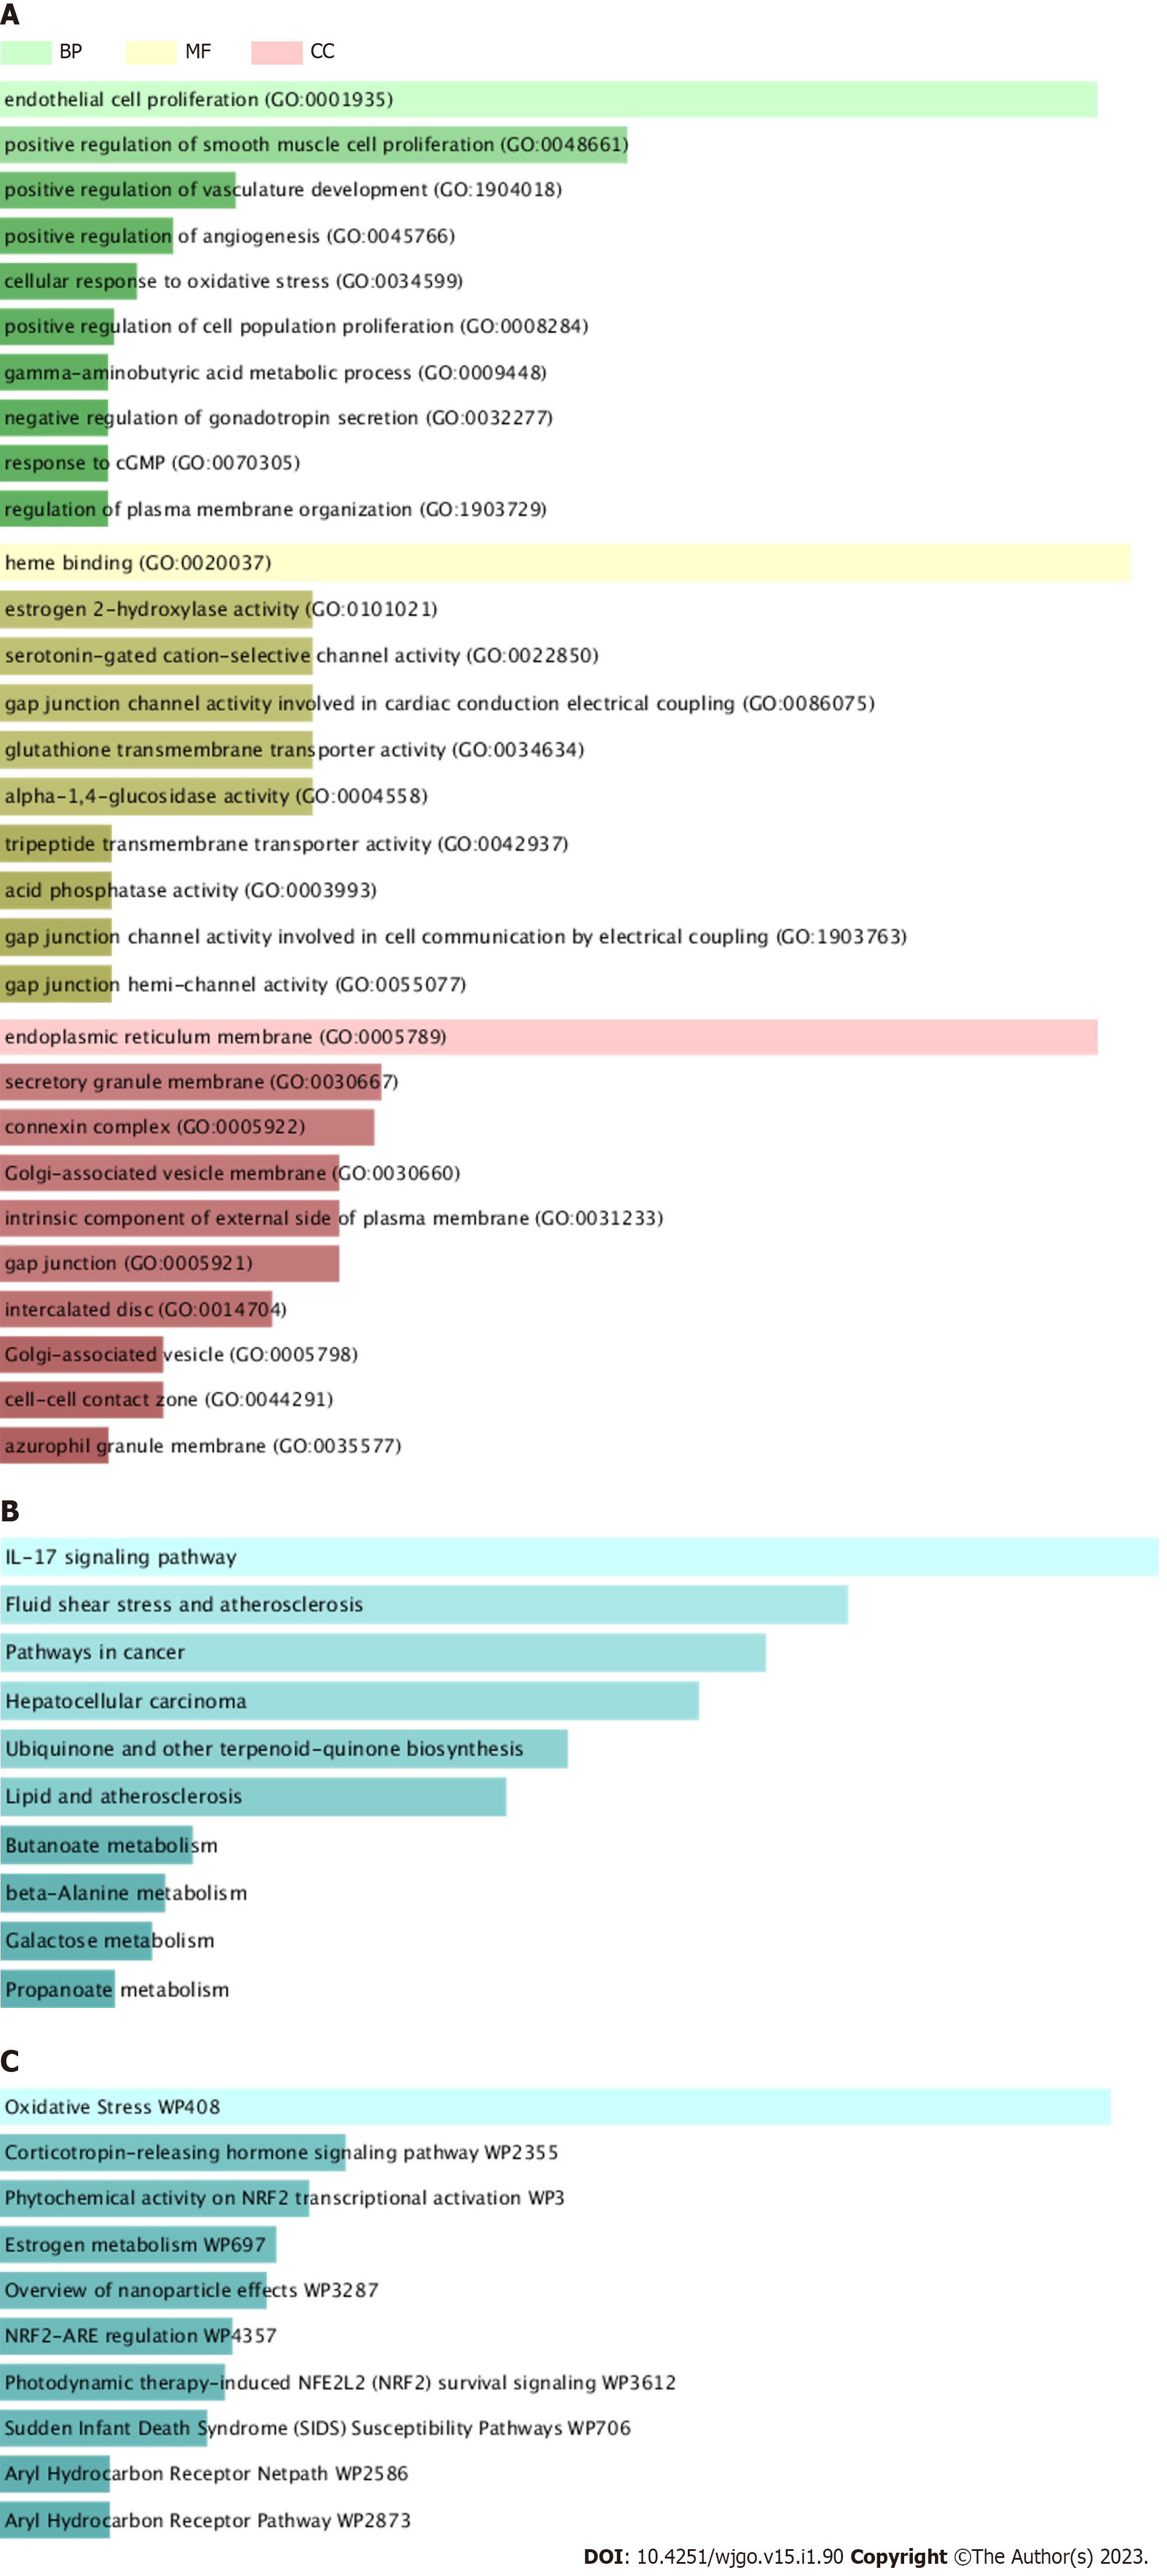
Figure 3 Functional and pathway enrichment analysis of JC724-colorectal cancer targets.
The horizontal axis represents the enrichment scores for each term, while the vertical axis represents the annotations. A: Bar chart of predominant GO terms. Three different colors represent distinct terms of biology process, cellular component, and molecular function; B: Bar chart of KEGG enrichment analysis and essential pathways; C: Bar chart of Wiki pathway analysis. MF: Molecular function; CC: Cellular component; BP: Biological process.
- Citation: Tang HZ, Yang ZP, Lu S, Wang B, Wang YY, Sun XB, Qu JX, Rao BQ. Network pharmacology-based analysis of heat clearing and detoxifying drug JC724 on the treatment of colorectal cancer. World J Gastrointest Oncol 2023; 15(1): 90-101
- URL: https://www.wjgnet.com/1948-5204/full/v15/i1/90.htm
- DOI: https://dx.doi.org/10.4251/wjgo.v15.i1.90


