Copyright
©The Author(s) 2023.
World J Gastrointest Oncol. Jan 15, 2023; 15(1): 171-185
Published online Jan 15, 2023. doi: 10.4251/wjgo.v15.i1.171
Published online Jan 15, 2023. doi: 10.4251/wjgo.v15.i1.171
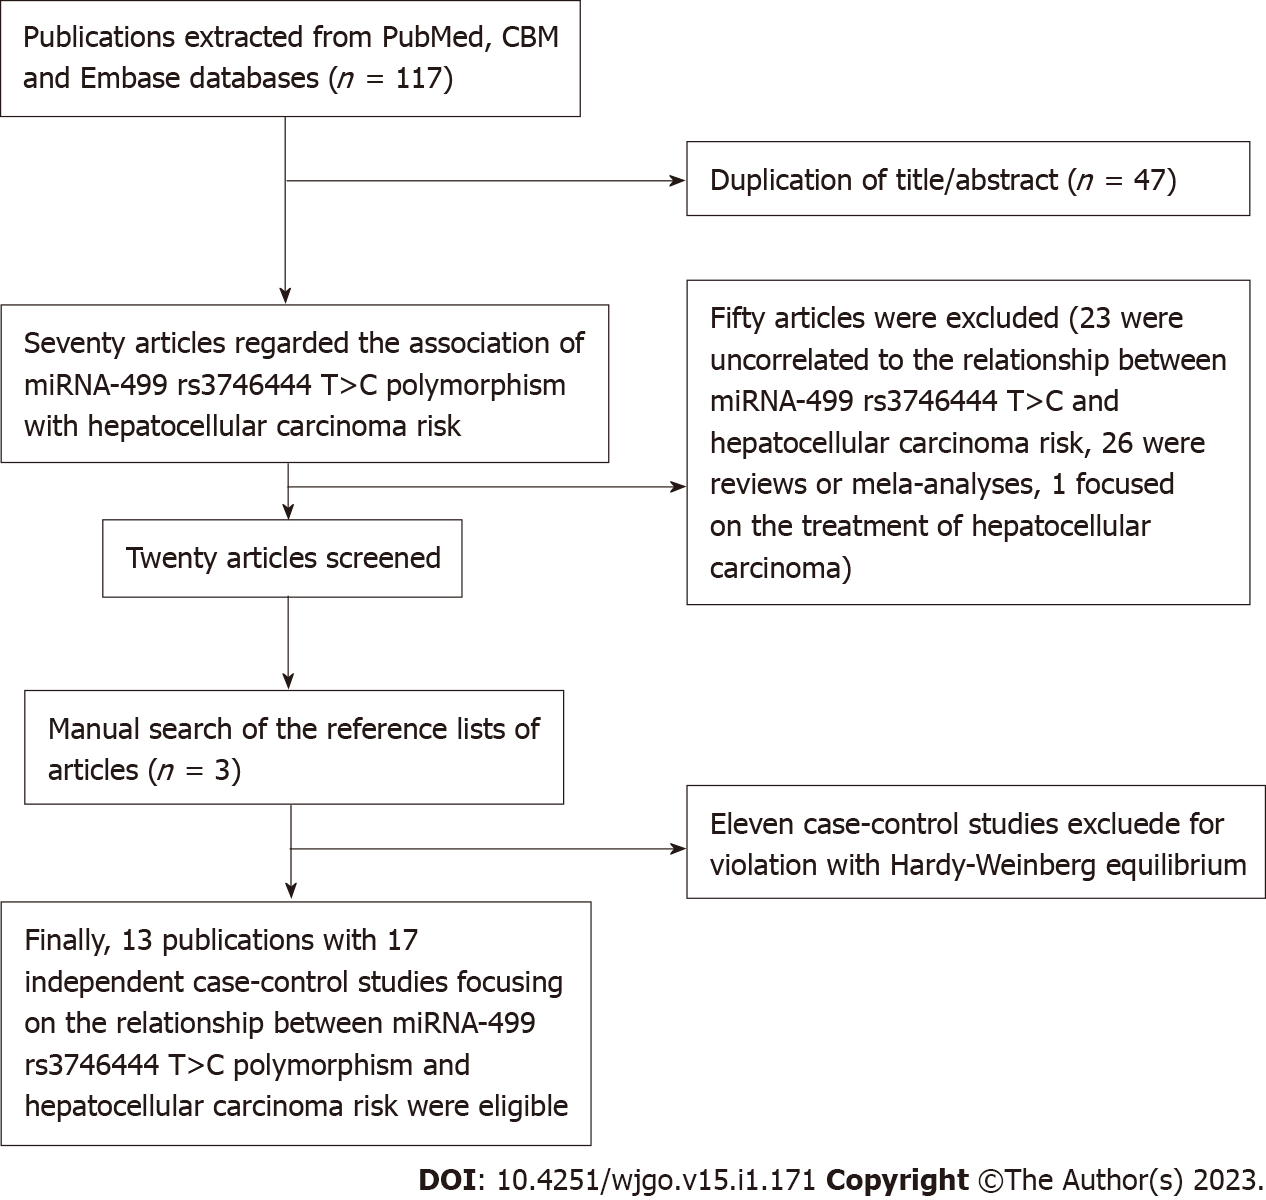
Figure 1 Flow diagram of the meta-analysis.
CBM: Chinese BioMedical Disc; miRNA: MicroRNA.
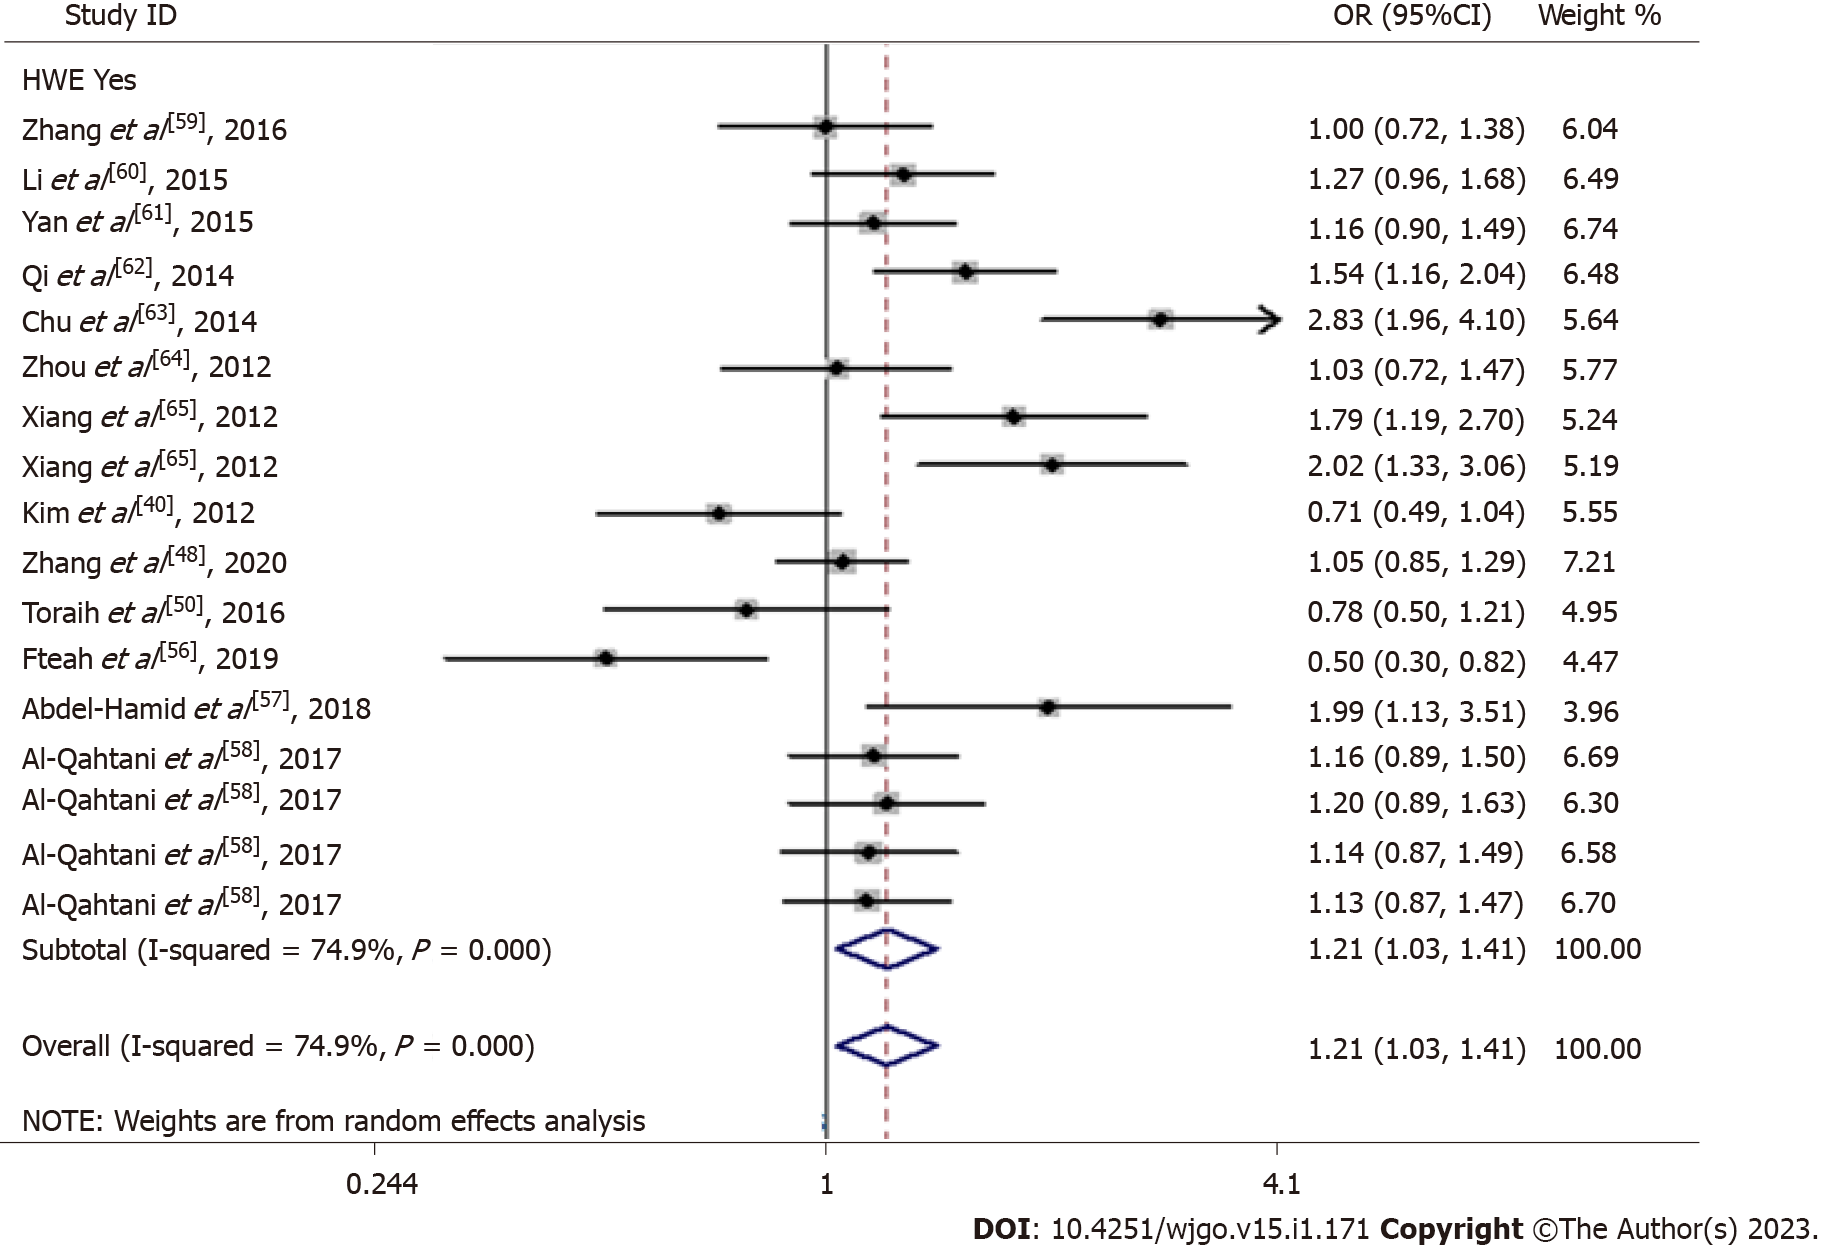
Figure 2 Meta-analysis of the relationship between rs3746444 in microRNA-499 single-nucleotide polymorphism with the risk of hepatocellular carcinoma (C vs T, random-effects model).
OR: Odds ratio; CI: Confidence interval.
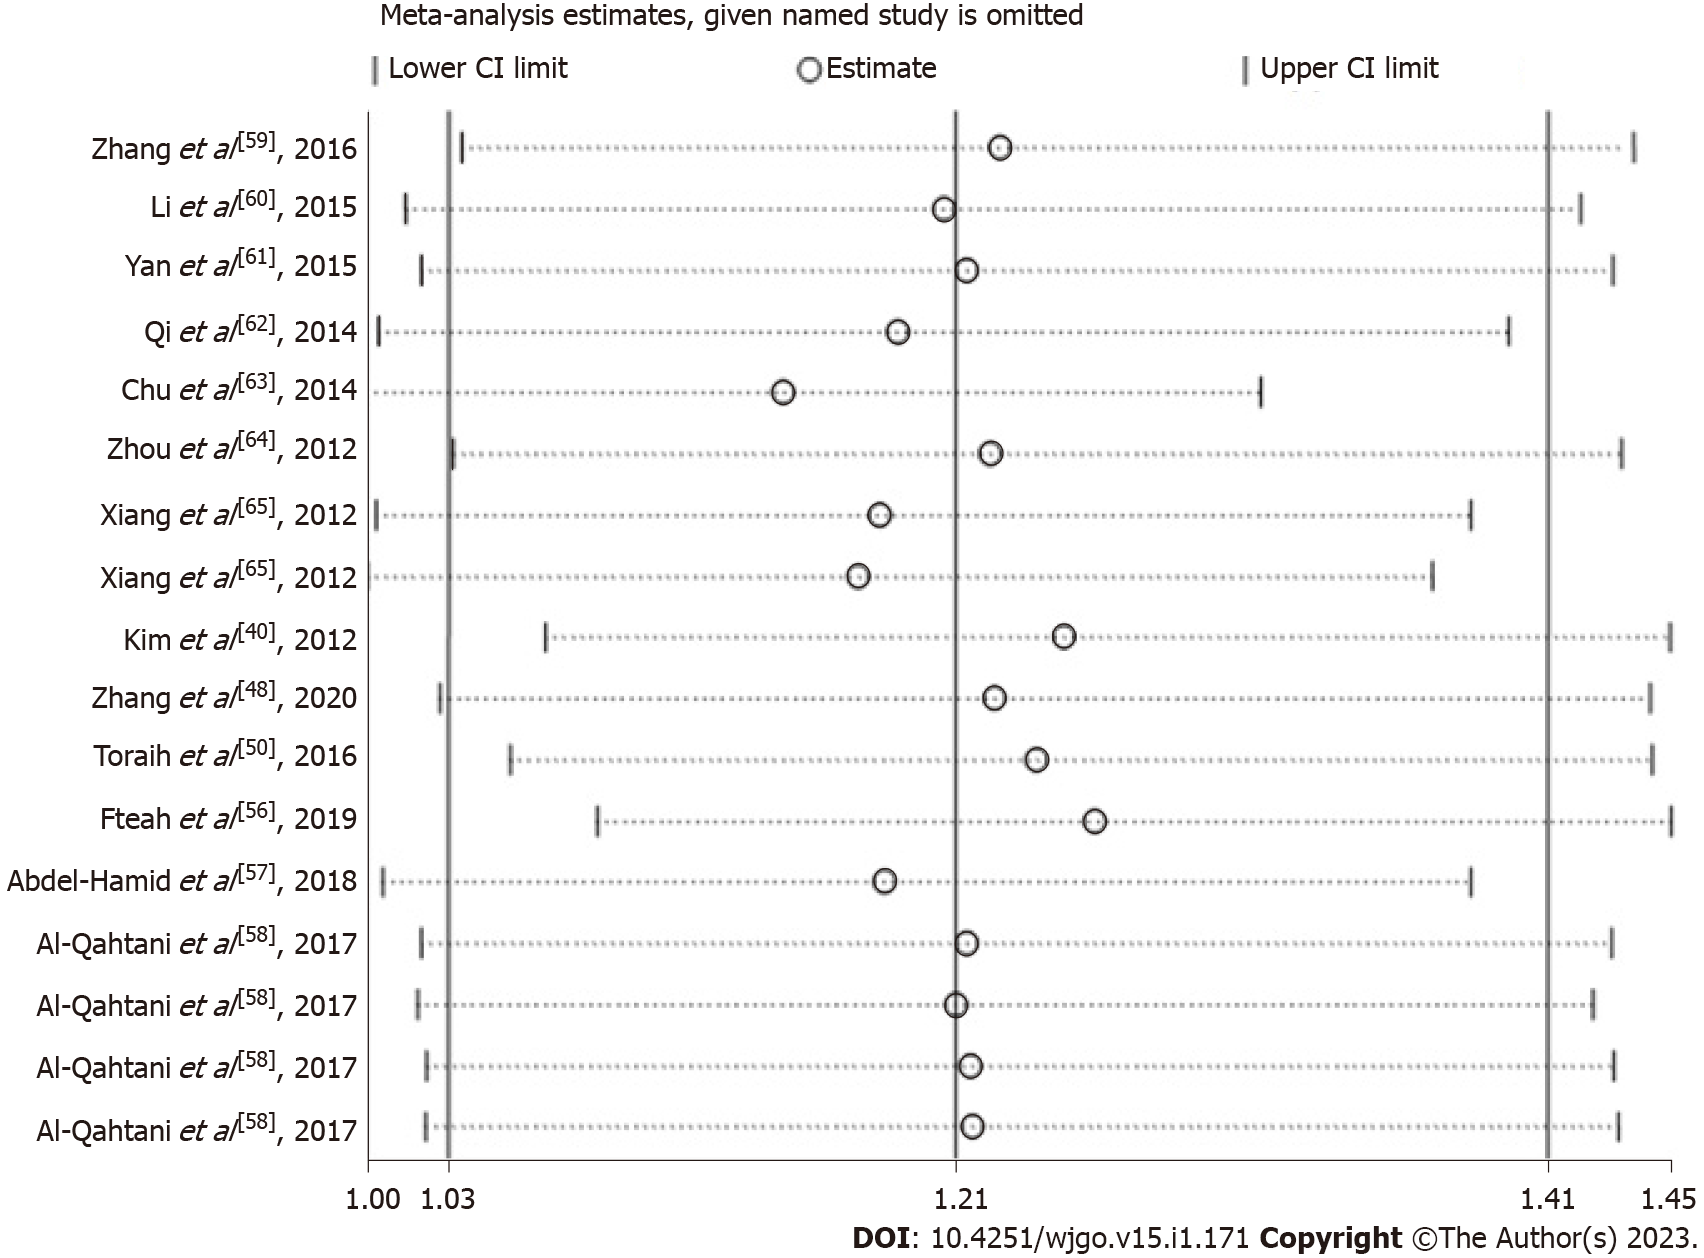
Figure 3 Sensitivity analysis of the influence of C vs T genetic model (random-effects model).
CI: Confidence interval.
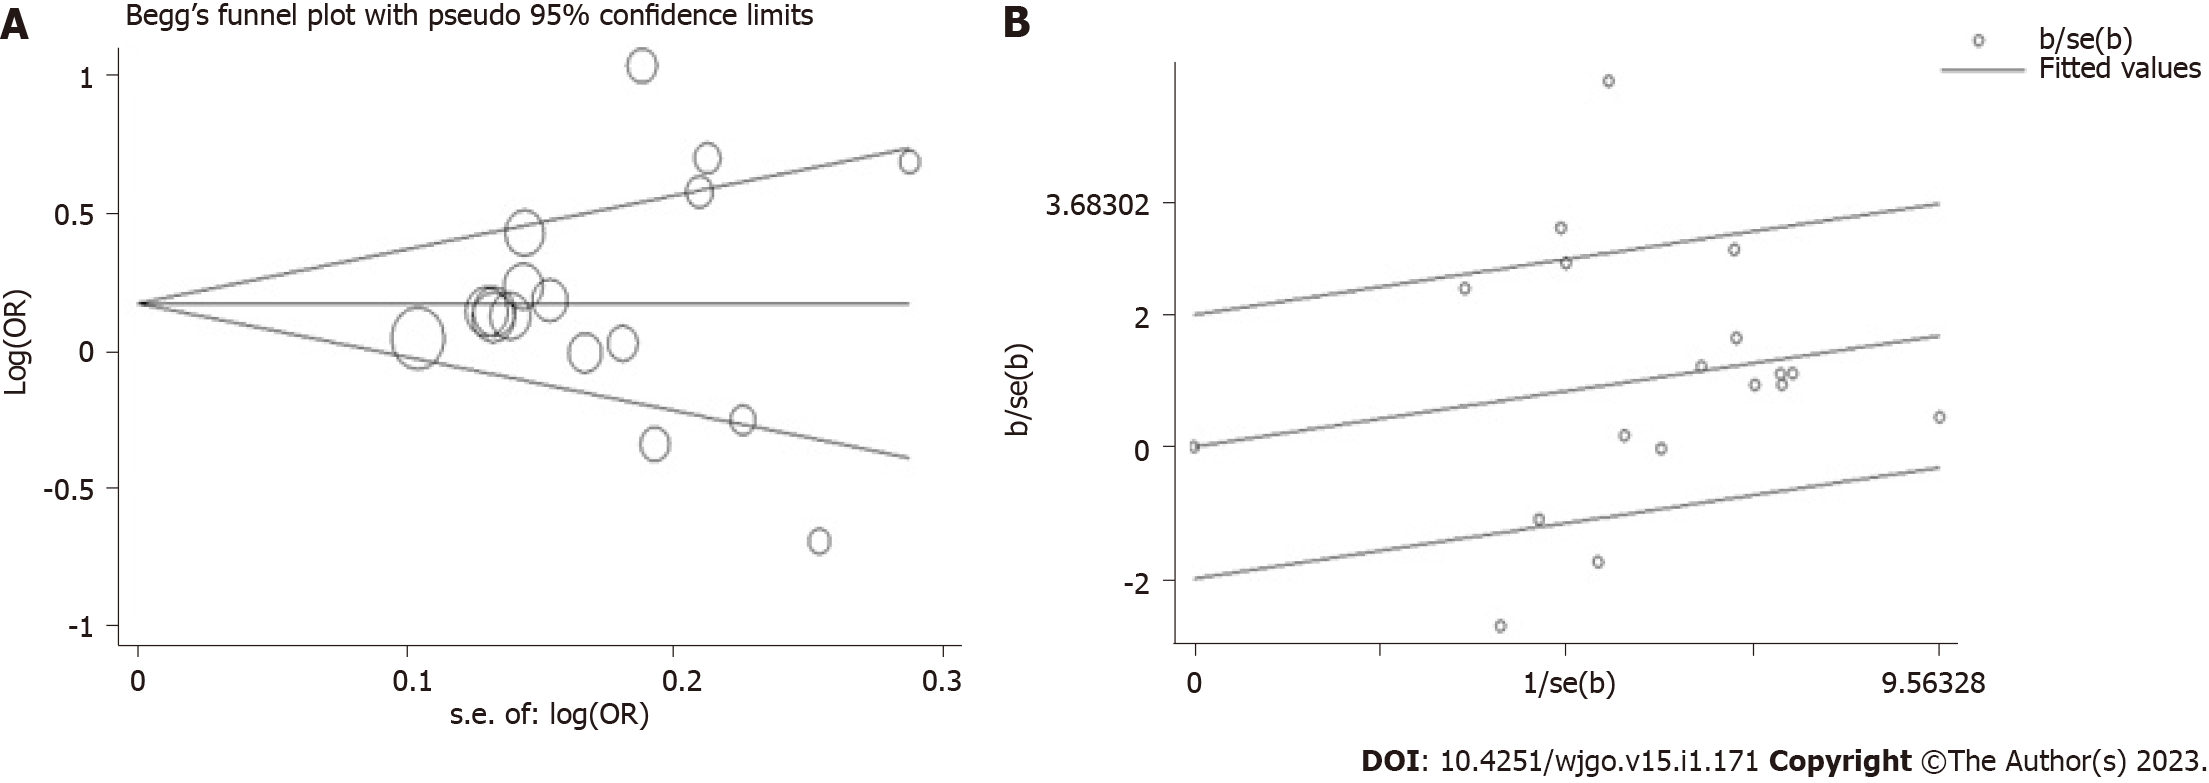
Figure 4 Plot of meta-analysis (C vs T, random-effects model).
A: Begg’s funnel; B: Galbraith radial. OR: Odds ratio.
- Citation: Jiang JK, Chen HS, Tang WF, Chen Y, Lin J. Rs3746444 T>C locus in miR-499 increases the susceptibility to hepatocellular carcinoma: A meta-analysis 14812 subjects. World J Gastrointest Oncol 2023; 15(1): 171-185
- URL: https://www.wjgnet.com/1948-5204/full/v15/i1/171.htm
- DOI: https://dx.doi.org/10.4251/wjgo.v15.i1.171


