Copyright
©The Author(s) 2022.
World J Gastrointest Oncol. Sep 15, 2022; 14(9): 1874-1886
Published online Sep 15, 2022. doi: 10.4251/wjgo.v14.i9.1874
Published online Sep 15, 2022. doi: 10.4251/wjgo.v14.i9.1874
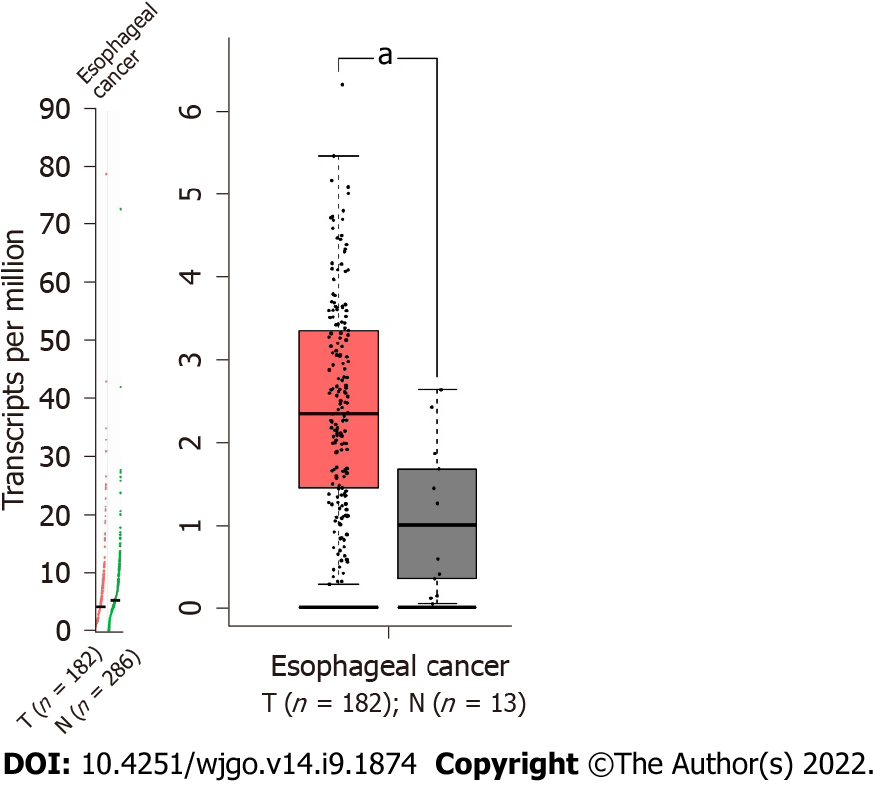
Figure 1 The expression of Twist in esophageal cancer (Gene expression profiling interactive analysis 2).
aP < 0.05.
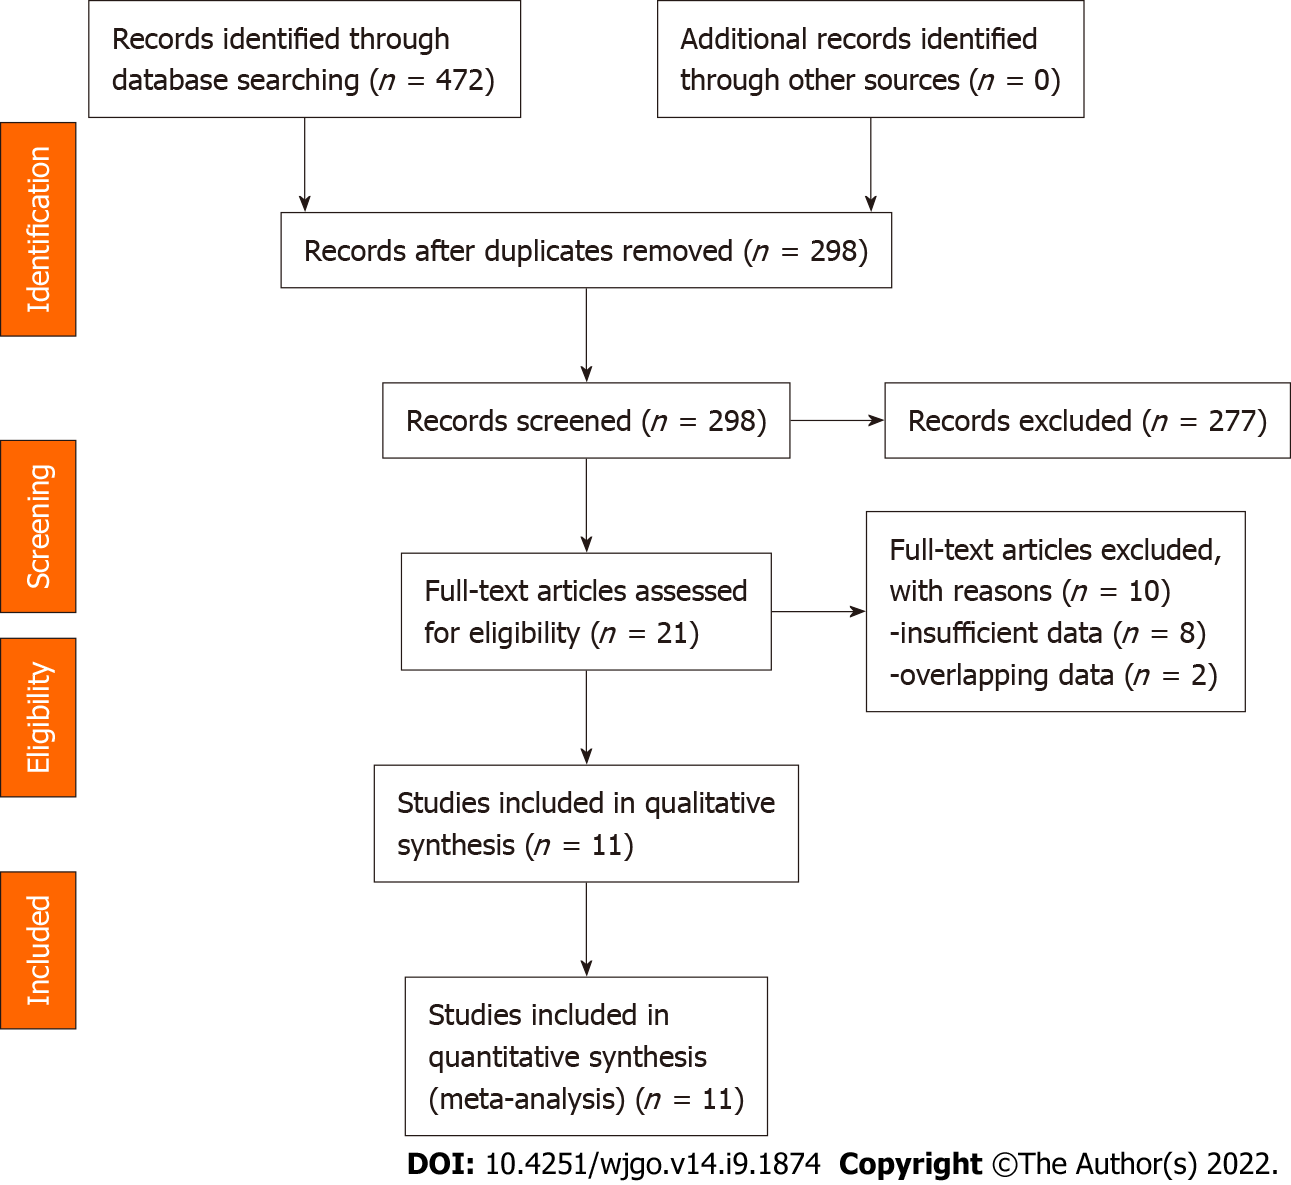
Figure 2 PRISMA flow diagram.
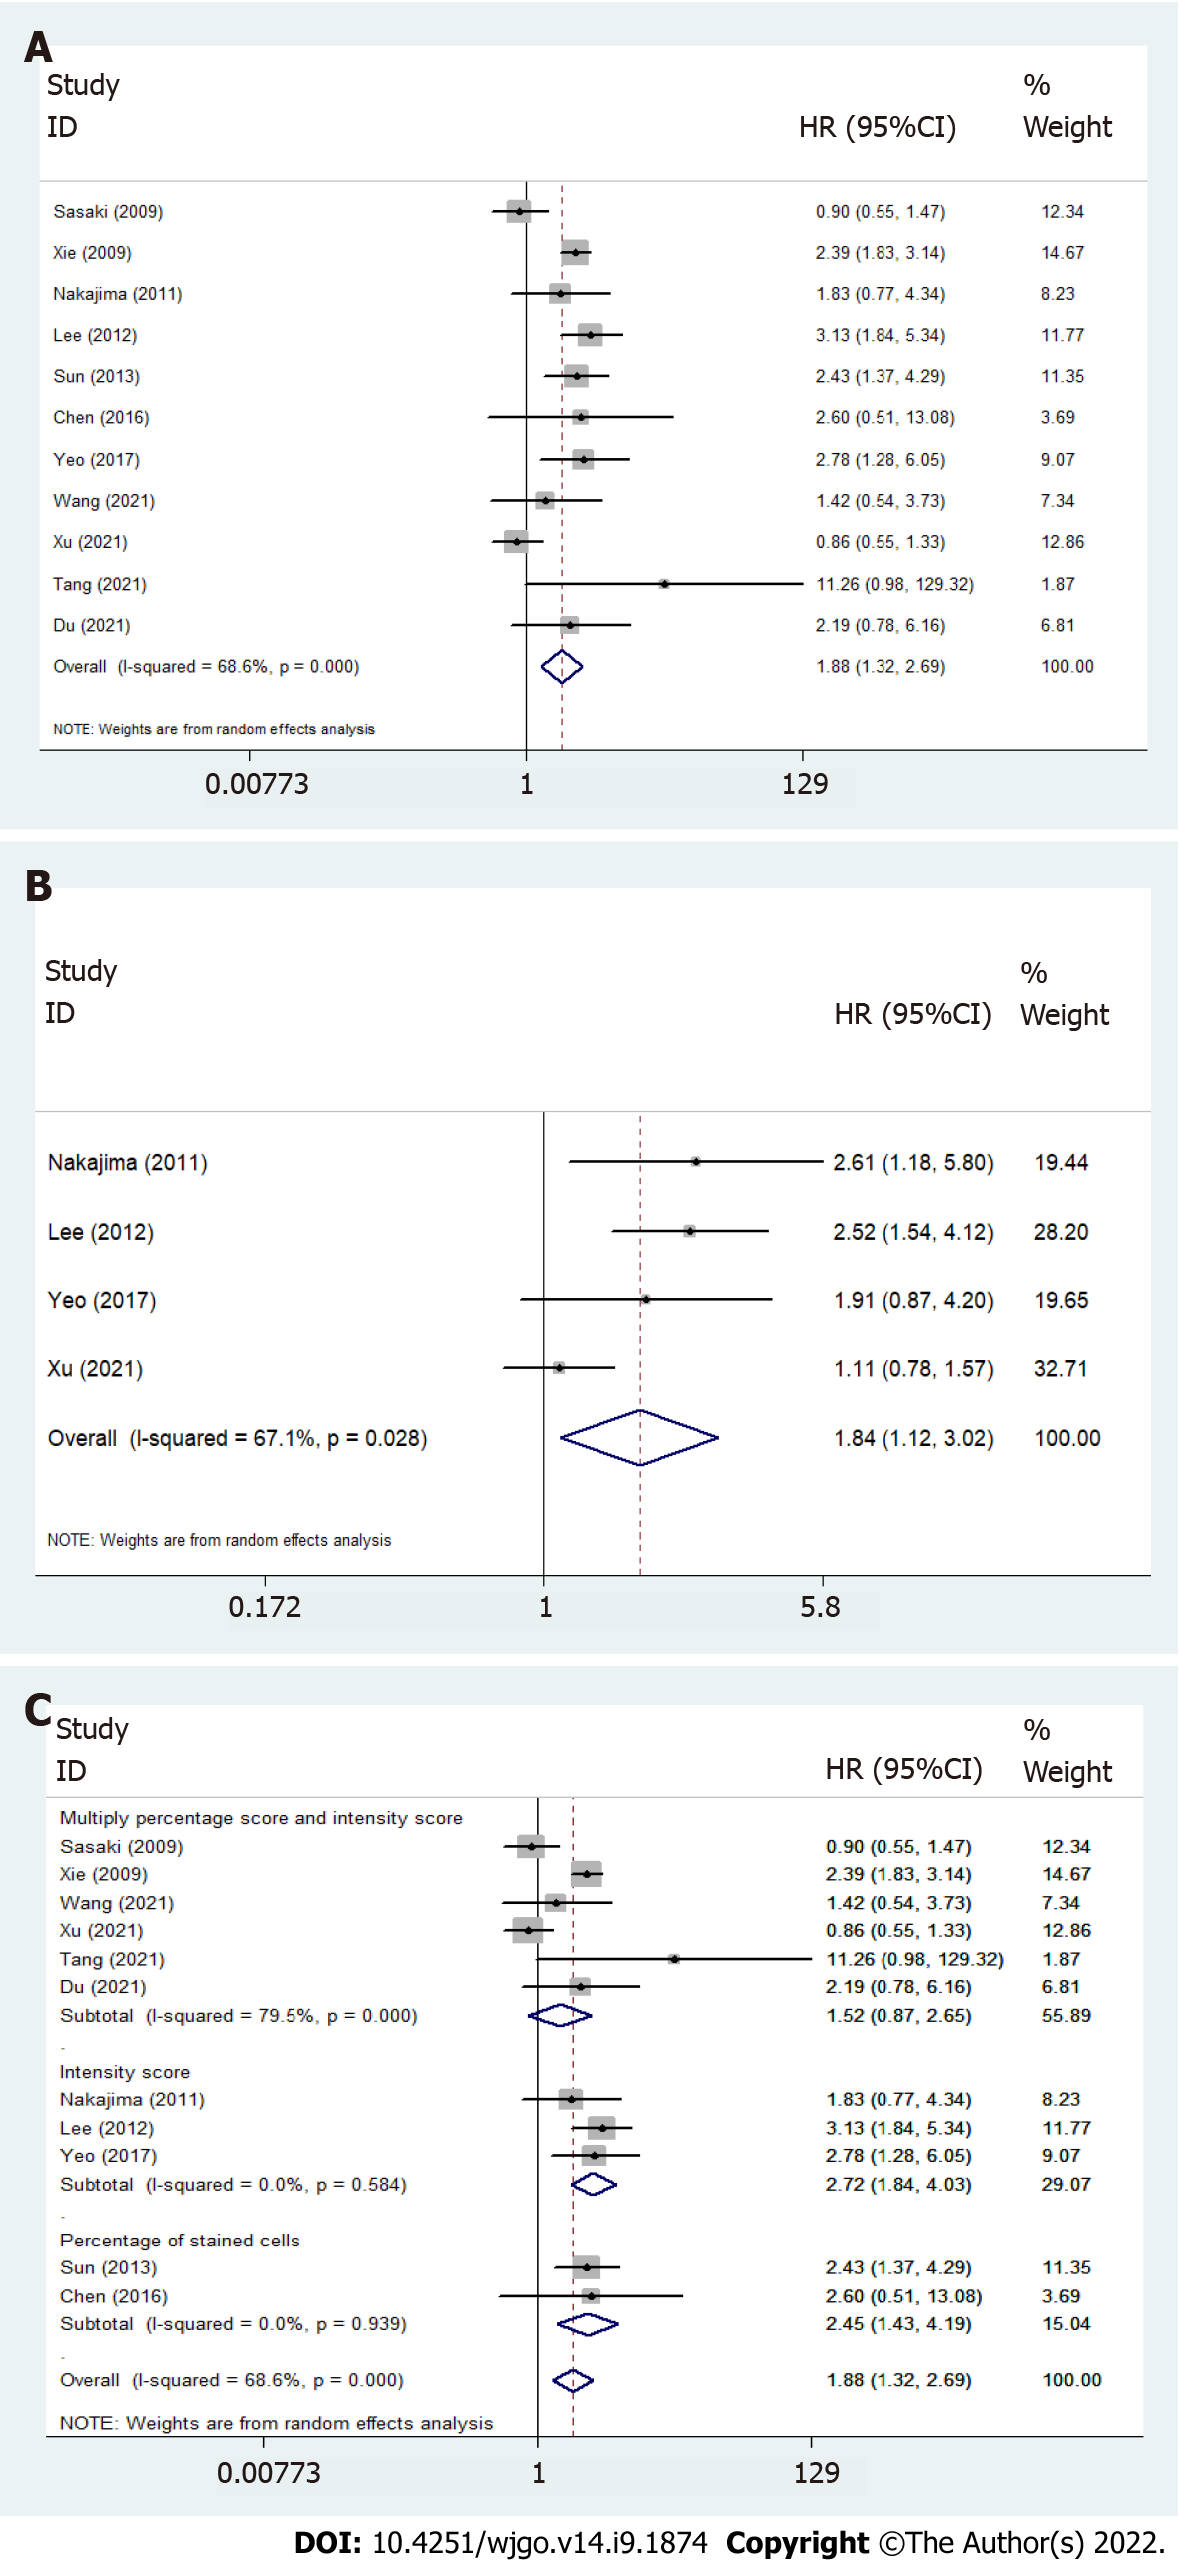
Figure 3 Forest plots of the association between Twist overexpression and poor overall survival and disease-free survival/relapse-free survival/progression-free survival of patients with esophageal cancer.
A: Poor overall survival (OS); B: Disease-free survival/relapse-free survival/progression-free survival; C: Subgroup analysis of OS based on the detection method.
Figure 4 Forest plots showed that Twist over-expression was correlated with T stage, N stage, M stage, tumor, node and metastasis stage, and clinical stage.
A: T stage; B: N stage; C: M stage; D: Tumor, node and metastasis stage; E: Clinical stage.
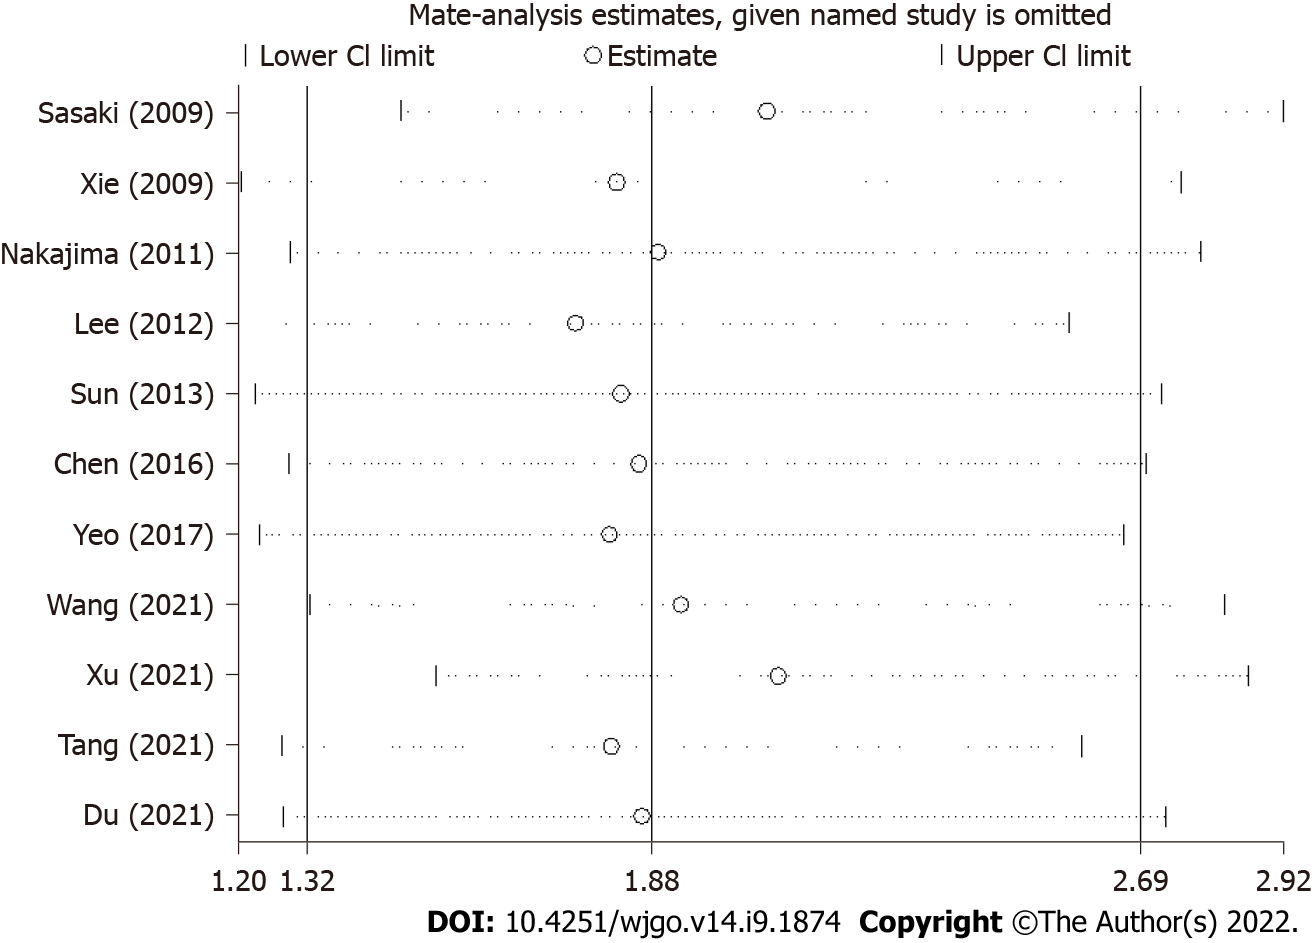
Figure 5 Sensitivity analysis of the association between Twist expression and overall survival.
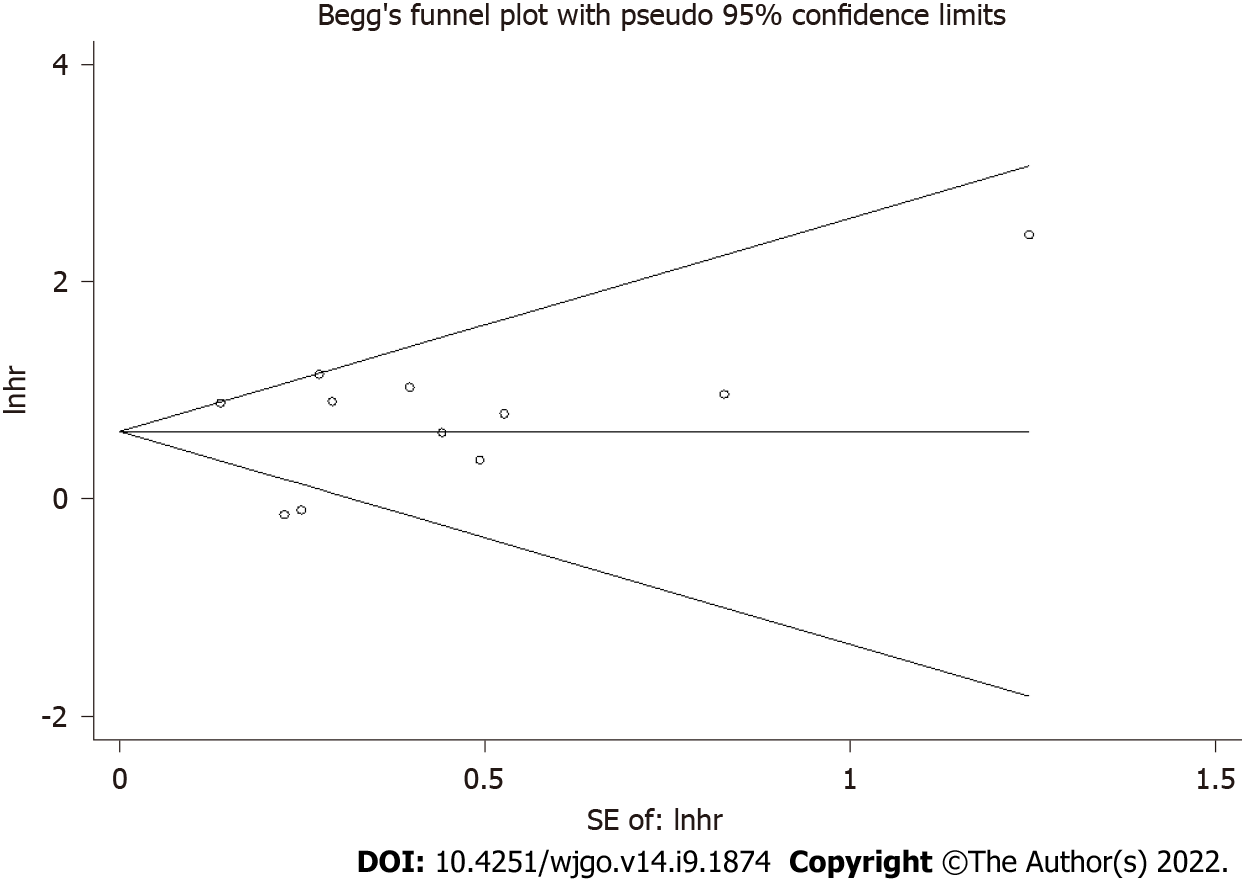
Figure 6 The Begg’s funnel plot for overall survival.
- Citation: Song WP, Wang SY, Zhou SC, Wu DS, Xie JY, Liu TT, Wu XZ, Che GW. Prognostic and clinicopathological value of Twist expression in esophageal cancer: A meta-analysis. World J Gastrointest Oncol 2022; 14(9): 1874-1886
- URL: https://www.wjgnet.com/1948-5204/full/v14/i9/1874.htm
- DOI: https://dx.doi.org/10.4251/wjgo.v14.i9.1874


