Copyright
©The Author(s) 2022.
World J Gastrointest Oncol. May 15, 2022; 14(5): 1050-1056
Published online May 15, 2022. doi: 10.4251/wjgo.v14.i5.1050
Published online May 15, 2022. doi: 10.4251/wjgo.v14.i5.1050
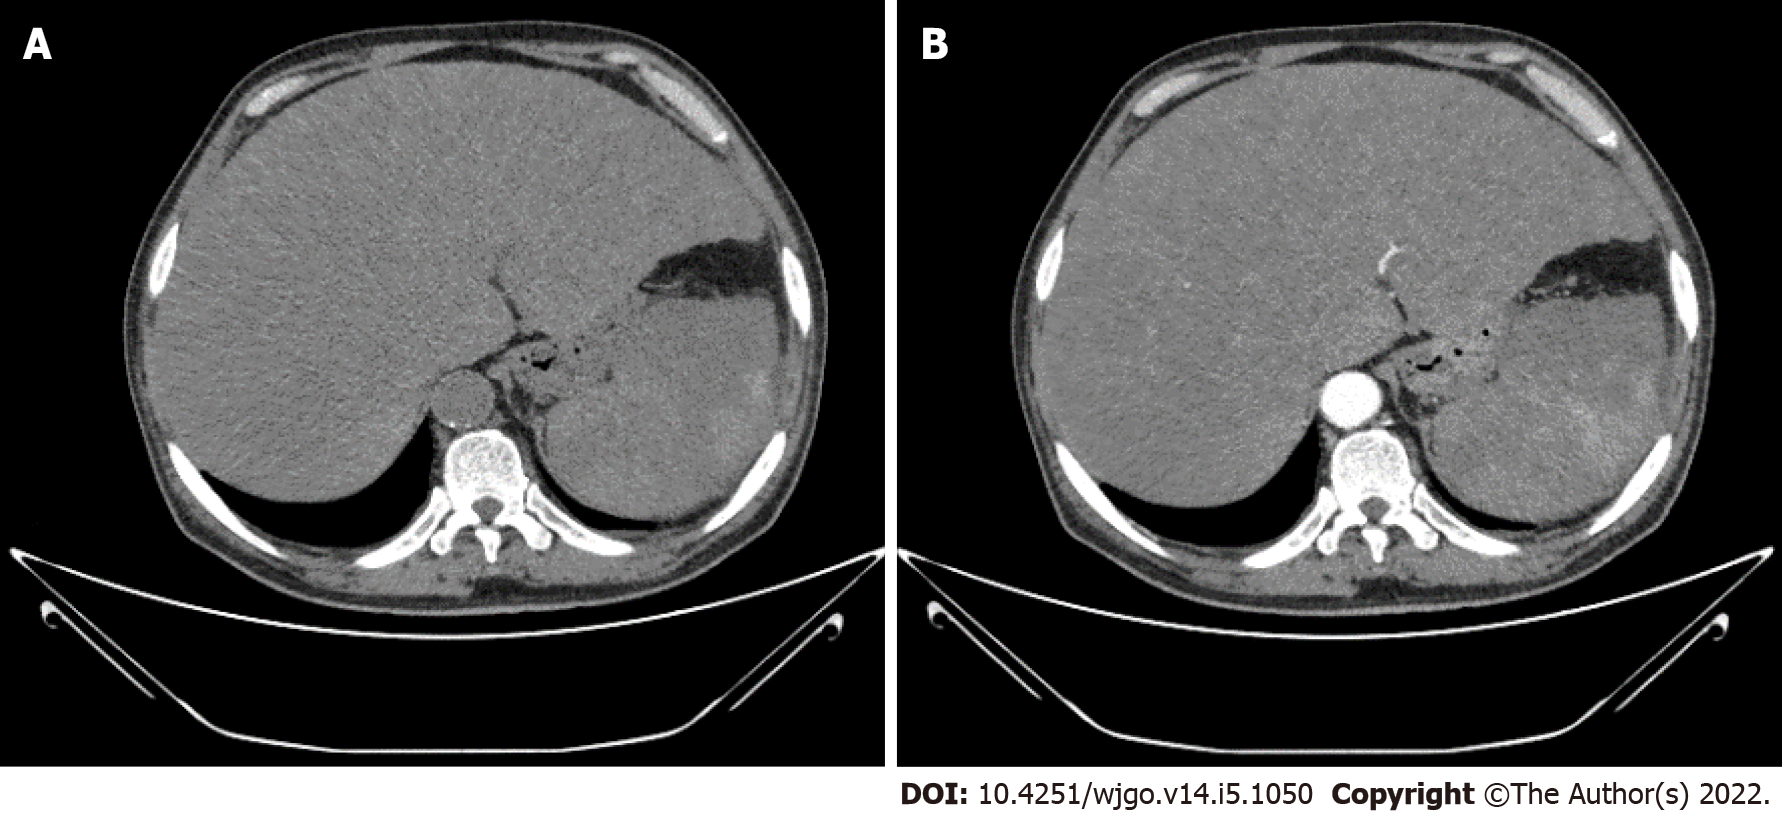
Figure 1 Abdominal plain computed tomography and contrast-enhanced computed tomography images.
A: Abdominal plain computed tomography (CT) image; B: Contrast-enhanced CT image. Abdominal plain CT and contrast-enhanced CT showed hepatomegaly and splenomegaly and diffuse low-density shadows distributed in the liver and spleen. Contrast-enhanced CT revealed diffuse, hypodense, nodular or flake shadows in the liver and heterogeneous enhancement in the spleen.
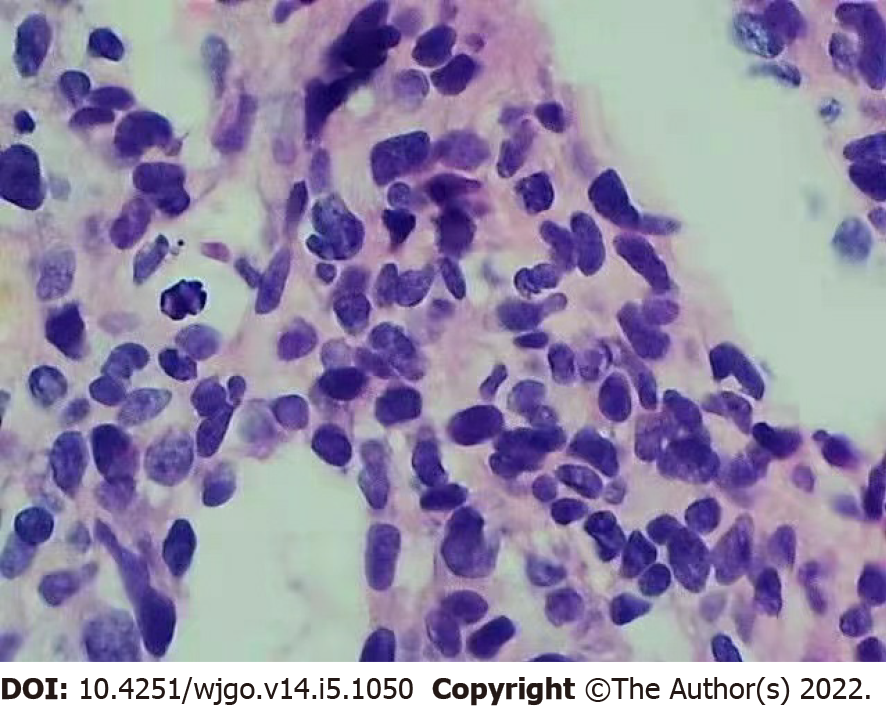
Figure 2 Haematoxylin and eosin-stained liver biopsy (× 400) demonstrating significant cytological atypia with anastomosing channels.
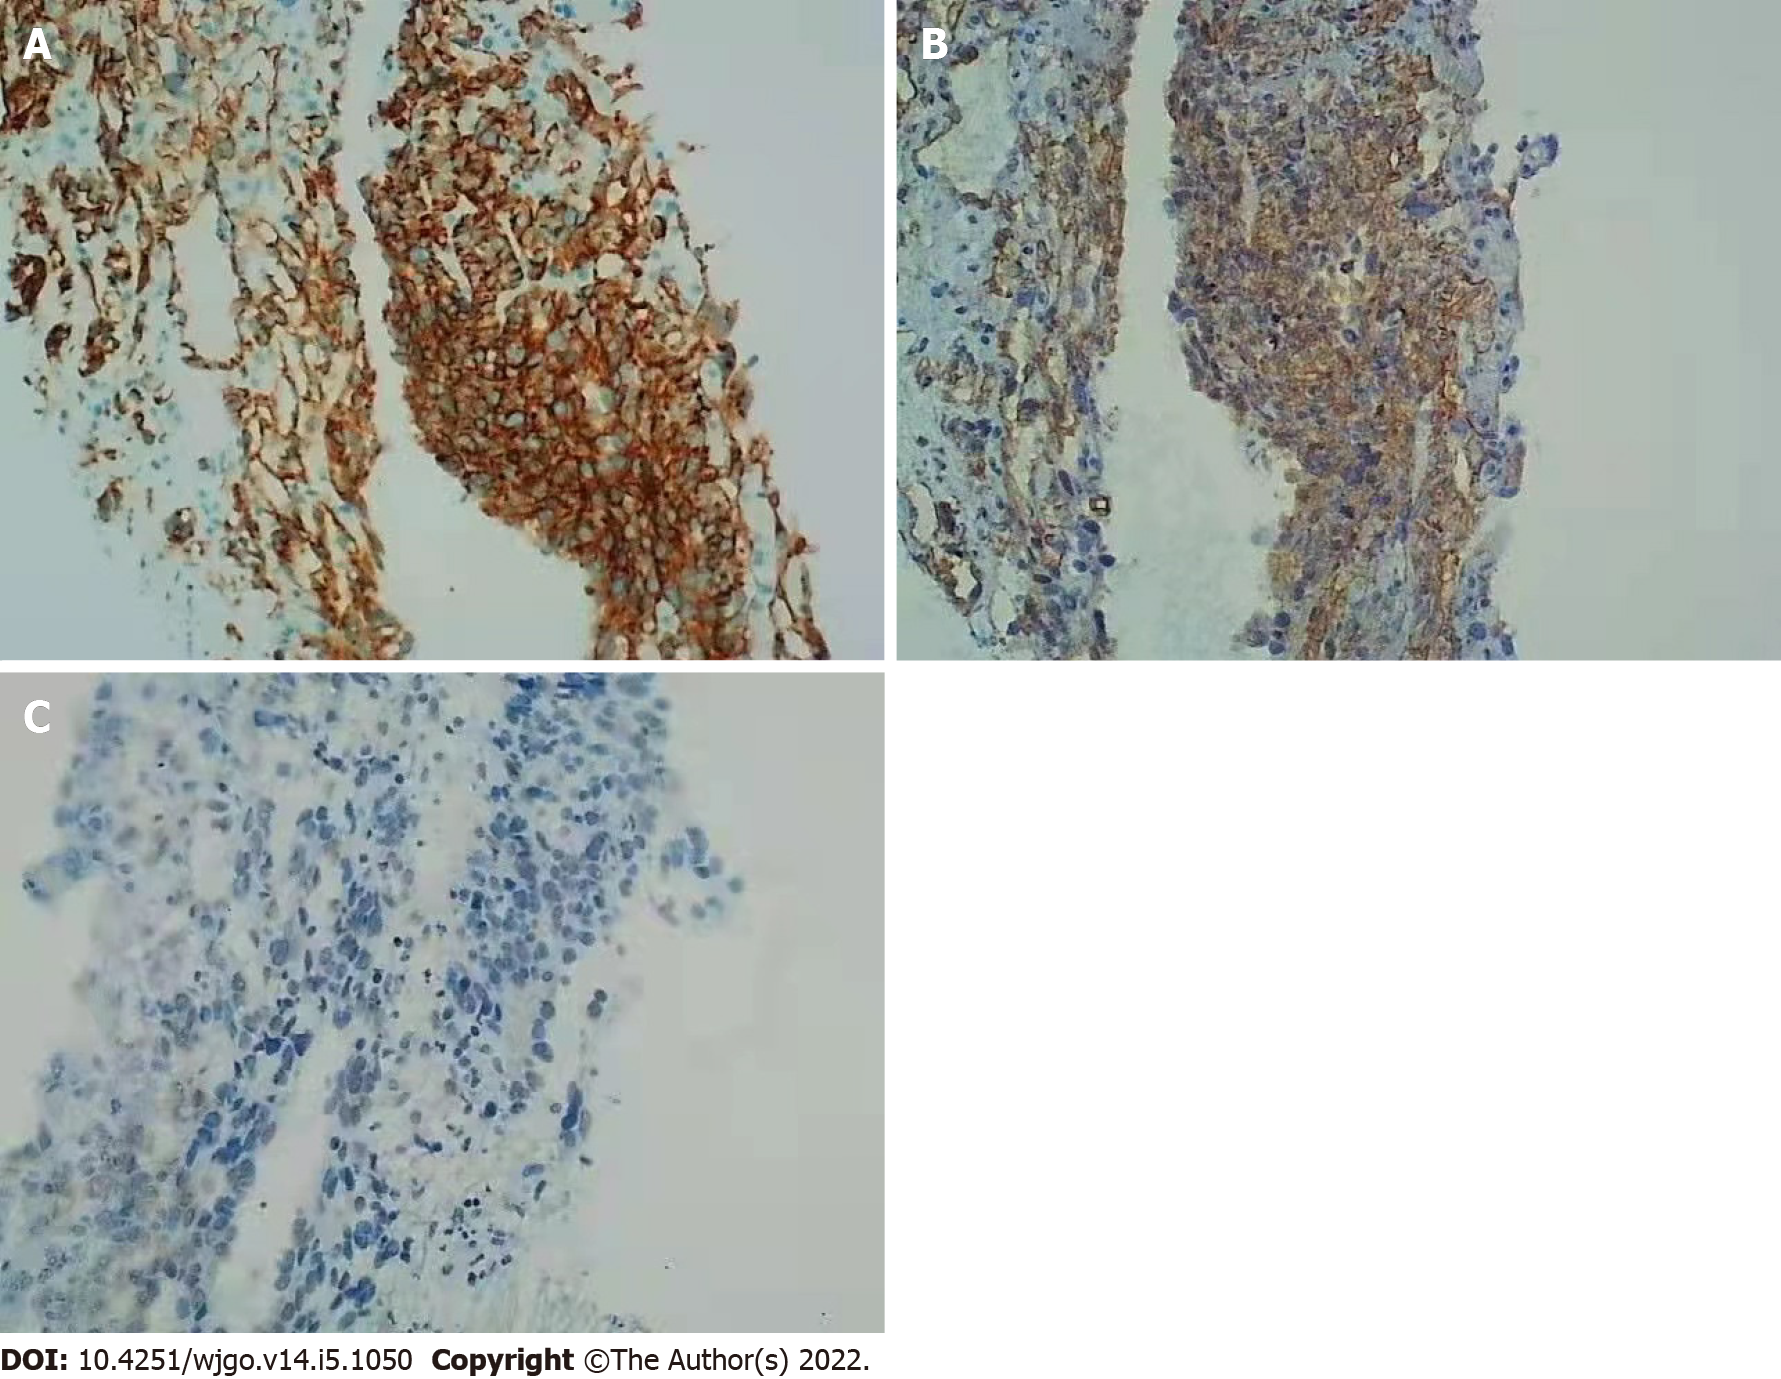
Figure 3 Immunohistochemical staining.
The hepatic angiosarcoma components are positive for CD31 and CD34 and weakly positive for electroretinography (ERG) (original magnification, × 200). A: CD31; B: CD34; C: ERG.
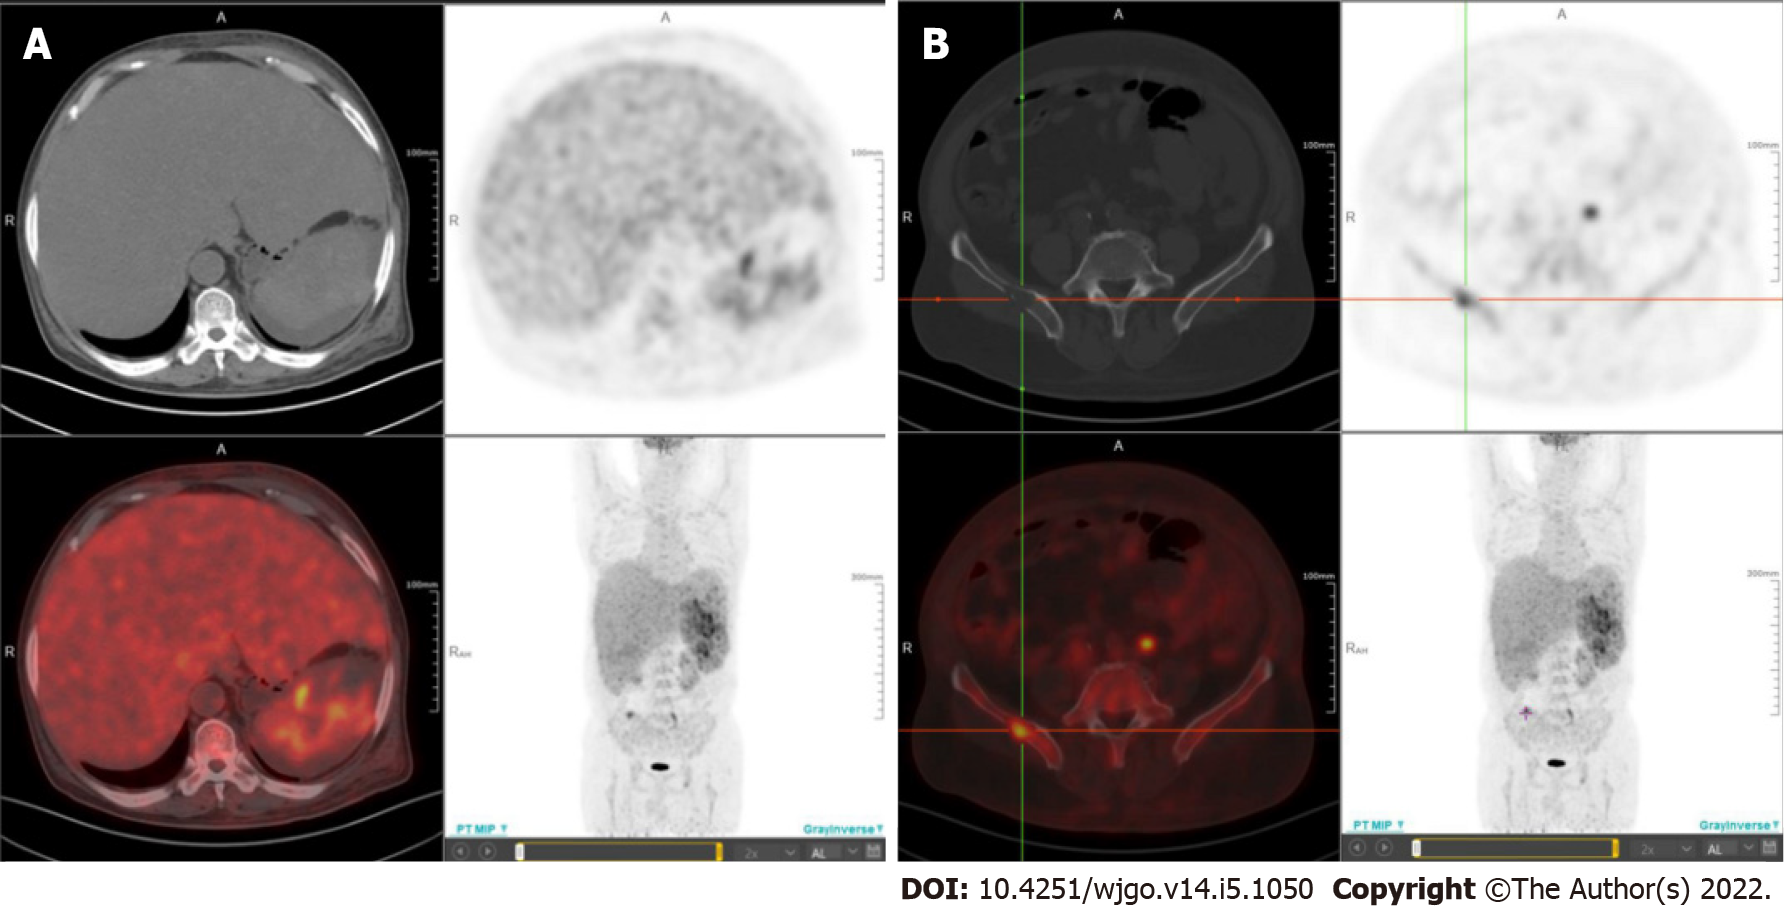
Figure 4 18F-fluorodeoxyglucose positron emission tomography/computed tomography images.
A: 18F-fluorodeoxyglucose (18F-FDG) positron emission tomography/computed tomography (PET/CT) images show marked FDG accumulation within the liver and spleen; B: 18F-FDG PET/CT images show marked FDG accumulation within the right ilium.
- Citation: Ha FS, Liu H, Han T, Song DZ. Primary hepatic angiosarcoma manifesting as hepatic sinusoidal obstruction syndrome: A case report. World J Gastrointest Oncol 2022; 14(5): 1050-1056
- URL: https://www.wjgnet.com/1948-5204/full/v14/i5/1050.htm
- DOI: https://dx.doi.org/10.4251/wjgo.v14.i5.1050


