Copyright
©The Author(s) 2022.
World J Gastrointest Oncol. May 15, 2022; 14(5): 1037-1049
Published online May 15, 2022. doi: 10.4251/wjgo.v14.i5.1037
Published online May 15, 2022. doi: 10.4251/wjgo.v14.i5.1037
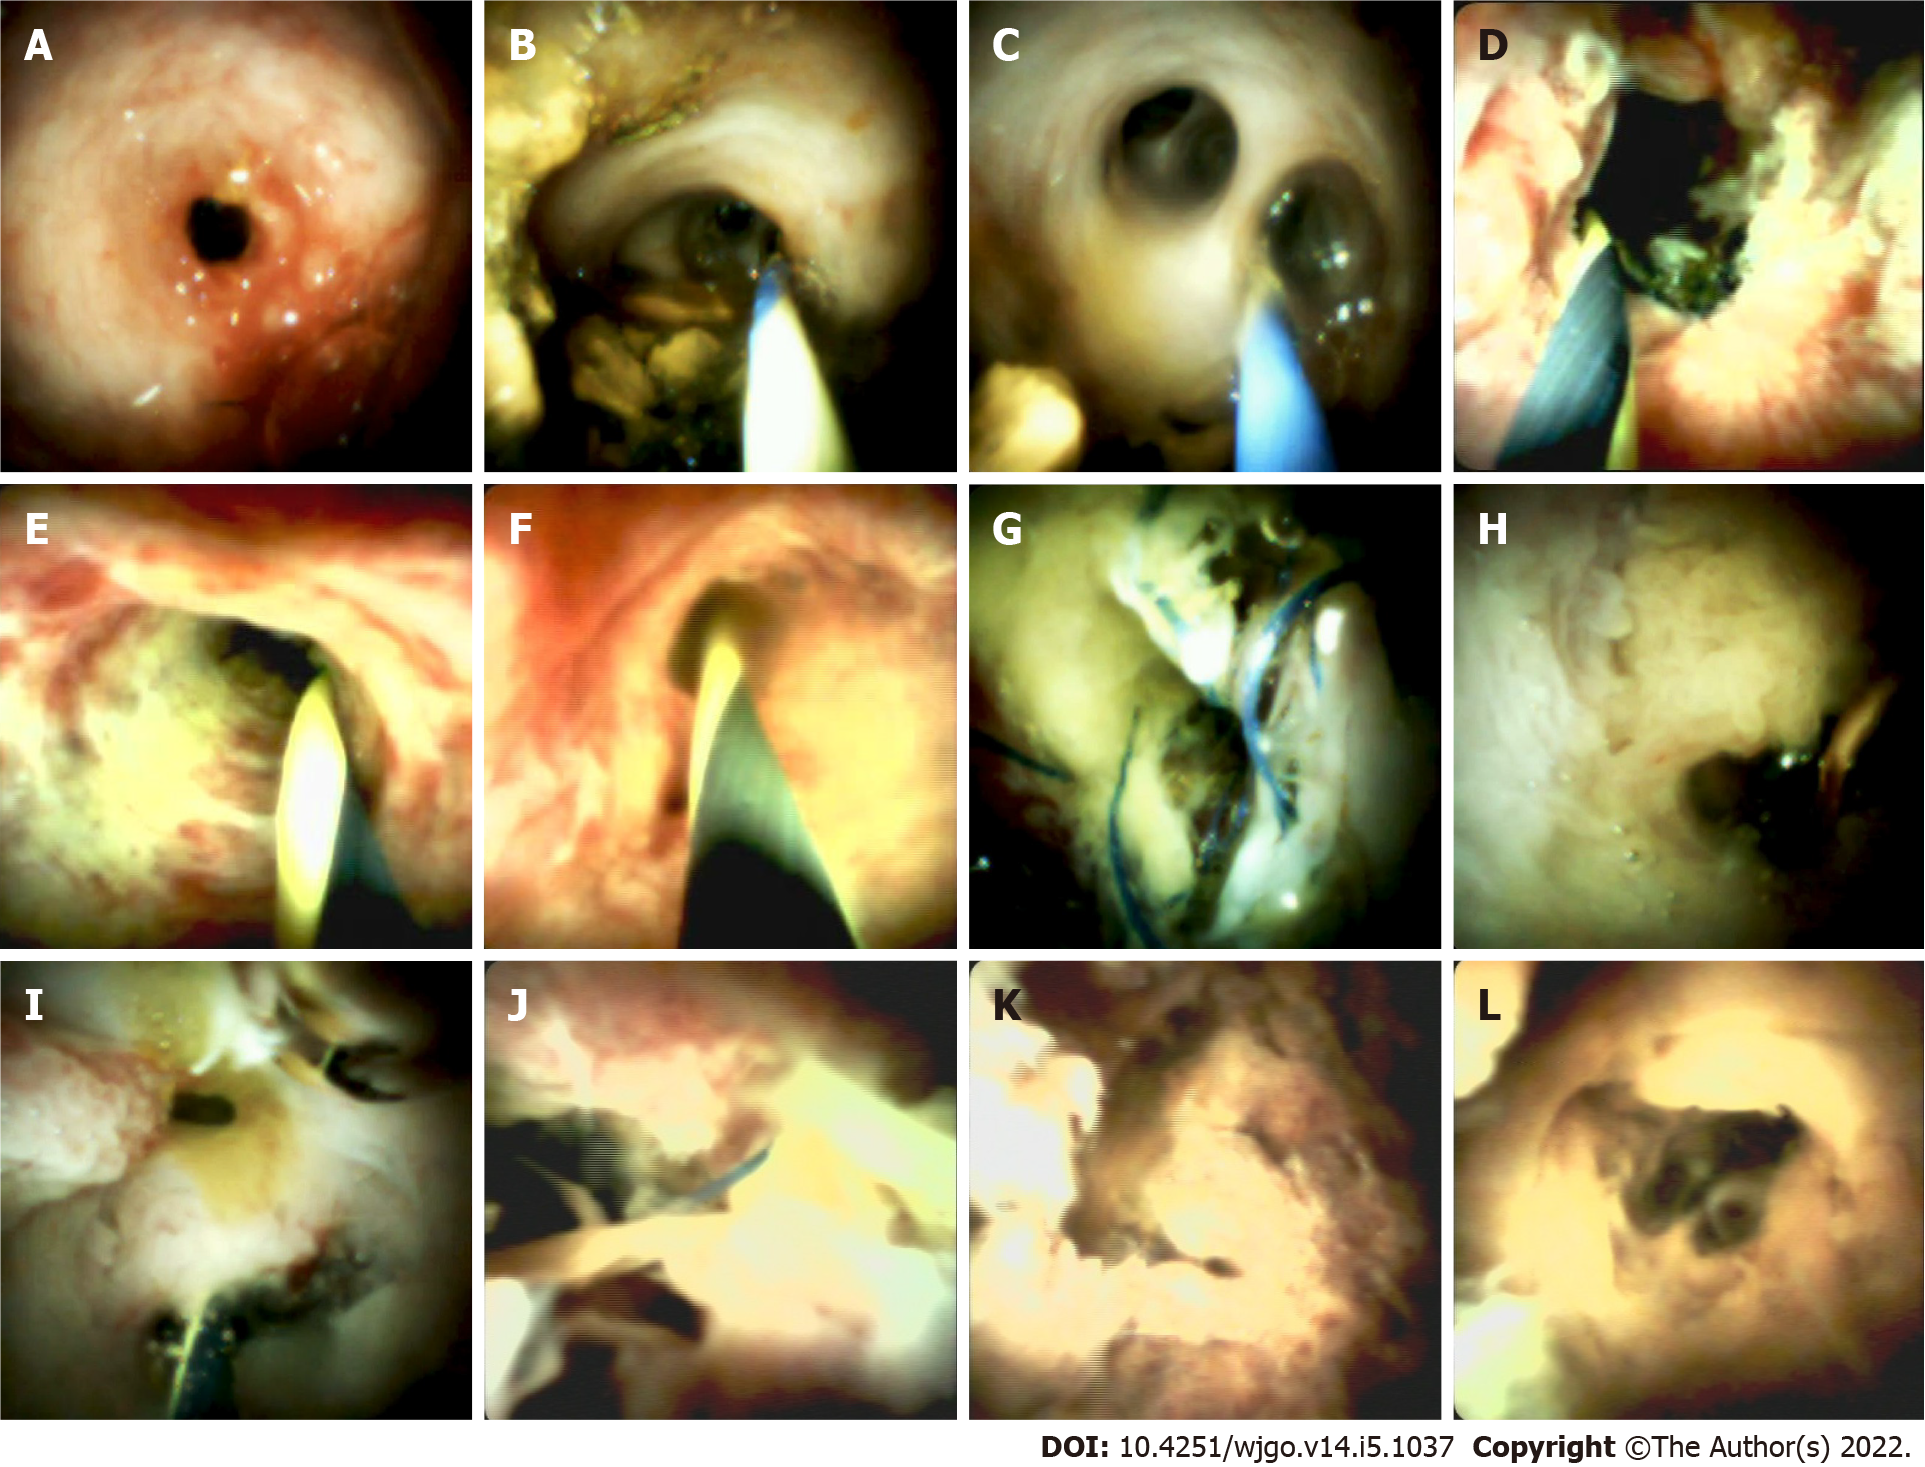
Figure 1 Representative cholangioscopic appearance of the donor bile duct mucosa.
A: Cholangioscopic image of the anastomotic stricture with erythema (Type A); B: Pale smooth mucosa of the donor hepatobiliary duct and dimly visible branching of the submucosal vessels (Type A); C: circular or elliptic opening of the intrahepatic bile duct in the hepatic portal system (Type A); D: Cholangioscopic image of the anastomotic stricture with hyperemia, edema, and polypoid growth tissues (Type B); E: hyperemia mucosa of the donor hepatobiliary duct with longitudinal ulcer (Type B); F: hyperemia mucosa of the intrahepatic bile duct in the hepatic portal system (Type B); G: Cholangioscopic image of the anastomotic stricture with sludge and suture (Type C); H: Deformed intrahepatic bile duct opening and granular mucosal surface without vessels (Type C); I: the villous mucosal surface of intrahepatic ducts (Type C); J: Cholangioscopic image of the anastomotic stricture with necrotic material and suture (Type D); K: The wall of intrahepatic bile duct with a mass of necrotic material (Type D); L: Deformed intrahepatic bile duct opening with necrotic material (Type D).
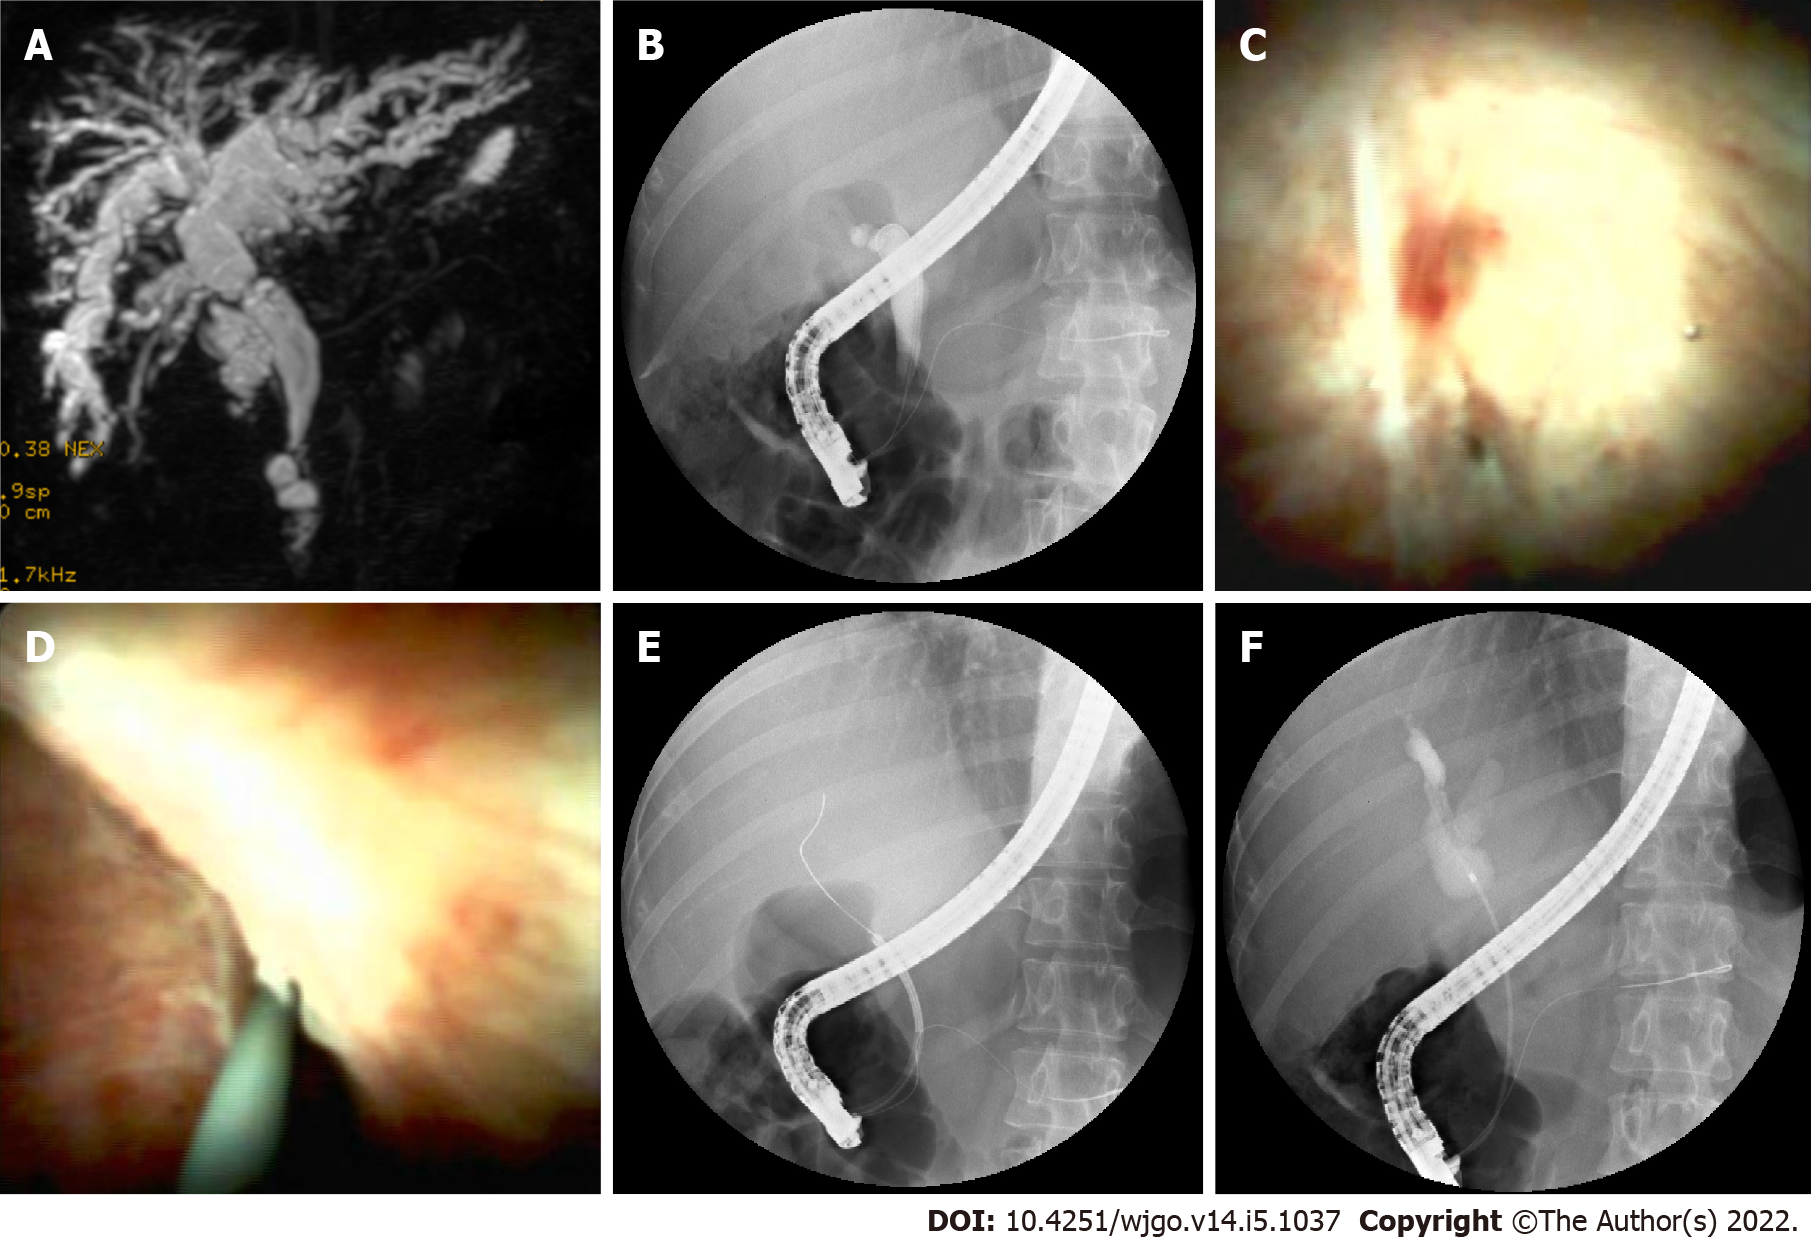
Figure 2 Cholangioscopy-assisted guidewire placement.
A: MRCP image shows anastomotic stricture and dilated bile duct above and below the stricture; B: ERCP image shows the guidewire failed to pass through the stricture; C: A narrow needle-like anastomosis (black arrow); D: Cholangioscopic image shown guidewire inserted through the anastomosis; E: ERCP image shown guidewire inserted into the intrahepatic bile duct; F: ERCP image shown dilated bile duct above anastomosis.
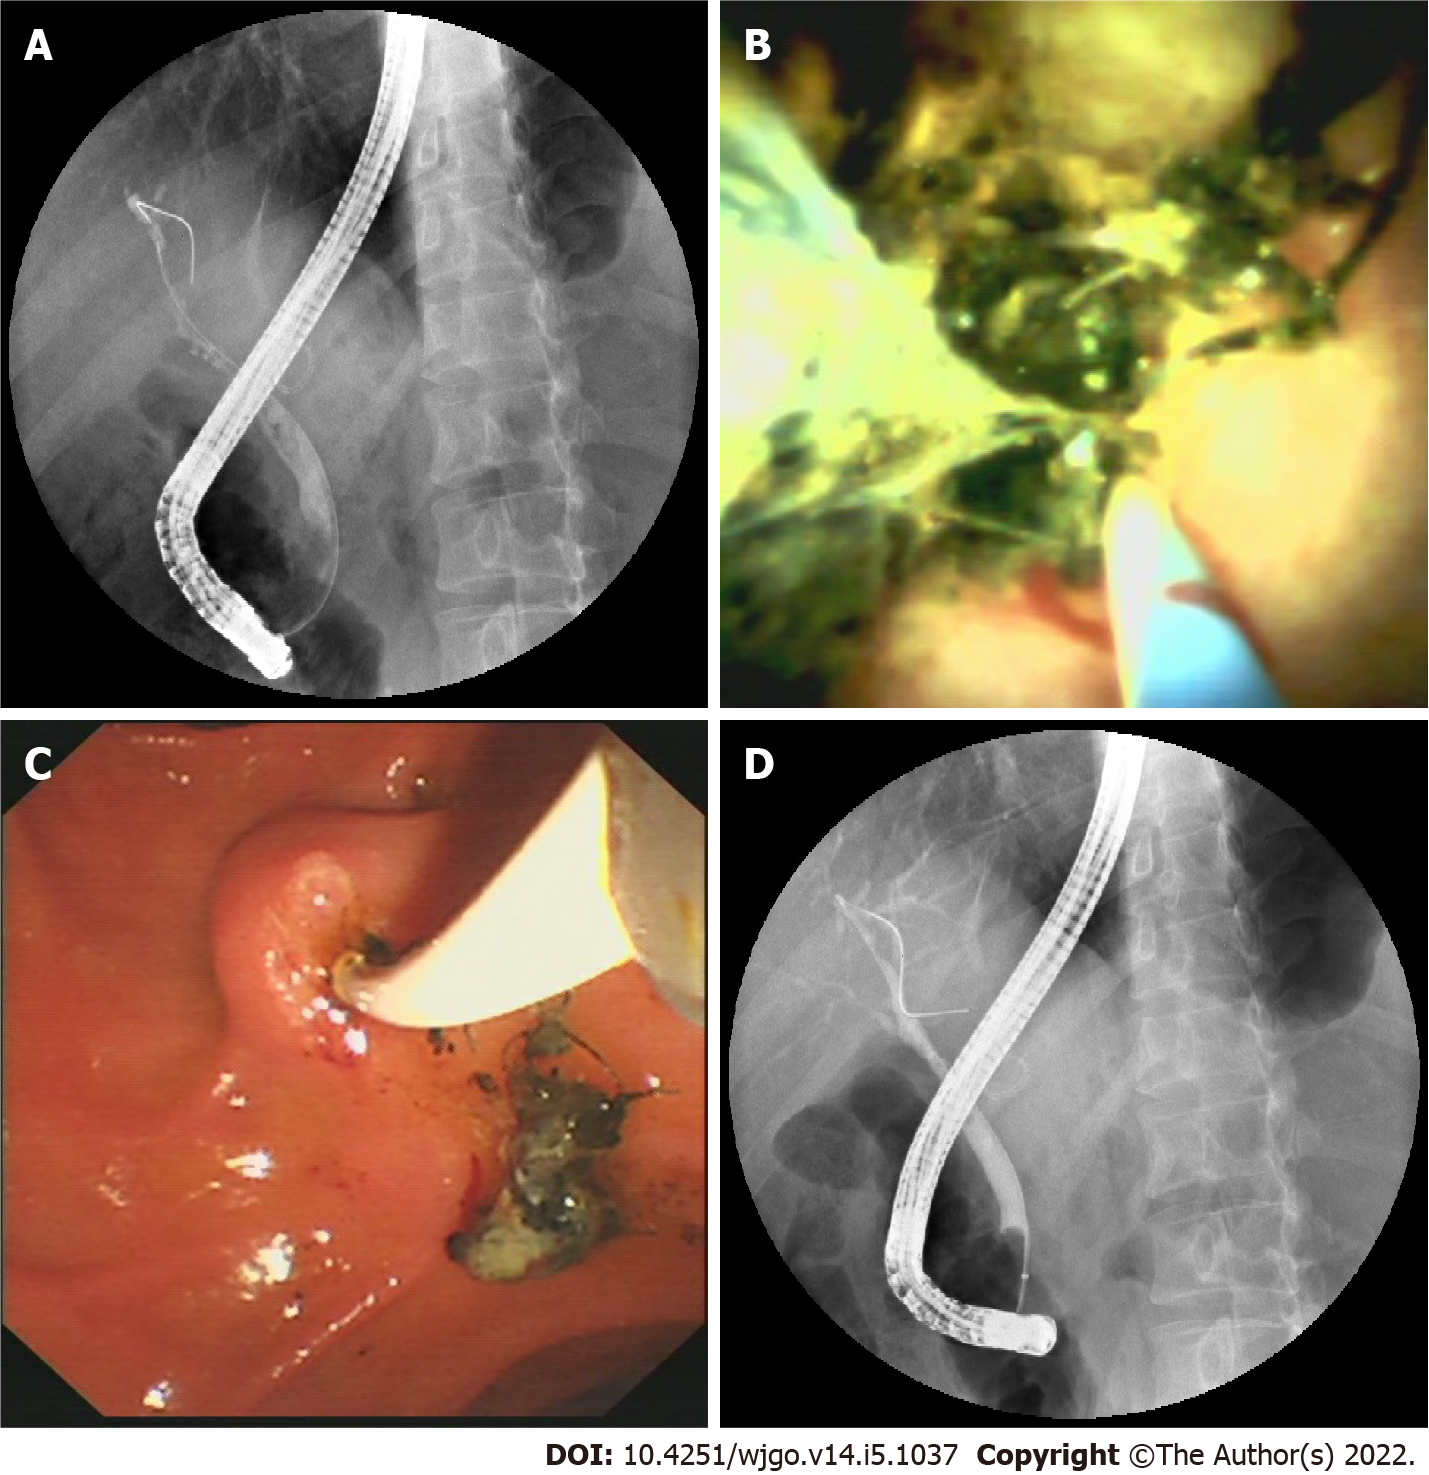
Figure 3 Biliary stenosis caused by stones and sutures.
A: ERCP image shows stricture between anastomosis and hilus region; B: Cholangioscopic image shows stones and suture in donor bile duct; C: Duodenoscopic image shows a mixture of sludge and sutures taken out by balloon; D: ERCP image shows the biliary stricture disappeared after extraction of the mixture.
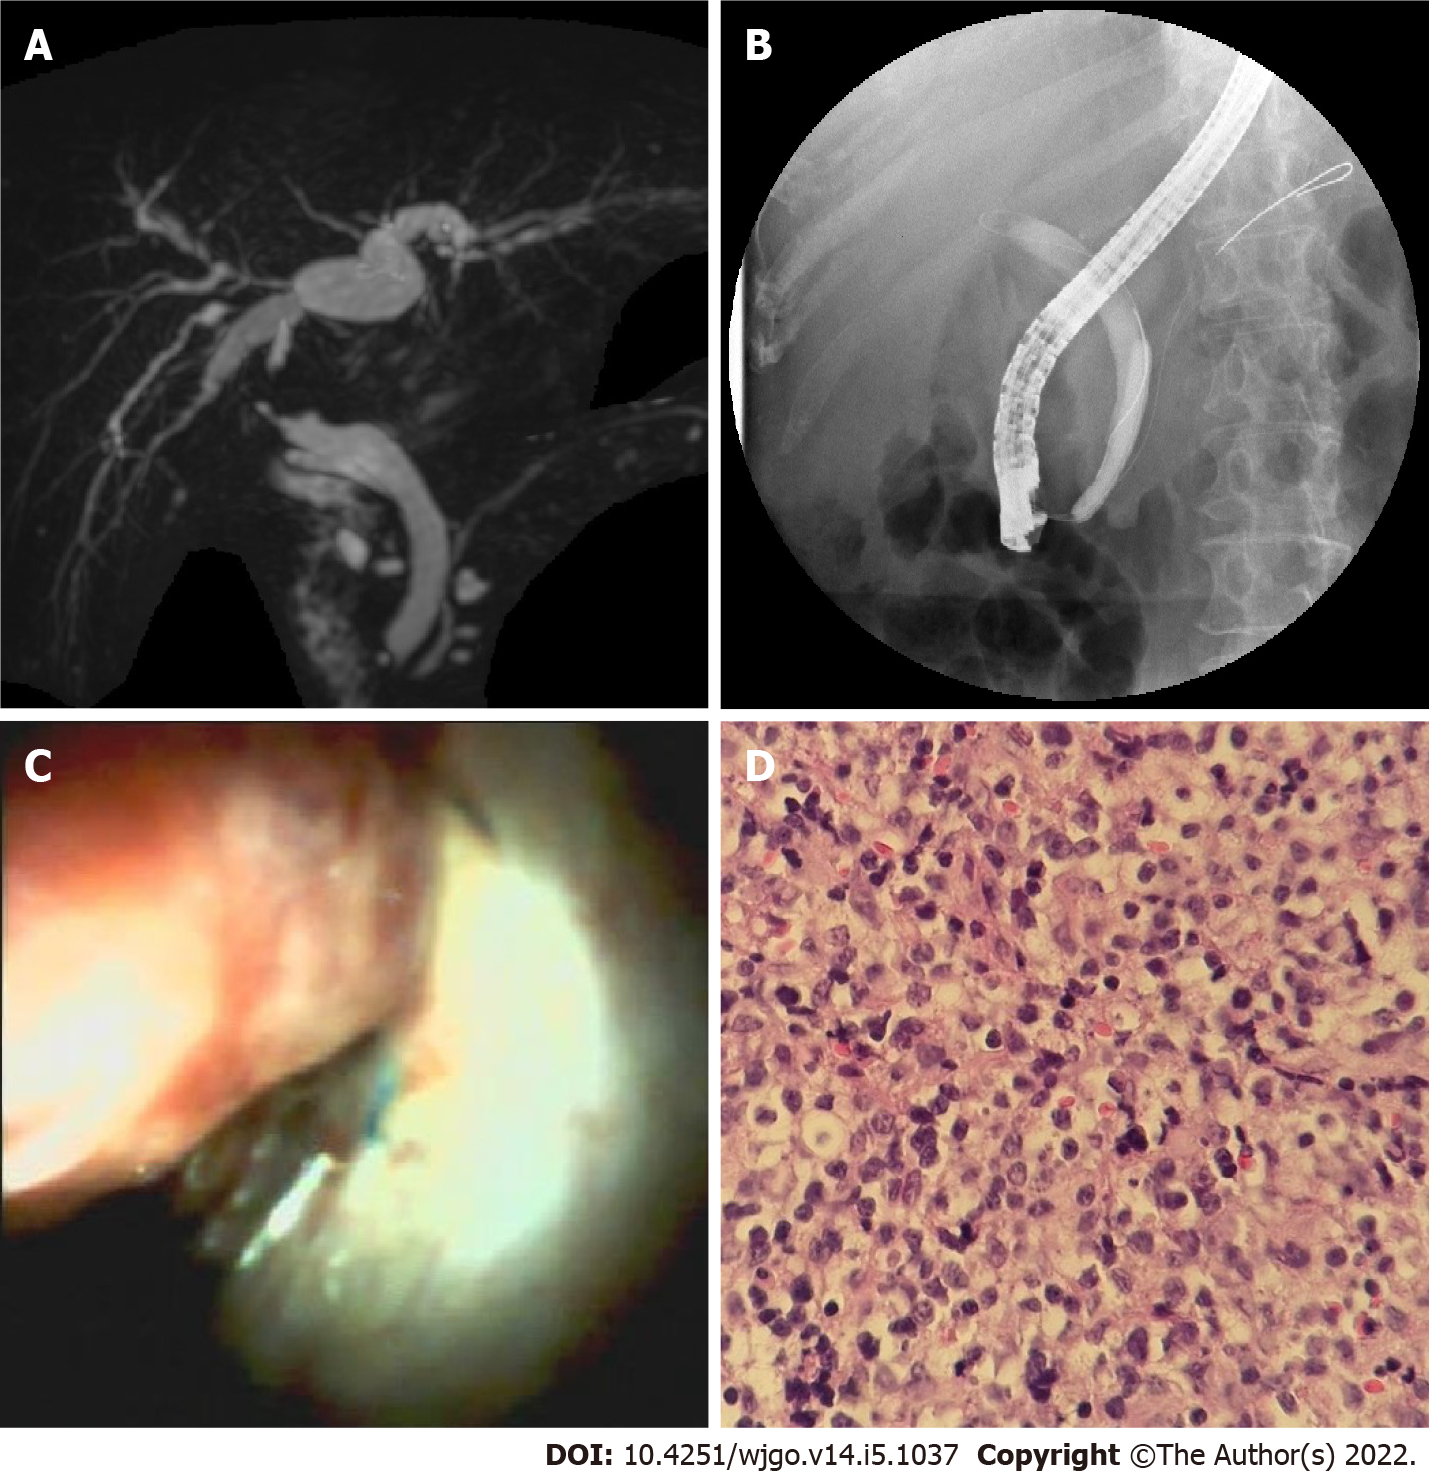
Figure 4 A neoplasm in donor bile duct.
A: Magnetic resonance cholangiopancreatography image shows stricture between anastomosis and hilus region; B: Endoscopic retrograde cholangiopancreatography image shows guidewire failed to pass through the stricture; C: Cholangioscopic image shows the neoplasm with a red surface in the donor bile tract; D: Pathological sections of the neoplasm show many identical lymphocytes with distinct atypia.
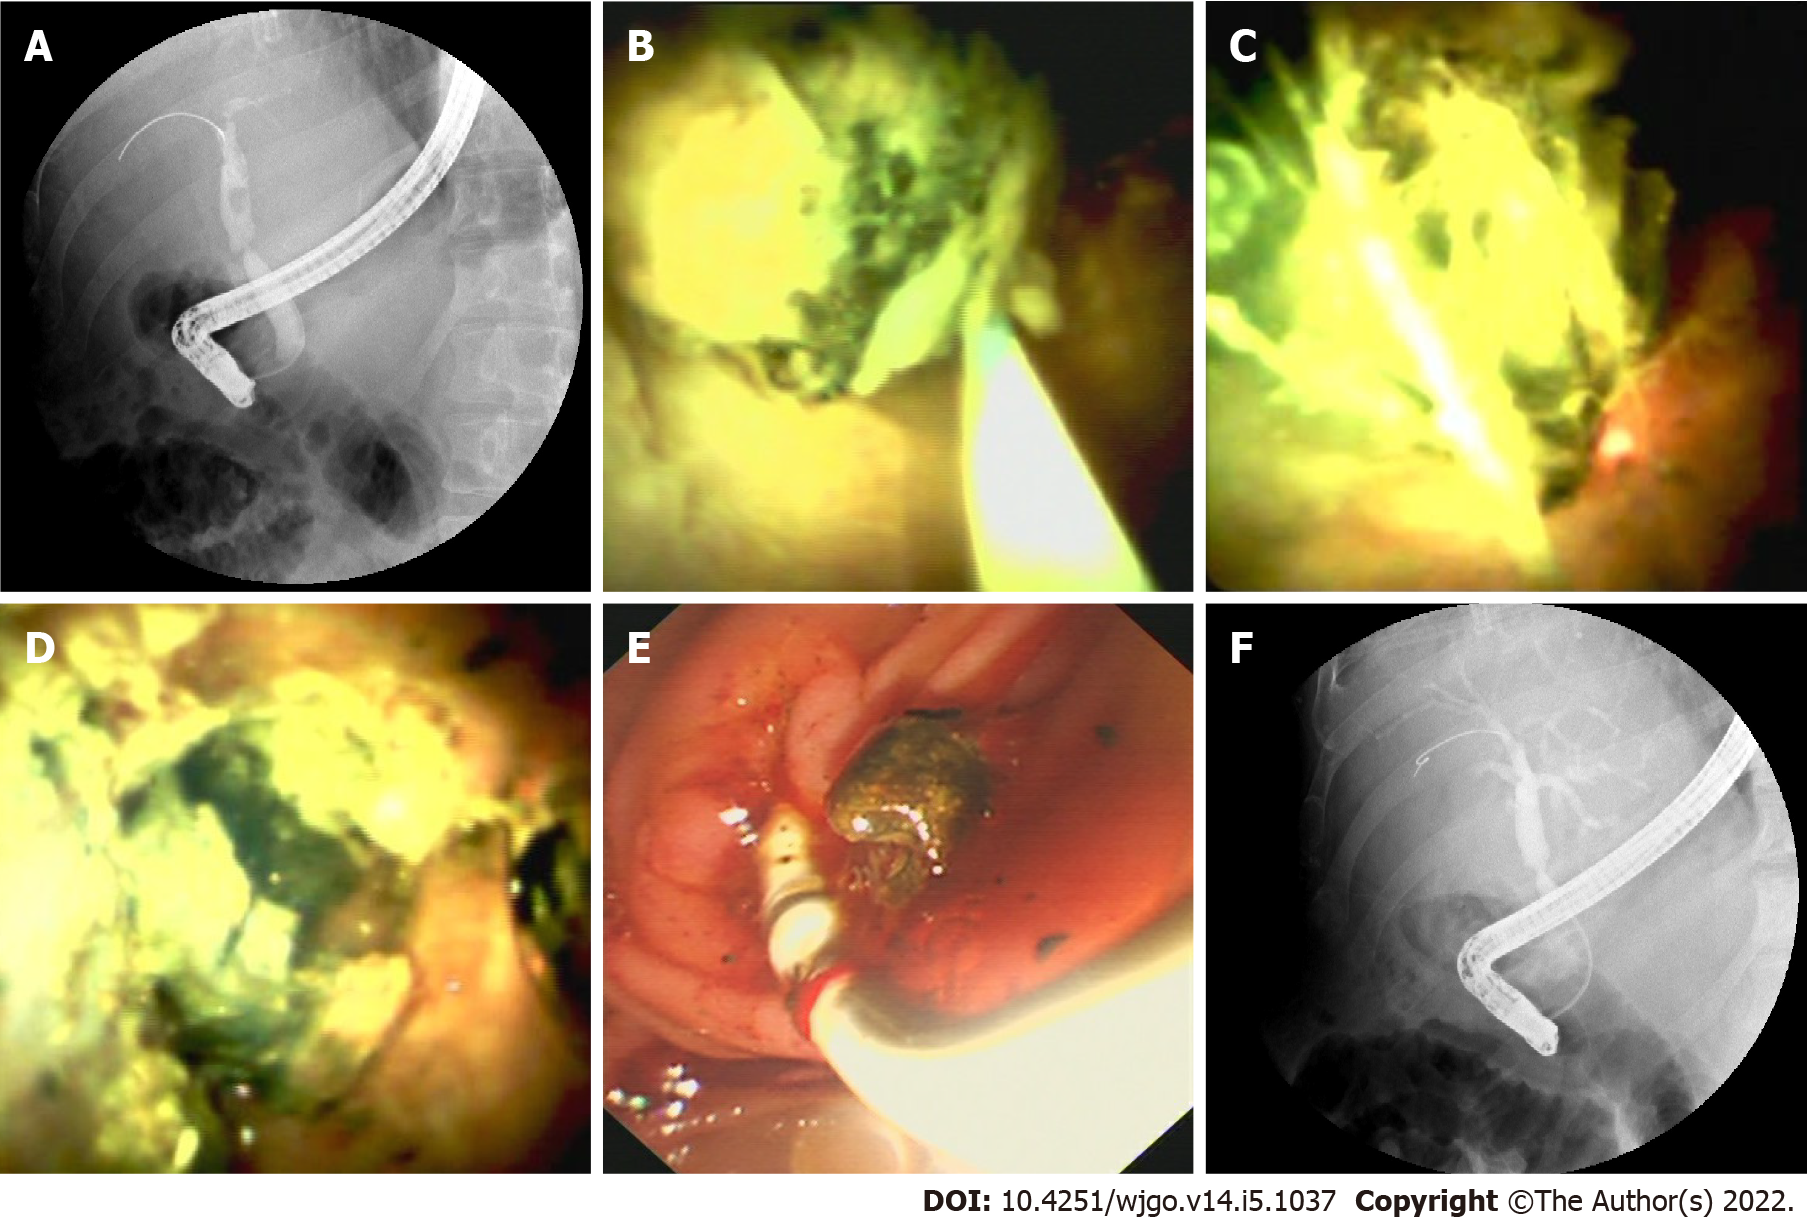
Figure 5 Laser lithotripsy under direct vision.
A: Endoscopic retrograde cholangiopancreatography (ERCP) image shows a stone in the bile duct above an anastomotic stricture; B: Cholangioscopic image shows a green stone in the donor bile duct; C: Optical fiber inserted through the cholangioscopy channel touching the stone; D: Cholangioscopic image shows the stone was shattered by laser; E: Duodenoscopic image shows crushed stone taken out by balloon; F: ERCP image shows the stone was completely extracted.
- Citation: Yu JF, Zhang DL, Wang YB, Hao JY. Digital single-operator cholangioscopy for biliary stricture after cadaveric liver transplantation. World J Gastrointest Oncol 2022; 14(5): 1037-1049
- URL: https://www.wjgnet.com/1948-5204/full/v14/i5/1037.htm
- DOI: https://dx.doi.org/10.4251/wjgo.v14.i5.1037


