Copyright
©The Author(s) 2022.
World J Gastrointest Oncol. May 15, 2022; 14(5): 1014-1026
Published online May 15, 2022. doi: 10.4251/wjgo.v14.i5.1014
Published online May 15, 2022. doi: 10.4251/wjgo.v14.i5.1014
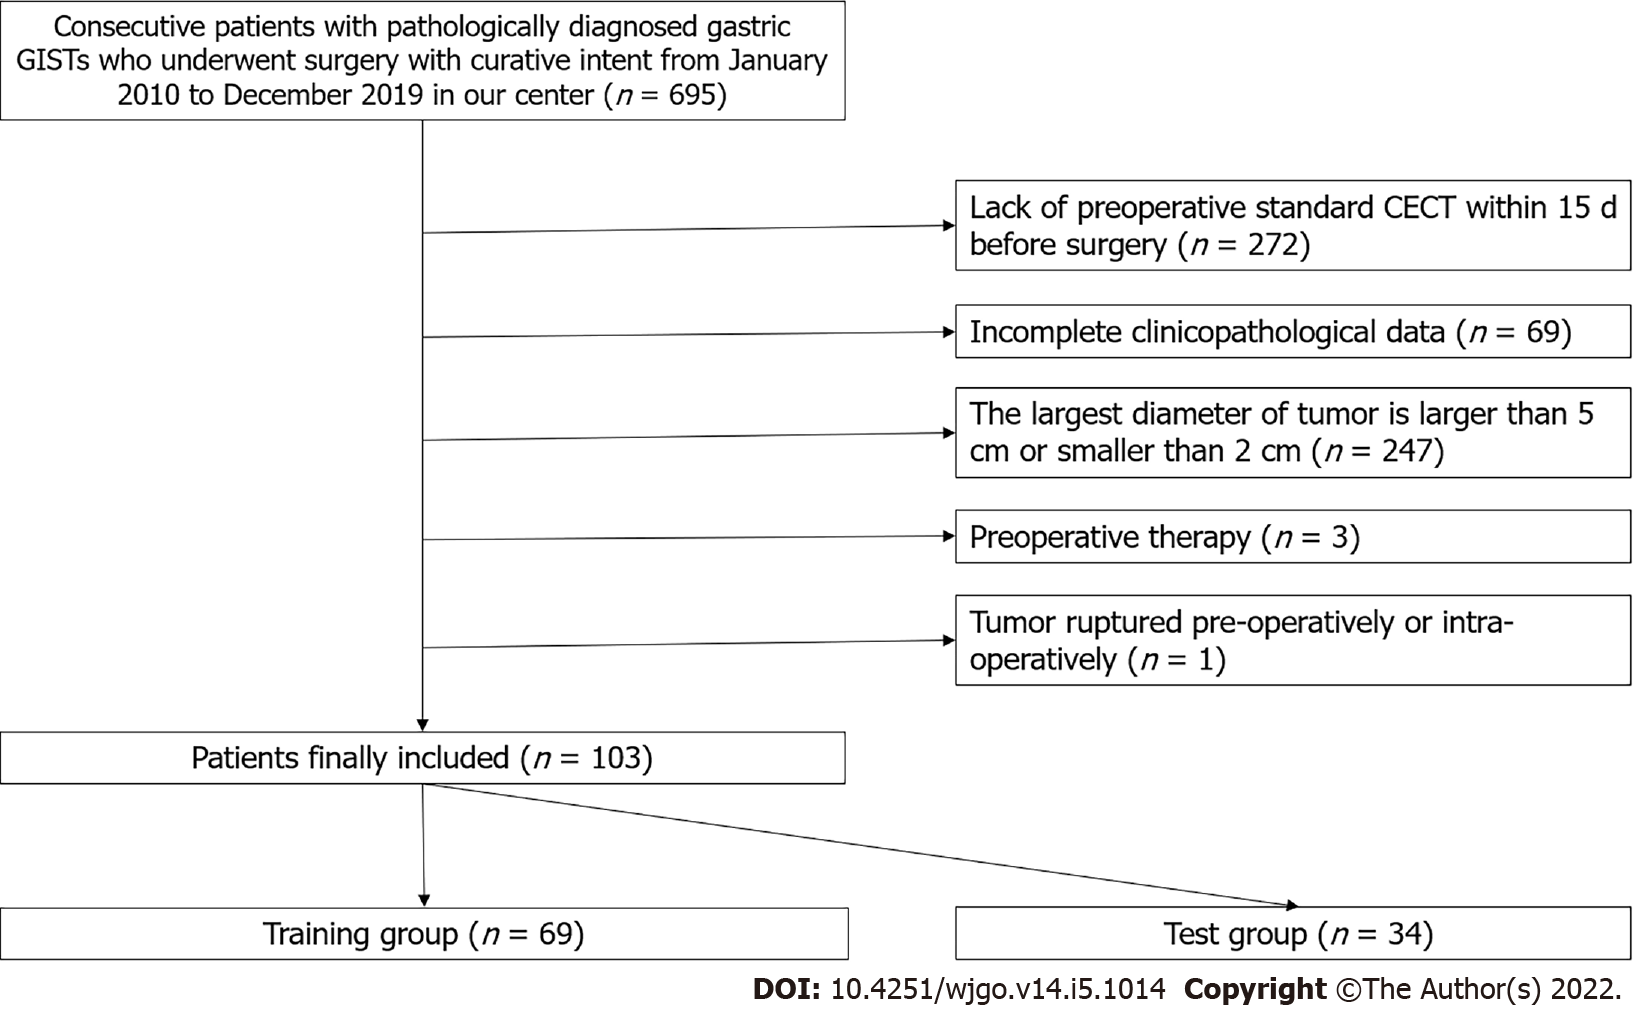
Figure 1 Flowchart of patient inclusion and exclusion.
CECT: Contrast-enhanced computerized tomography; GISTs: Gastrointestinal stromal tumors.
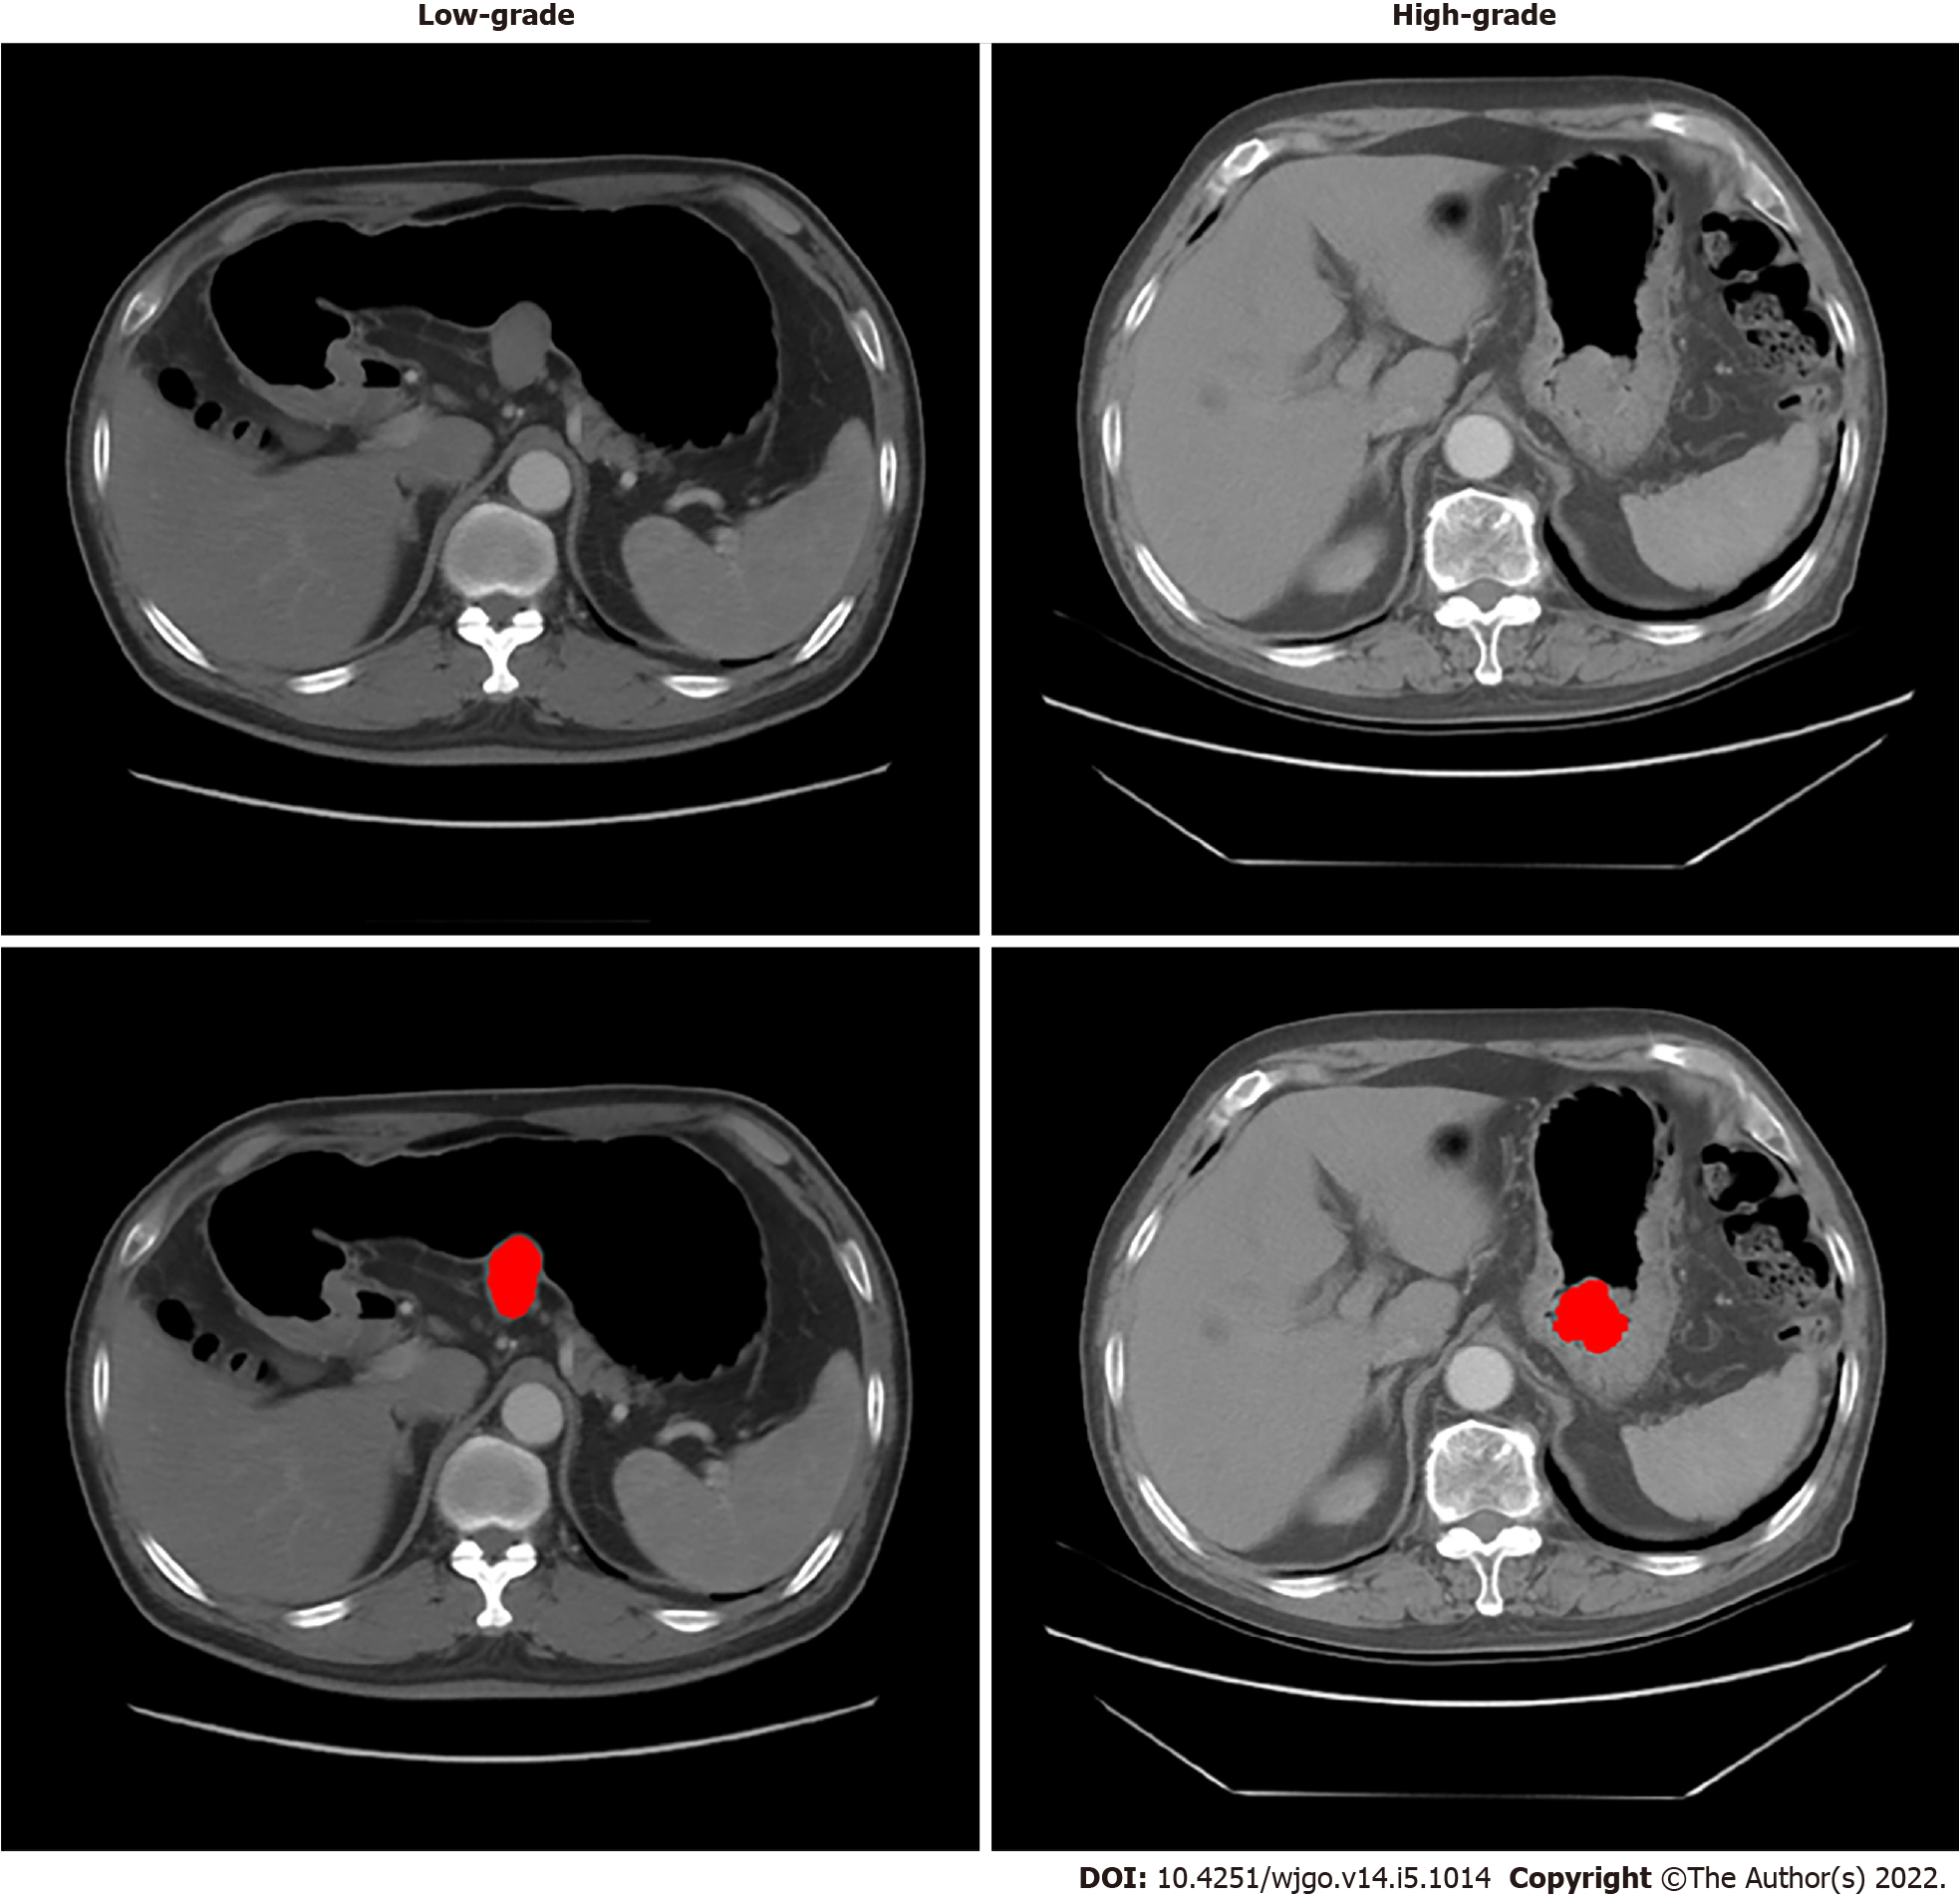
Figure 2 Two examples of computerized tomography images and tumor delineation (red color).
The left one was proven low-grade malignant potential, and the right one was proven high-grade malignant potential by pathological analyses with mitotic counts.
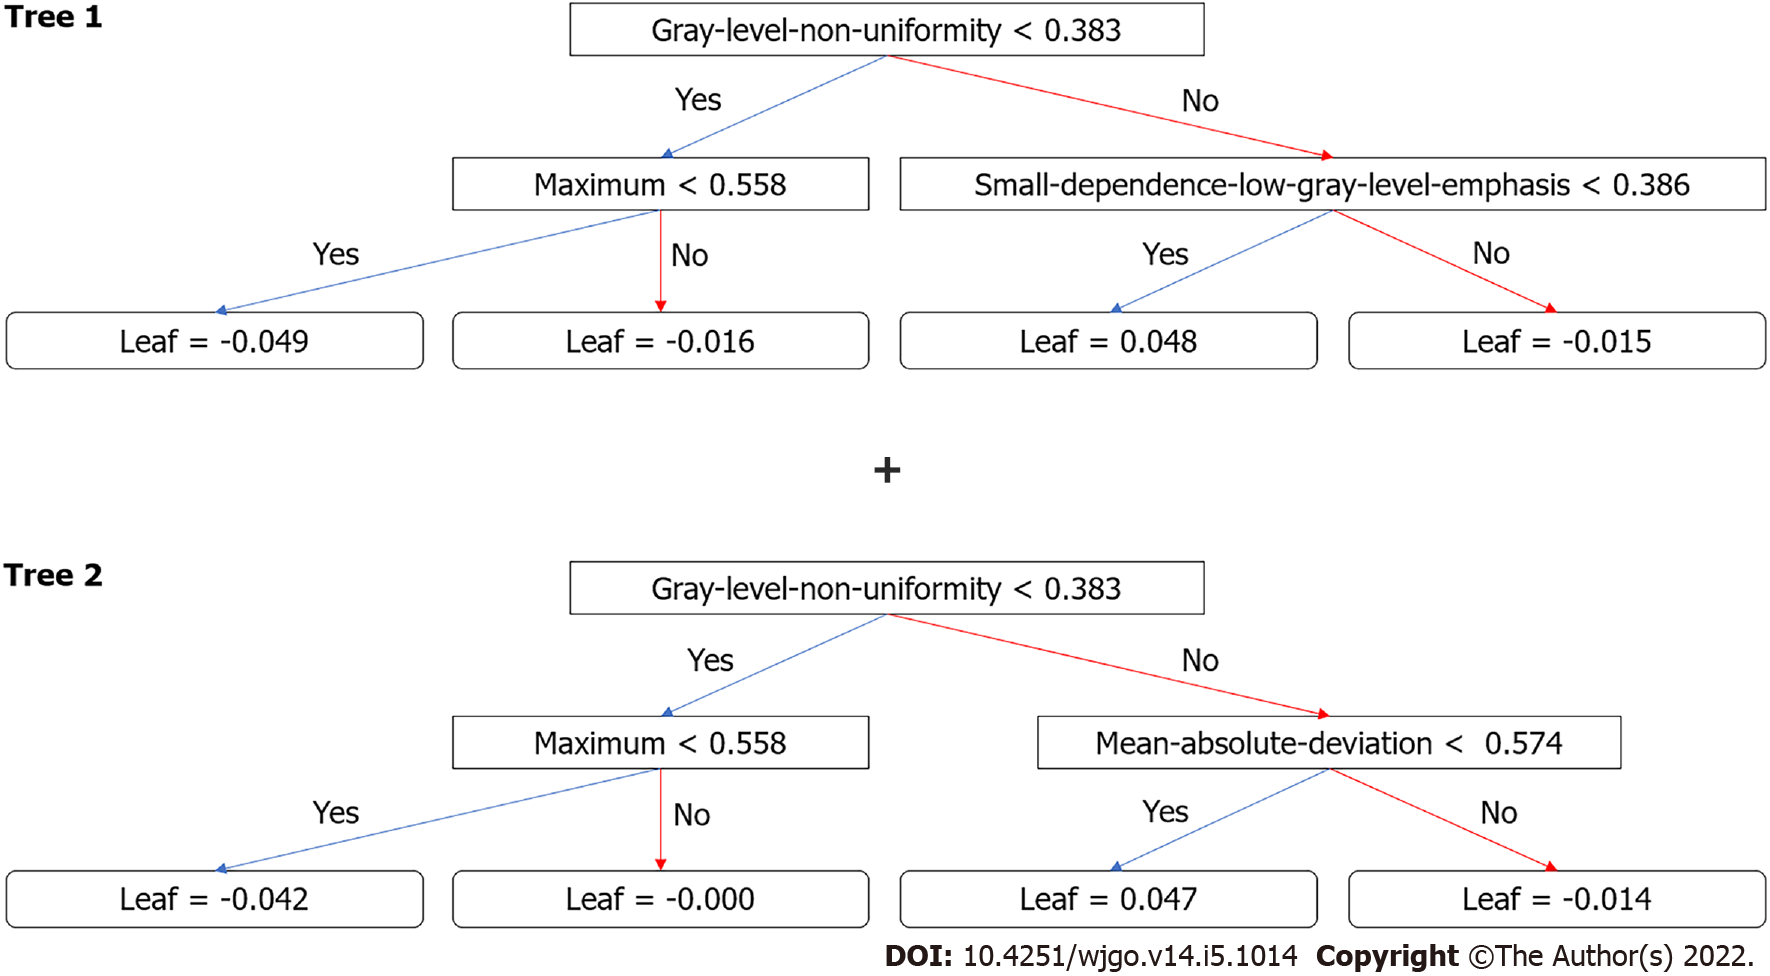
Figure 3 Decision trees generated by XGboost method for classification.
Radiomics score is the sum of the scores from the two trees.
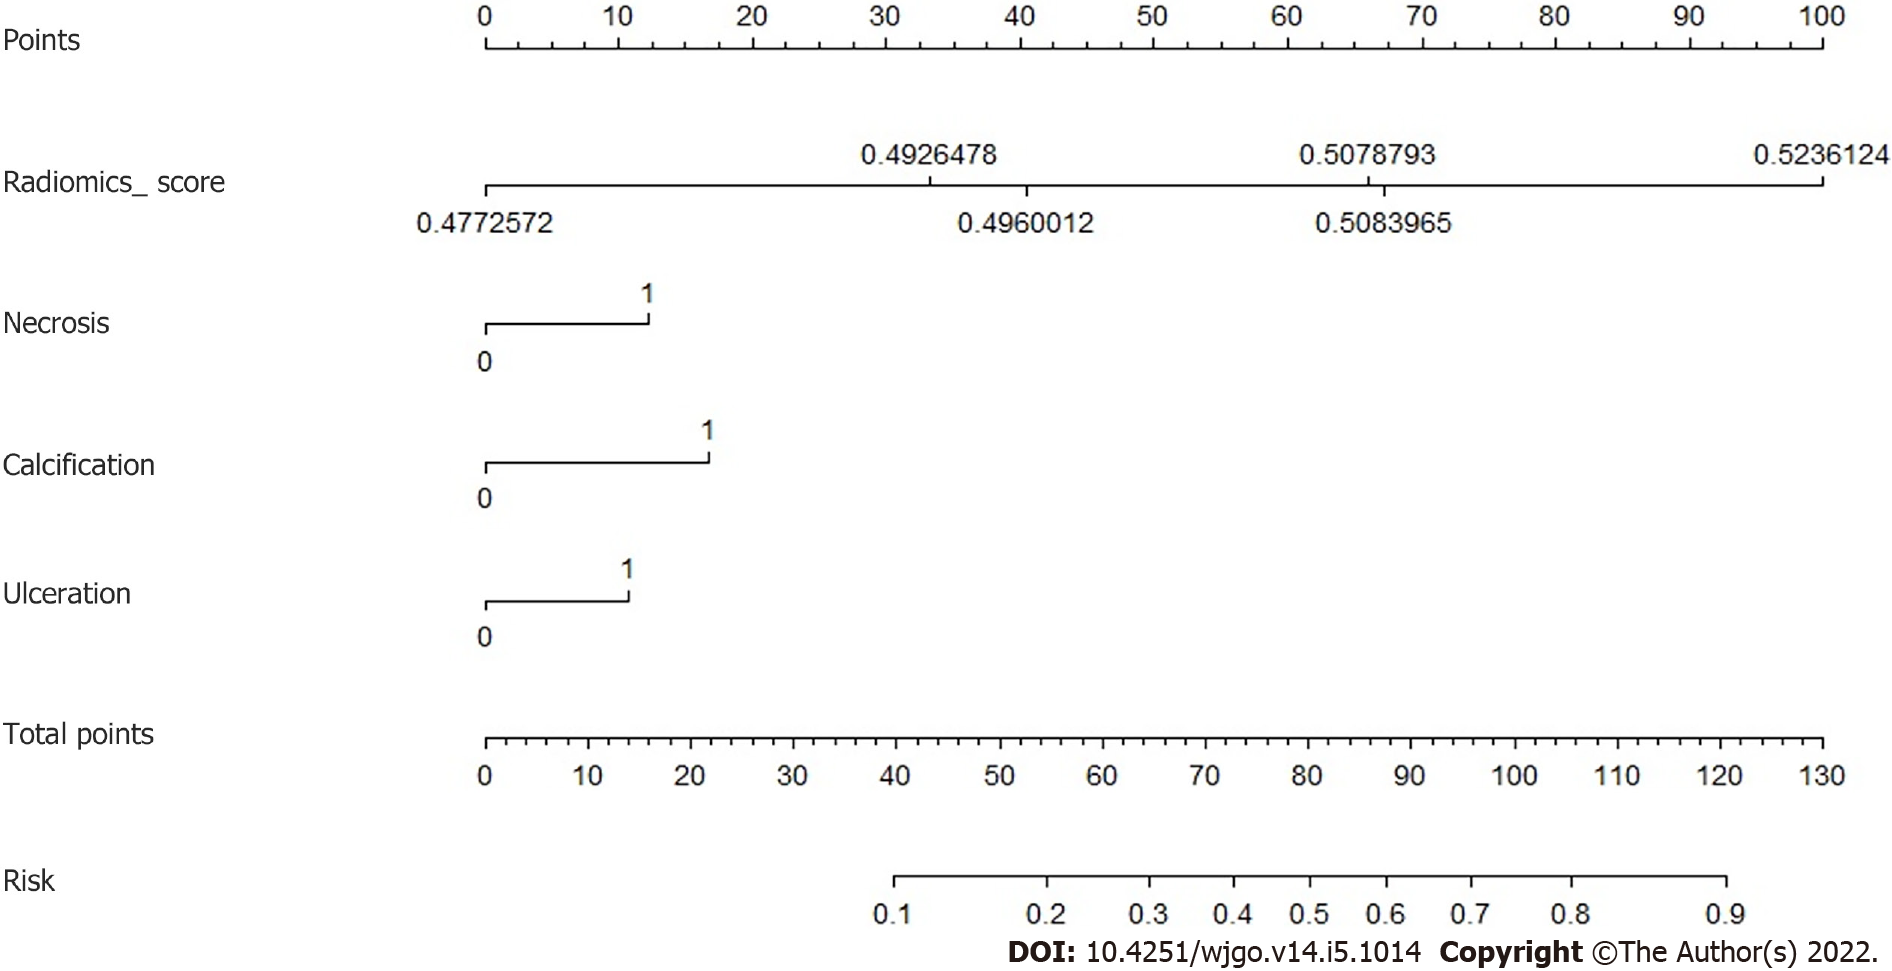
Figure 4 Nomogram for the prediction.
The radiomics score was combined with three computerized tomography findings: Necrosis, calcification, and ulceration.
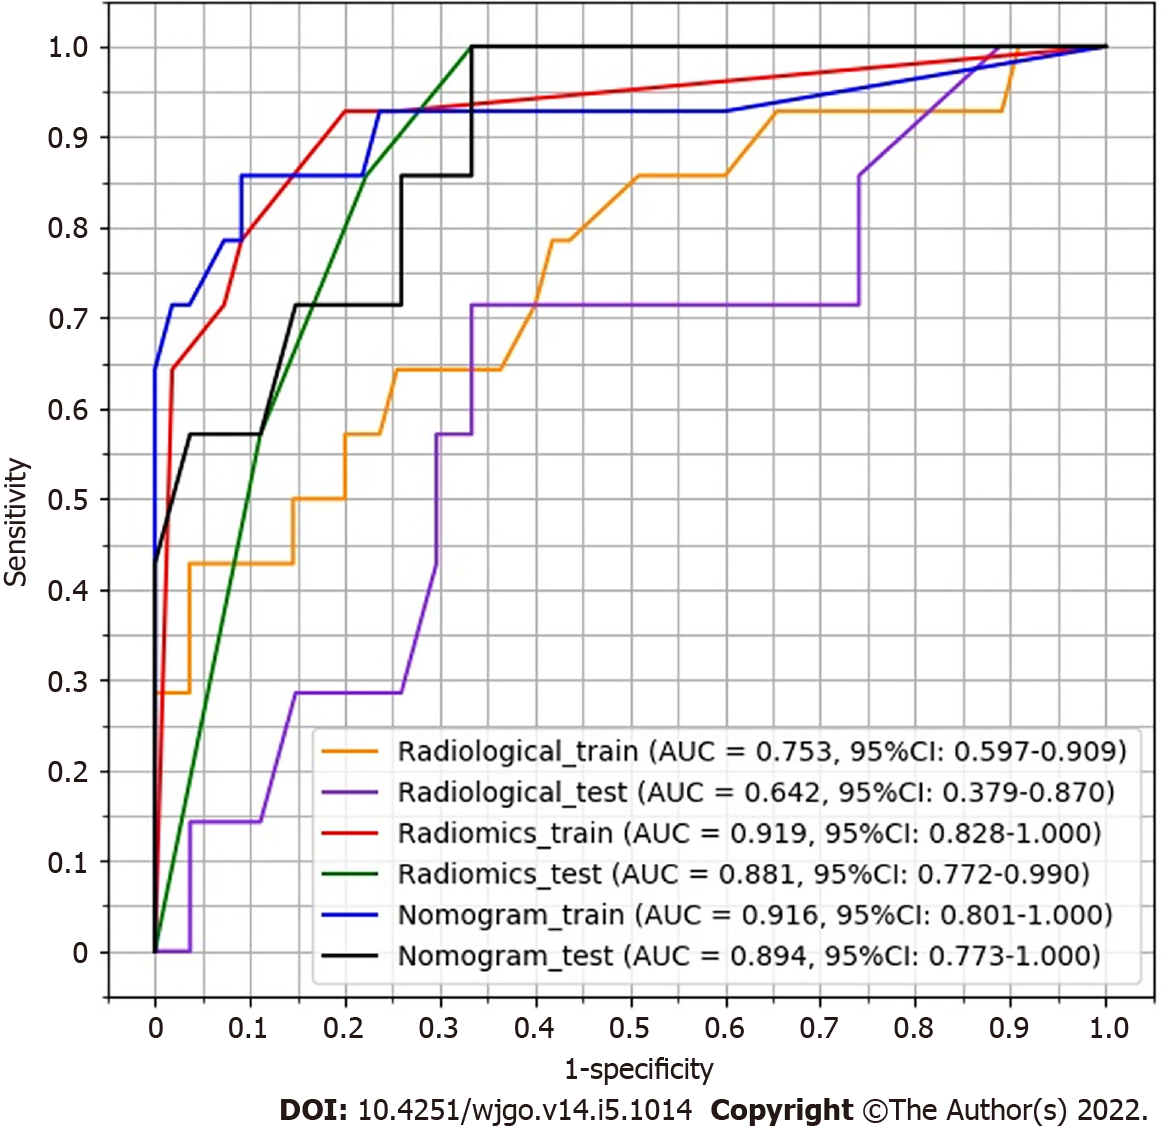
Figure 5 Receiver operating characteristic curves for radiological model, radiomics model, and nomogram model.
AUC: Area under the curve.
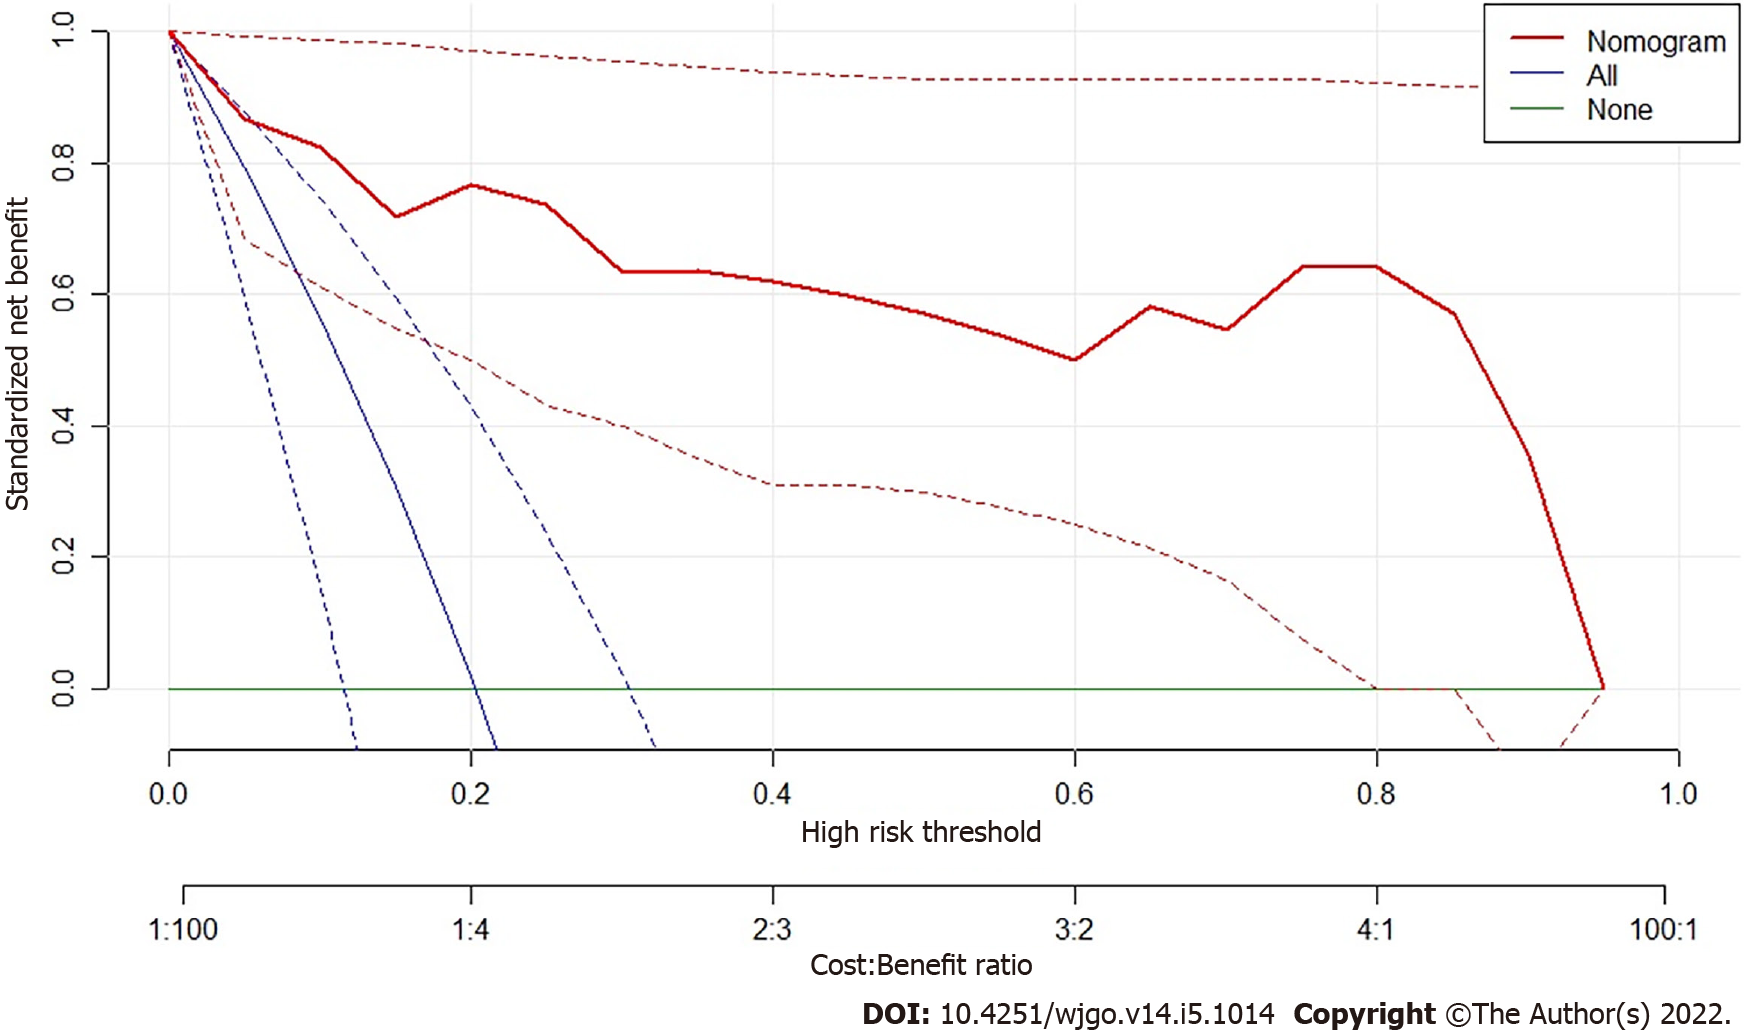
Figure 6 Decision curve of analysis.
The nomogram model produces increased benefit in the whole range of risk thresholds.
- Citation: Sun XF, Zhu HT, Ji WY, Zhang XY, Li XT, Tang L, Sun YS. Preoperative prediction of malignant potential of 2-5 cm gastric gastrointestinal stromal tumors by computerized tomography-based radiomics. World J Gastrointest Oncol 2022; 14(5): 1014-1026
- URL: https://www.wjgnet.com/1948-5204/full/v14/i5/1014.htm
- DOI: https://dx.doi.org/10.4251/wjgo.v14.i5.1014


