Copyright
©The Author(s) 2022.
World J Gastrointest Oncol. Apr 15, 2022; 14(4): 887-896
Published online Apr 15, 2022. doi: 10.4251/wjgo.v14.i4.887
Published online Apr 15, 2022. doi: 10.4251/wjgo.v14.i4.887
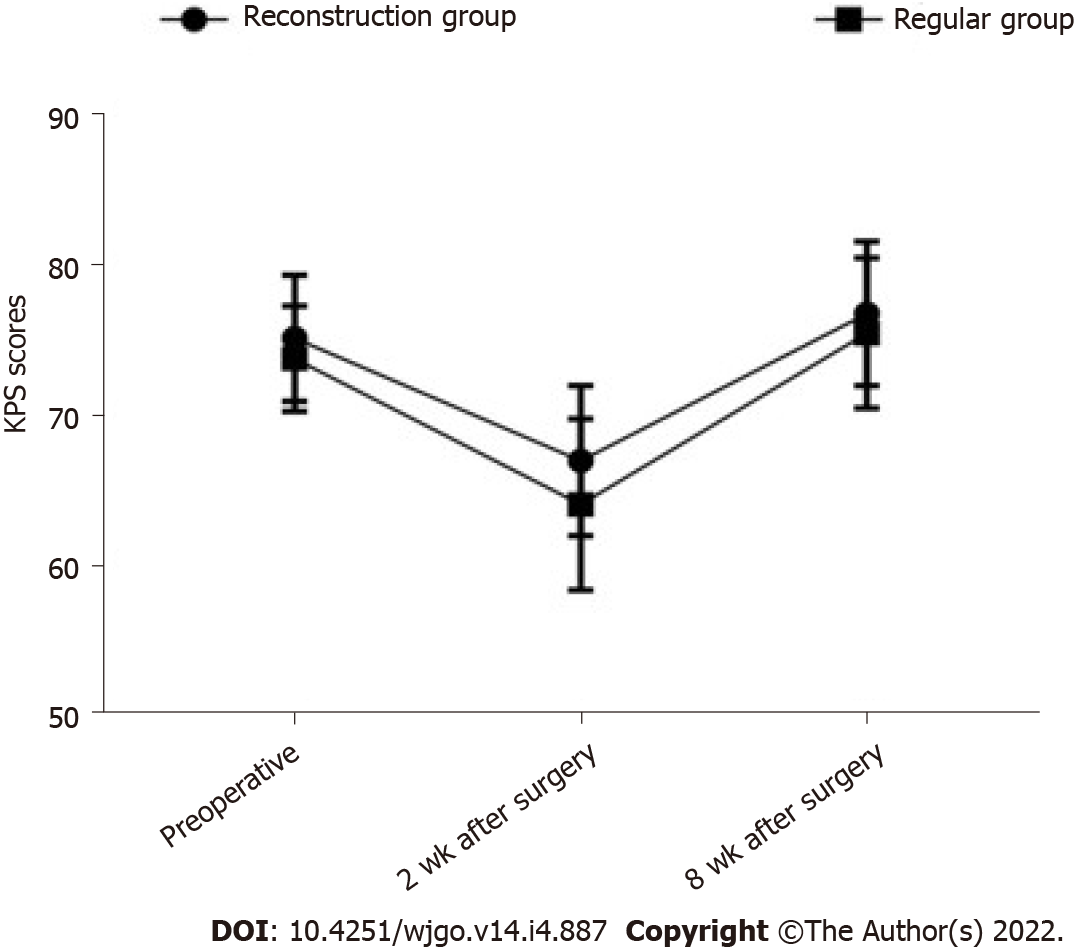
Figure 1 Line chart of changes in Karnofsky performance status scores before and after surgery in the two groups.
The mean ± SD are depicted for each time point. KPS: Karnofsky performance status.
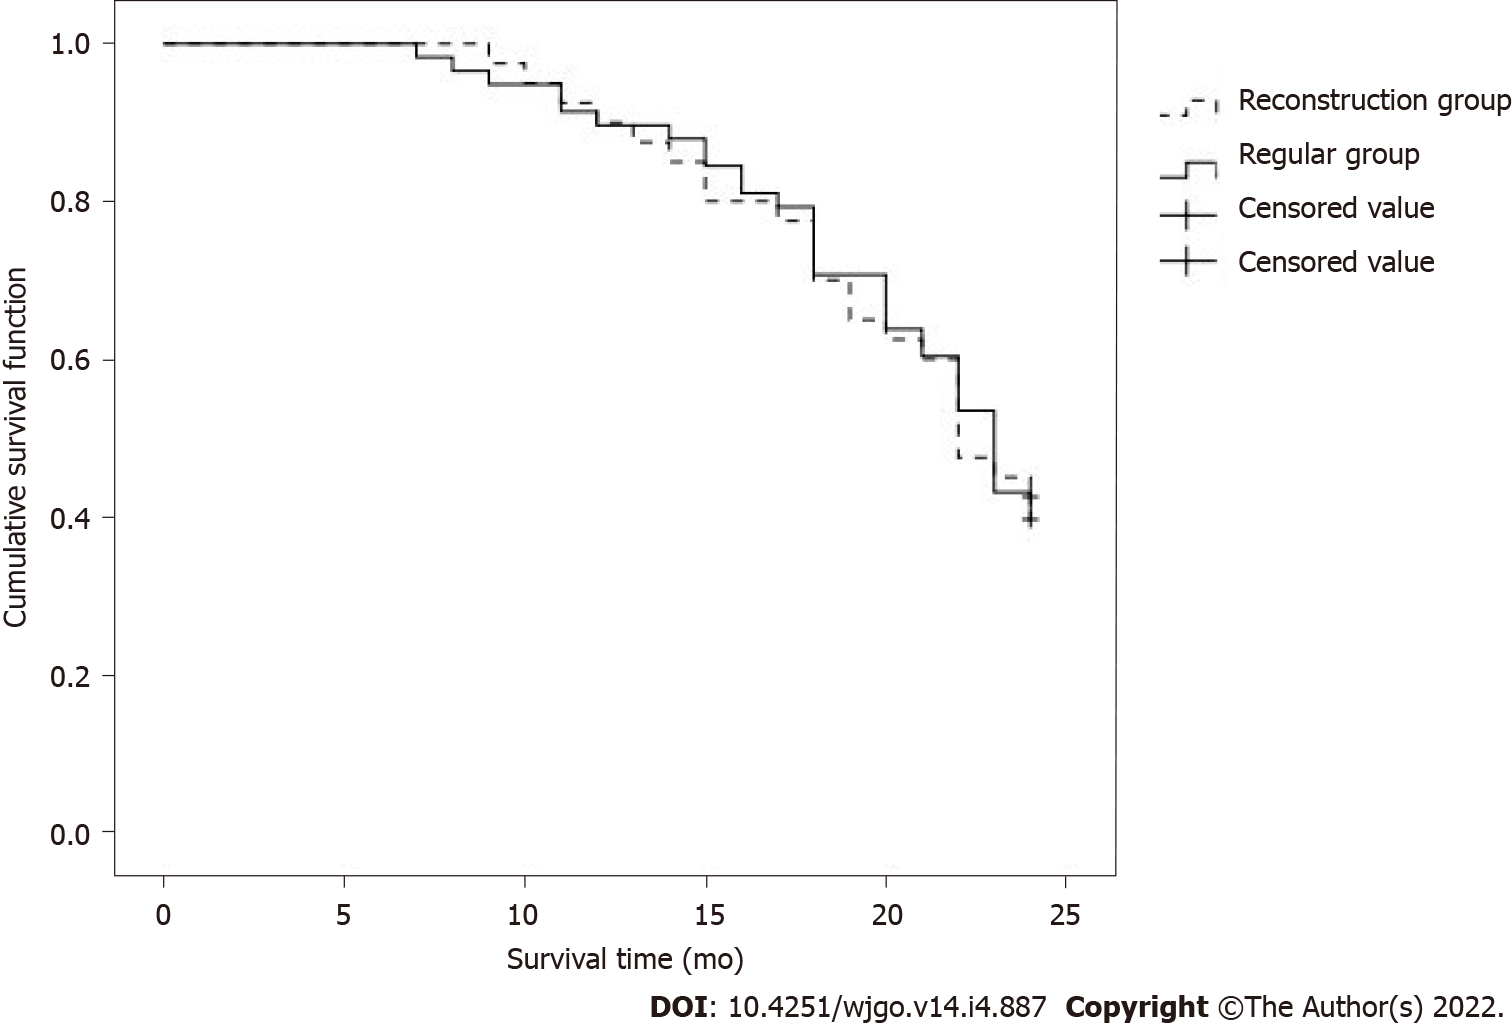
Figure 2 Kaplan-Meier survival curves for the two groups of patients.
- Citation: Li YM, Bie ZX, Guo RQ, Li B, Wang CE, Yan F. Effect of hepatic artery resection and reconstruction on the prognosis of patients with advanced hilar cholangiocarcinoma. World J Gastrointest Oncol 2022; 14(4): 887-896
- URL: https://www.wjgnet.com/1948-5204/full/v14/i4/887.htm
- DOI: https://dx.doi.org/10.4251/wjgo.v14.i4.887


