Copyright
©The Author(s) 2022.
World J Gastrointest Oncol. Nov 15, 2022; 14(11): 2108-2121
Published online Nov 15, 2022. doi: 10.4251/wjgo.v14.i11.2108
Published online Nov 15, 2022. doi: 10.4251/wjgo.v14.i11.2108
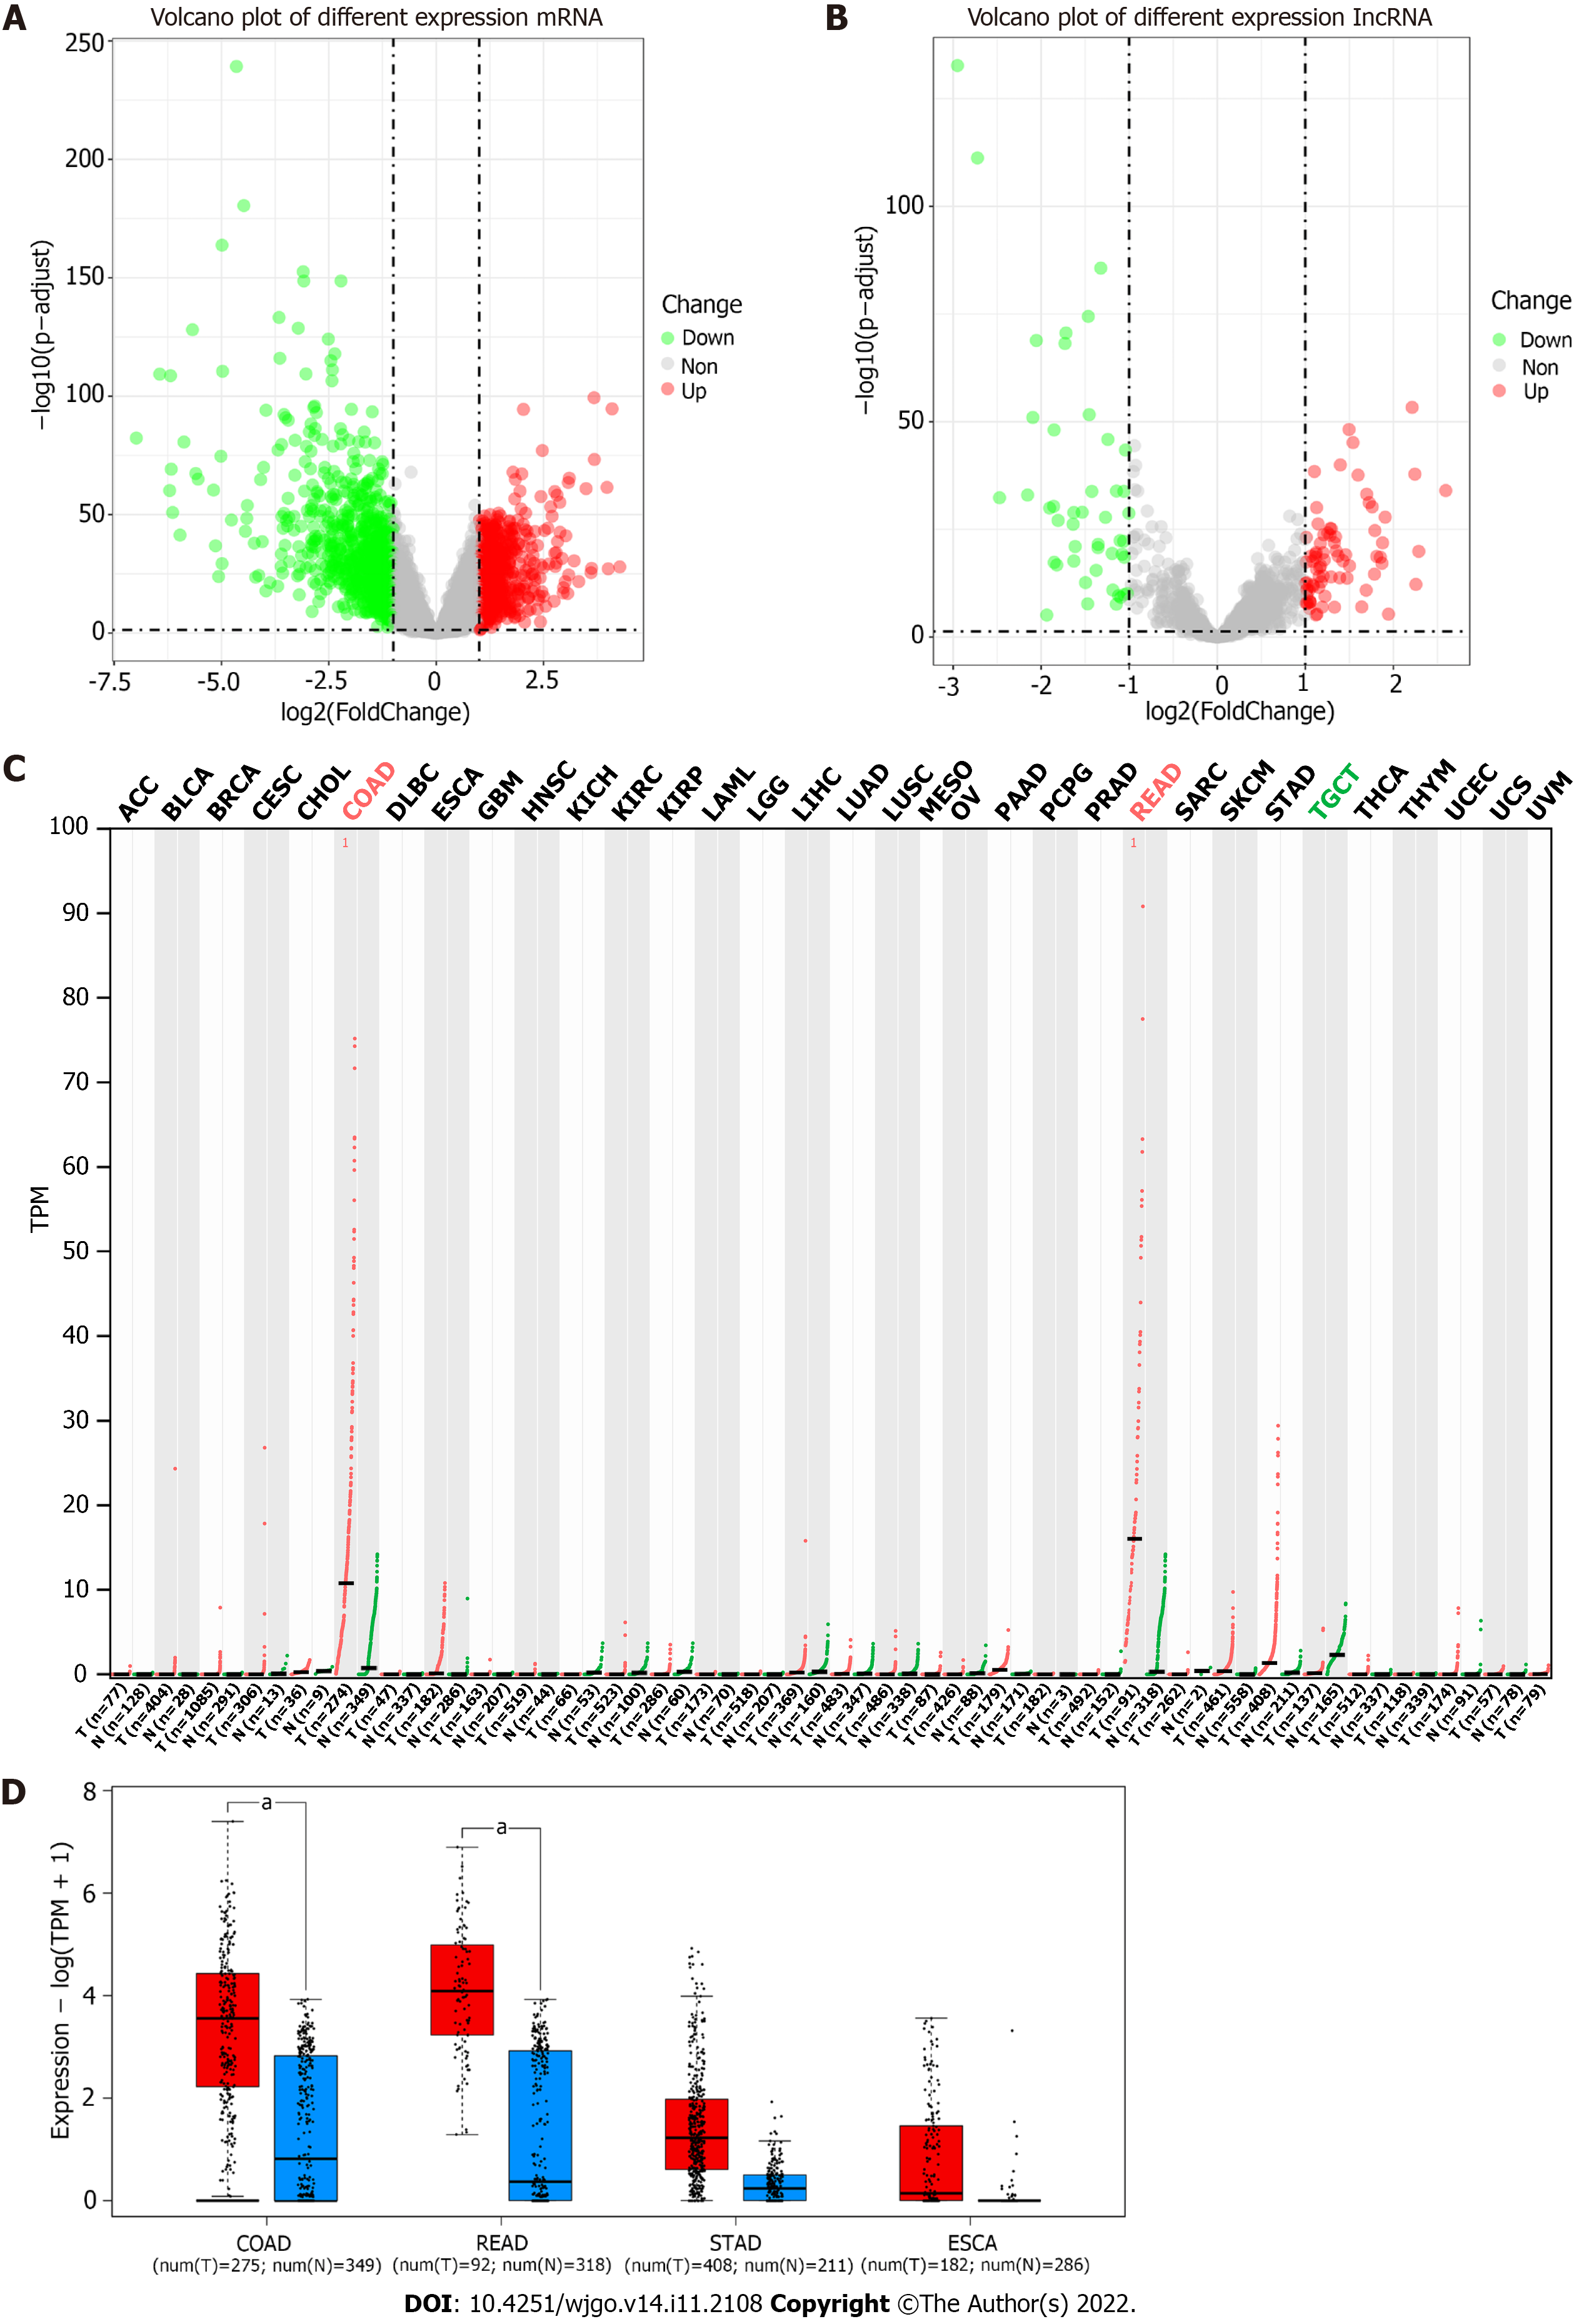
Figure 1 Volcano plot of the differentially expressed genes in The Cancer Genome Atlas-colon adenocarcinoma (LogFC > 1 or < -1 and adjust P value < 0.
05 were defined as significant difference) and results from GEPIA2 website query. A: Volcano plot of mRNA differential expression; B: Volcano plot of long noncoding (lnc) RNA differential expression. Red points referred to upregulated differentially expressed genes; green points referred to downregulated differentially expressed genes; grey points referred to non-differentially expressed genes; C: RP5-881L22.5 expression in the 33 cancers of The Cancer Genome Atlas. Log2FC > 1.0 or < -1.0 and q value < 0.05 were defined as a significant difference. Red points referred to tumor tissues; green points referred to normal tissues; D: Expression level of RP5-881L22.5 among colon adenocarcinoma, rectum adenocarcinoma, stomach adenocarcinoma and esophageal carcinoma (The Cancer Genome Atlas). Red referred to tumor tissues; blue referred to normal tissues (include data of GTEx); “a” referred to log2FC > 1.0 and q value < 0.01. ACC: Adrenocortical carcinoma; BLCA: Bladder urothelial carcinoma; BRCA: Breast invasive carcinoma; CESC: Cervical squamous cell carcinoma and endocervical adenocarcinoma; CHOL: Cholangiocarcinoma; COAD: Colon adenocarcinoma; DLBC: Lymphoid Neoplasm Diffuse Large B-cell Lymphoma; ESCA: Esophageal carcinoma; GBM: Glioblastoma multiforme; HNSC: Head and neck squamous cell carcinoma; KICH: Kidney chromophobe; KIRC: Clear cell renal cell carcinoma; KIRP: Kidney renal papillary cell carcinoma; LAML: Acute myeloid leukemia; LGG: Brain lower grade glioma; LIHC: Liver hepatocellular carcinoma; LUAD: Lung adenocarcinoma; LUSC: Lung squamous cell carcinoma; MESO: Mesothelioma; N: Normal; OV: Ovarian serous cystadenocarcinoma; PAAD: Pancreatic adenocarcinoma; PCPG: Pheochromocytoma and Paraganglioma; PRAD: Prostate adenocarcinoma; READ: Rectum adenocarcinoma; SARC: Sarcoma; SKCM: Skin Cutaneous Melanoma; STAD: Stomach adenocarcinoma; T: Tumor; TGCT: Testicular Germ Cell Tumors; THCA: Thyroid carcinoma; THYM: Thymoma; UCEC: Uterine corpus endometrial carcinoma; UCS: Uterine carcinosarcoma; UVM: Uveal melanoma.
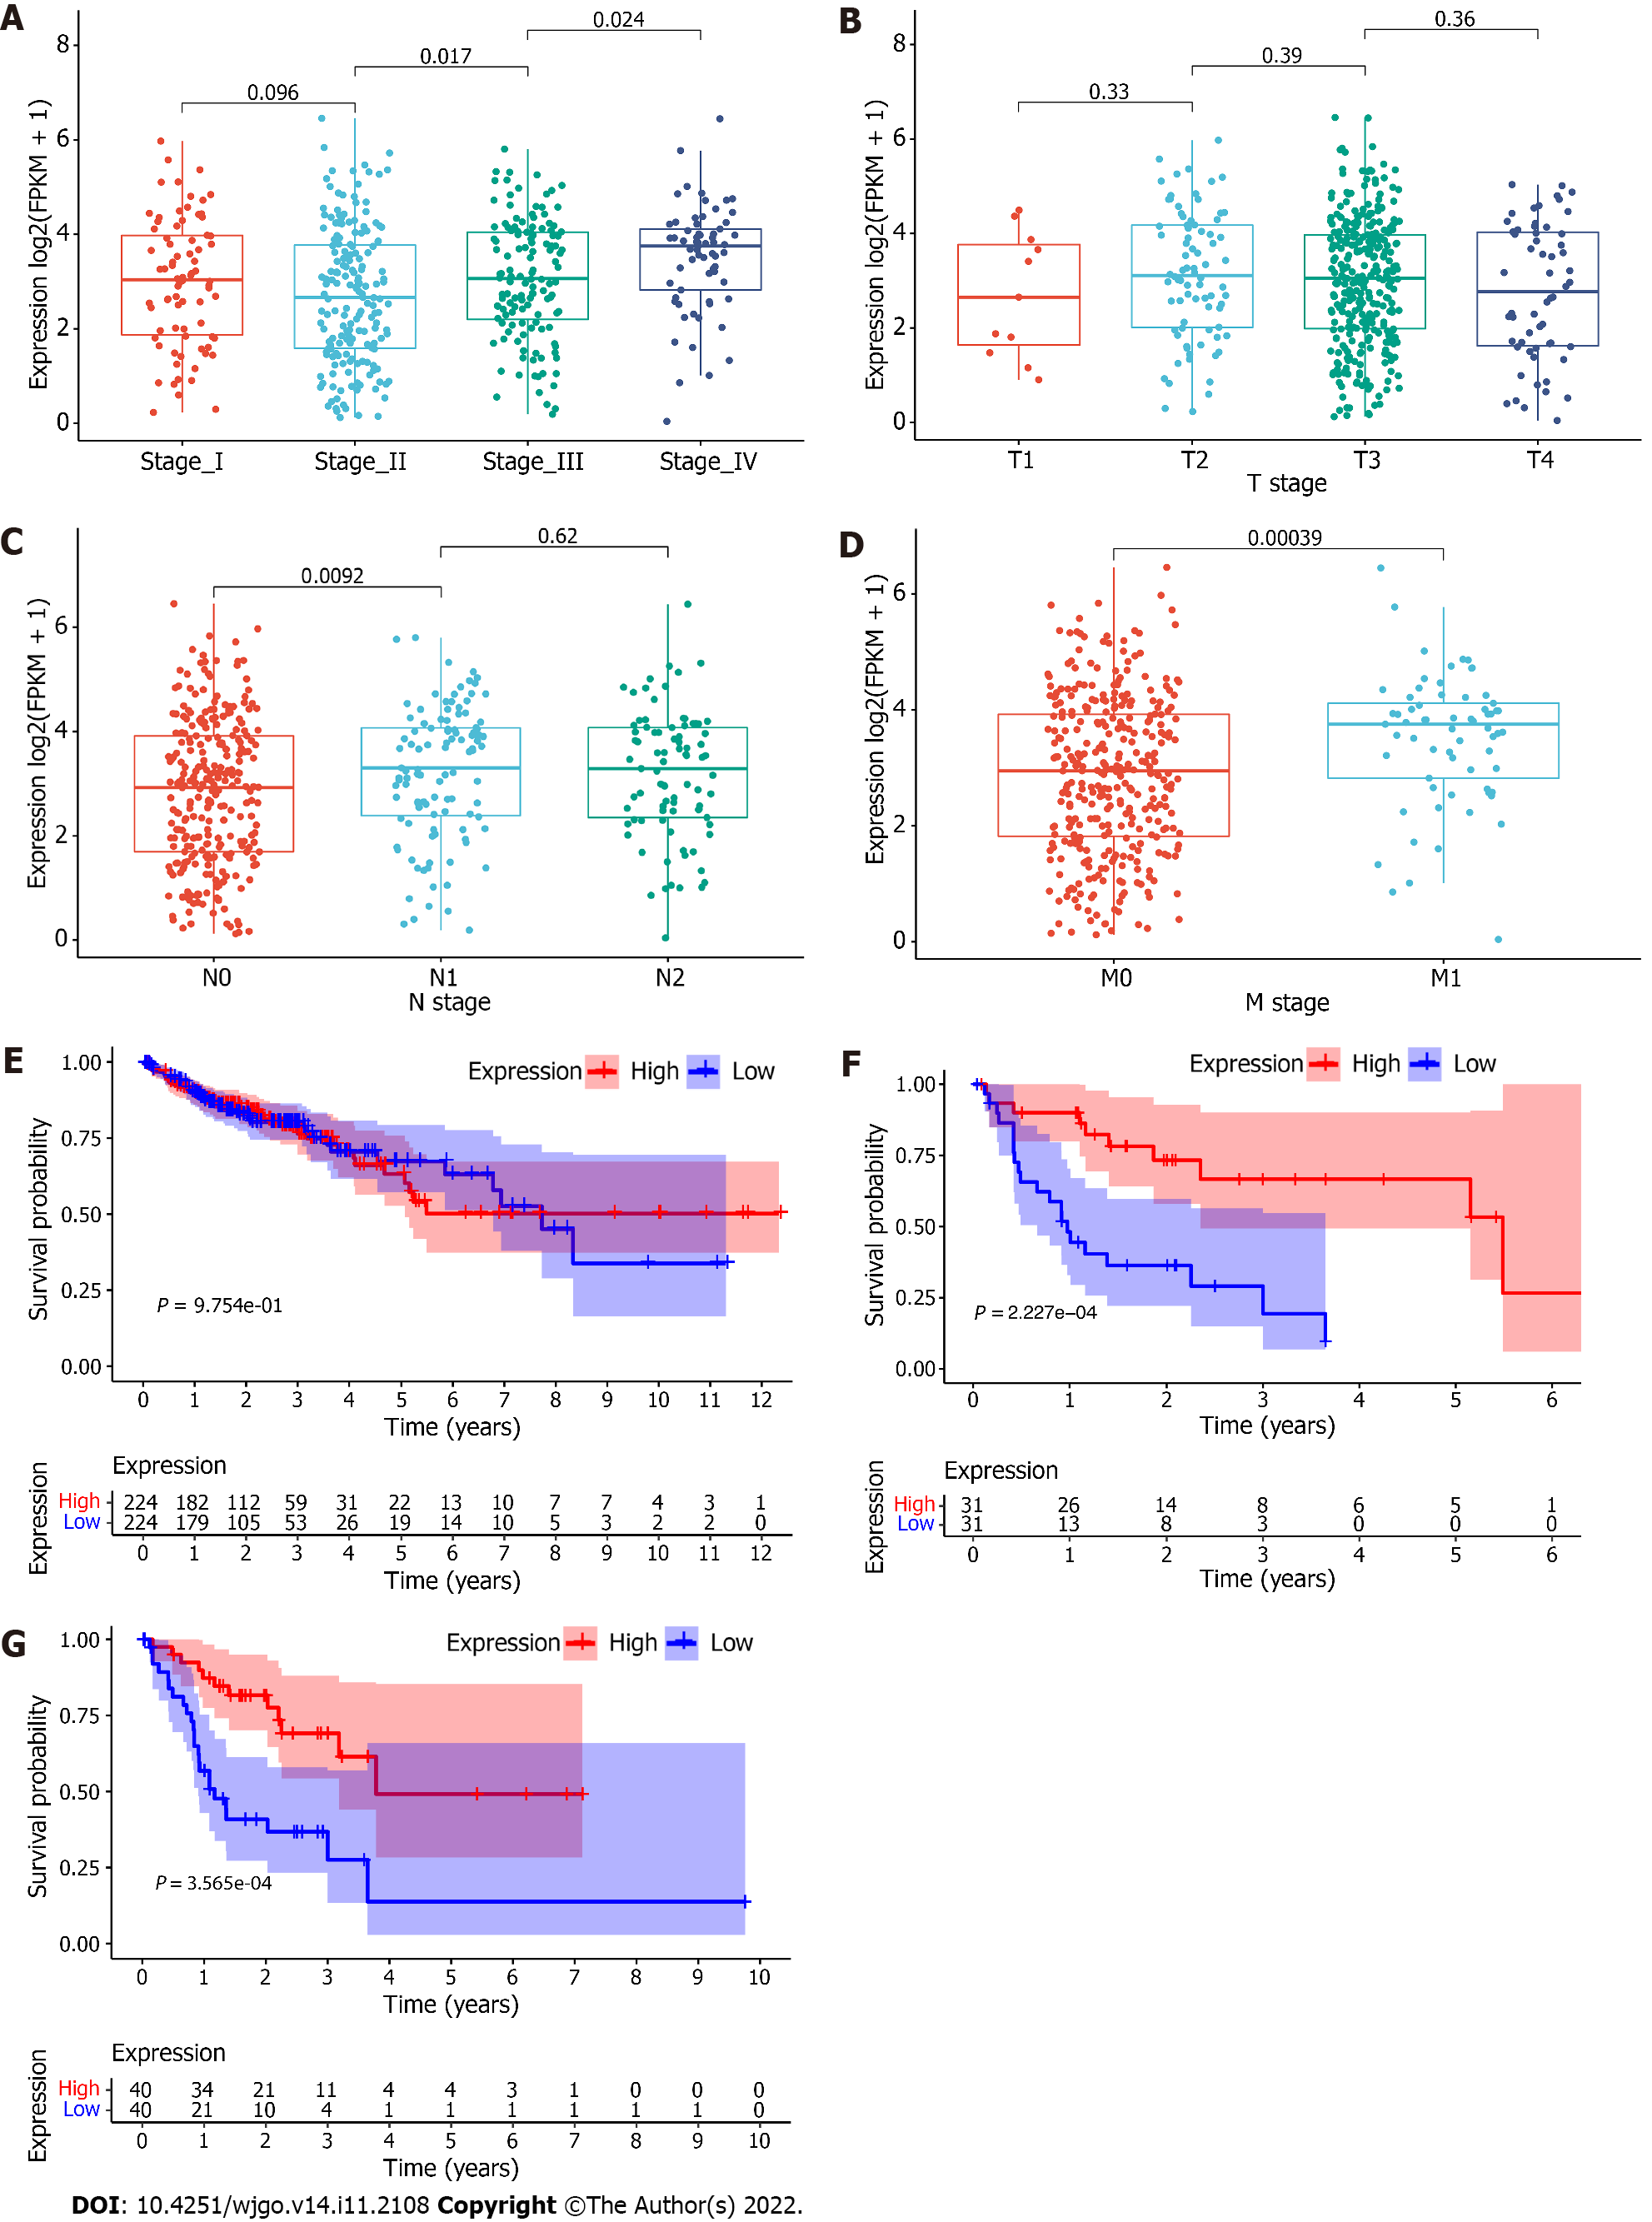
Figure 2 Association between the expression level of RP5-881L22.
5 and clinical characteristics. A: Association between expression and TNM stage; B: Association between expression and T stage; C: Association between expression and N stage; D: The association between expression and M stage; E: Kaplan-Meier survival curve of the population at all stages; F: Stage IV; G: N2 stage. Red referred to the higher expression group, and blue referred to the lower expression group (grouped by median expression of RP5-881L22.5).
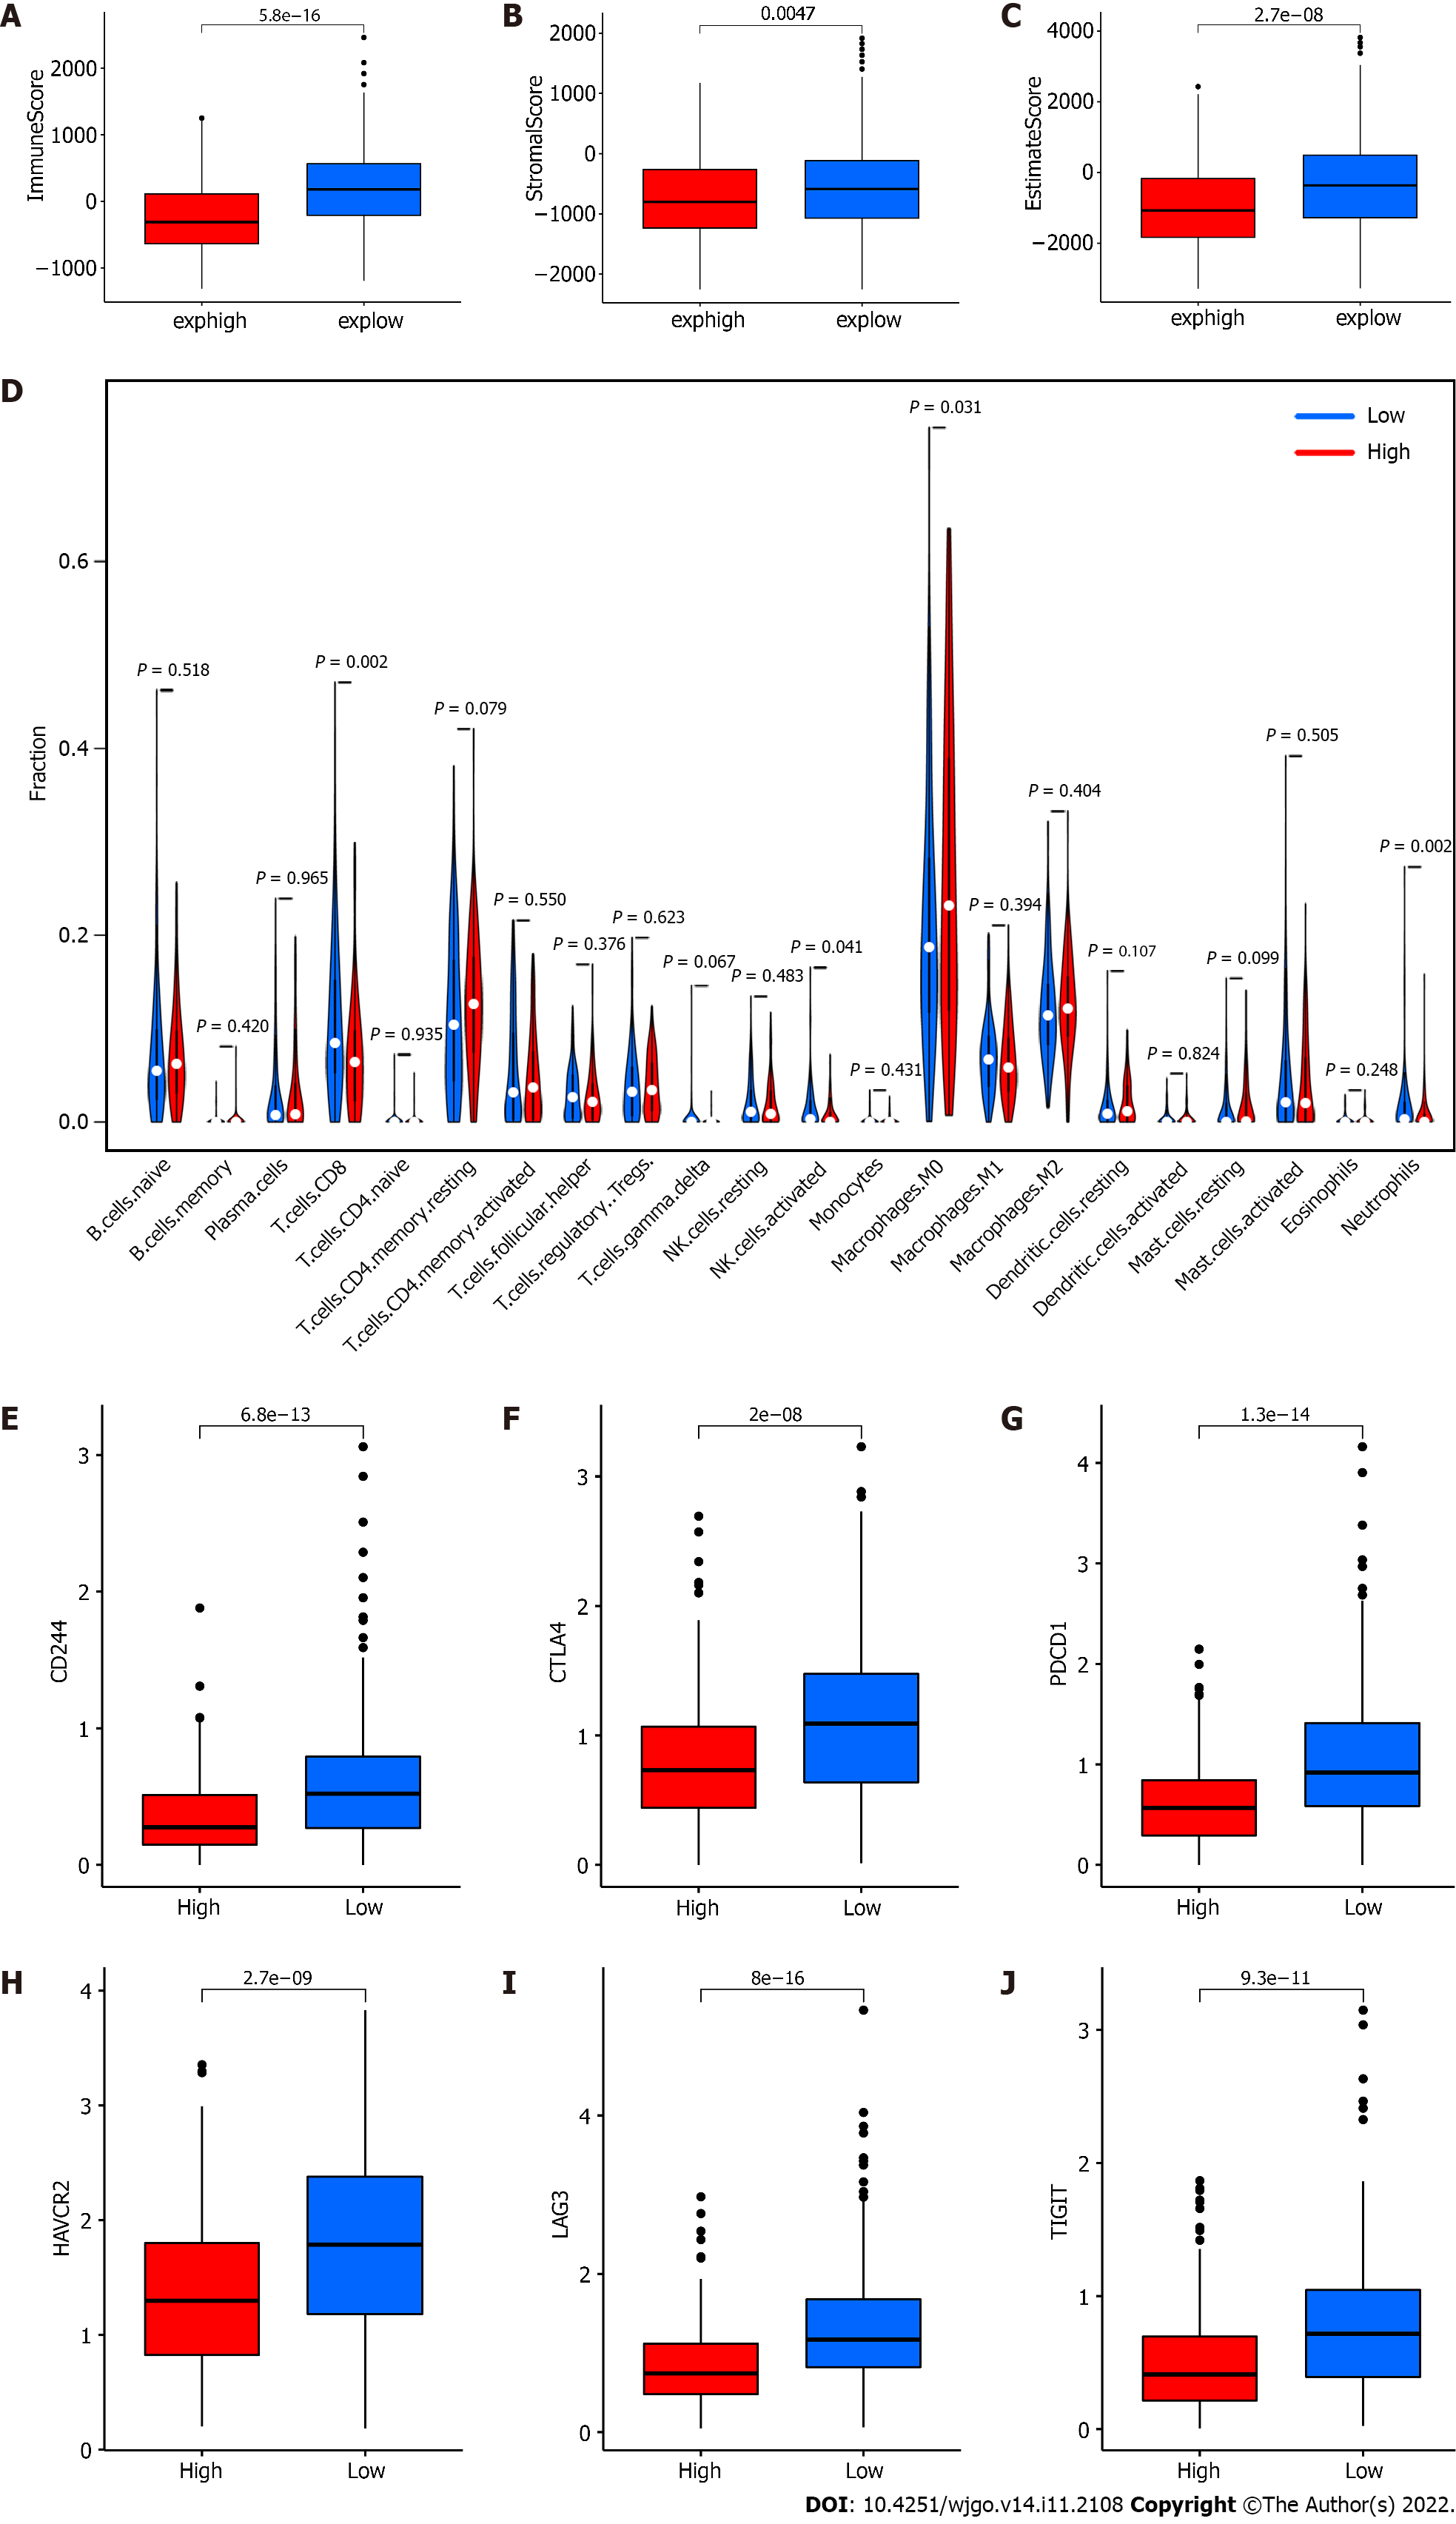
Figure 3 Distribution of tumor microenvironment scores, 22 types of immune cells and expression of T lymphocyte coinhibitory receptor genes between different groups.
A: ImmuneScore, P = 5.8 × 10⁻¹⁶; B: StromalScore, P = 0.0047; C: EstimateScore, P = 2.7 × 10⁻⁸; D: The 22 immune cell types were represented in columns, and the proportions of immune cells were represented in rows; E: Expression of CD244, P = 6.8 × 10⁻¹³; F: Expression of CTLA4, P = 2.0 × 10⁻⁸; G: Expression of PDCD1, P = 1.3 × 10⁻¹⁴; H: Expression of HAVCR2, P = 2.7 × 10⁻⁹; I: Expression of LAG3, P = 8.0 × 10⁻¹⁶; J: Expression of TIGIT, P = 9.3 × 10⁻¹¹. Red referred to the high expression group, and blue referred to the low expression group (grouped by median of RP5-881L22.5 expression). NK: Natural killer; exphigh: Expression high; explow: Expression low.
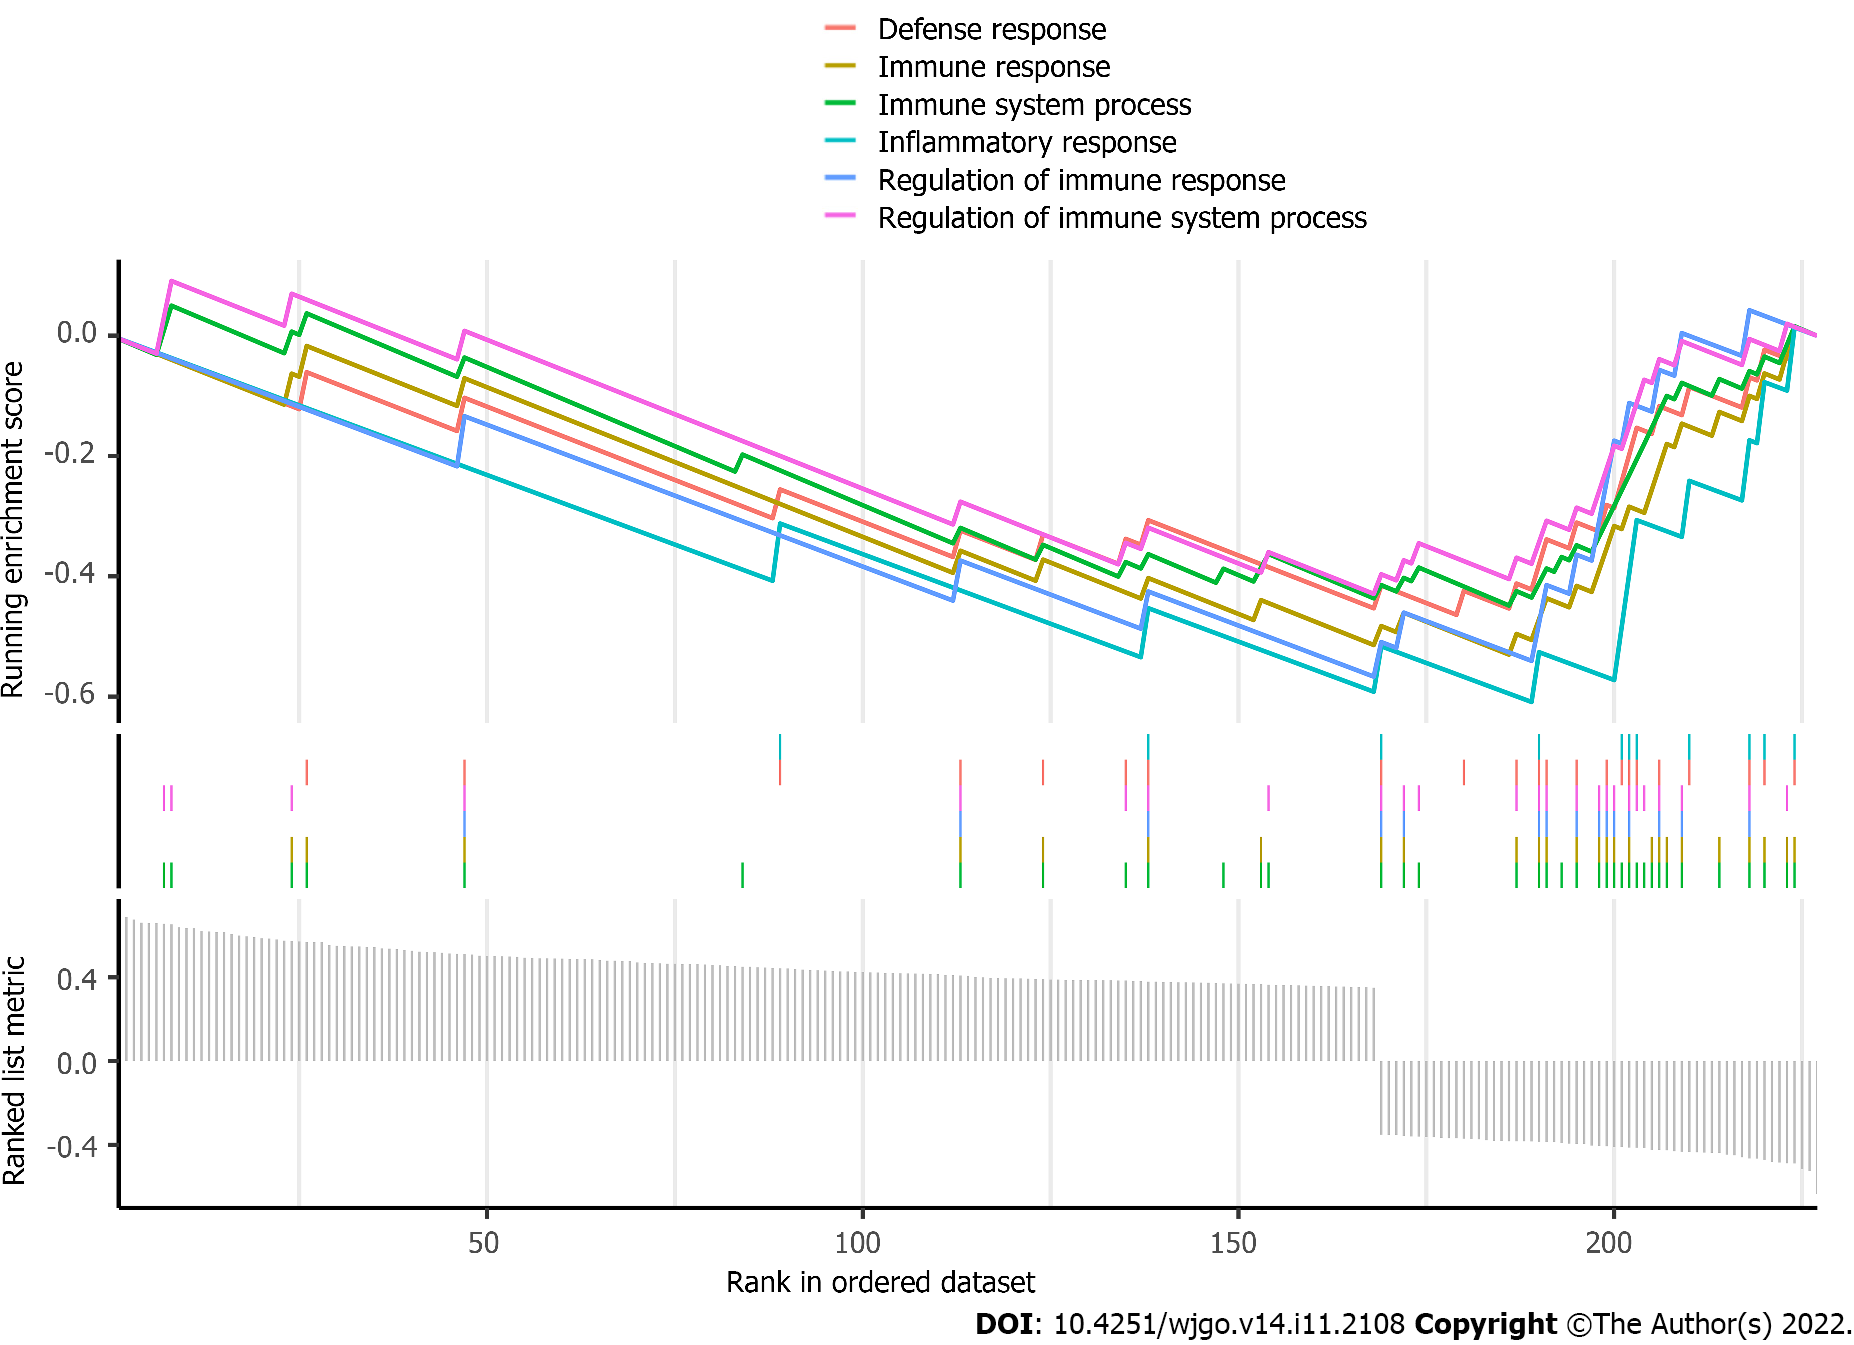
Figure 4 Gene set enrichment analysis for the differentially expressed mRNAs.
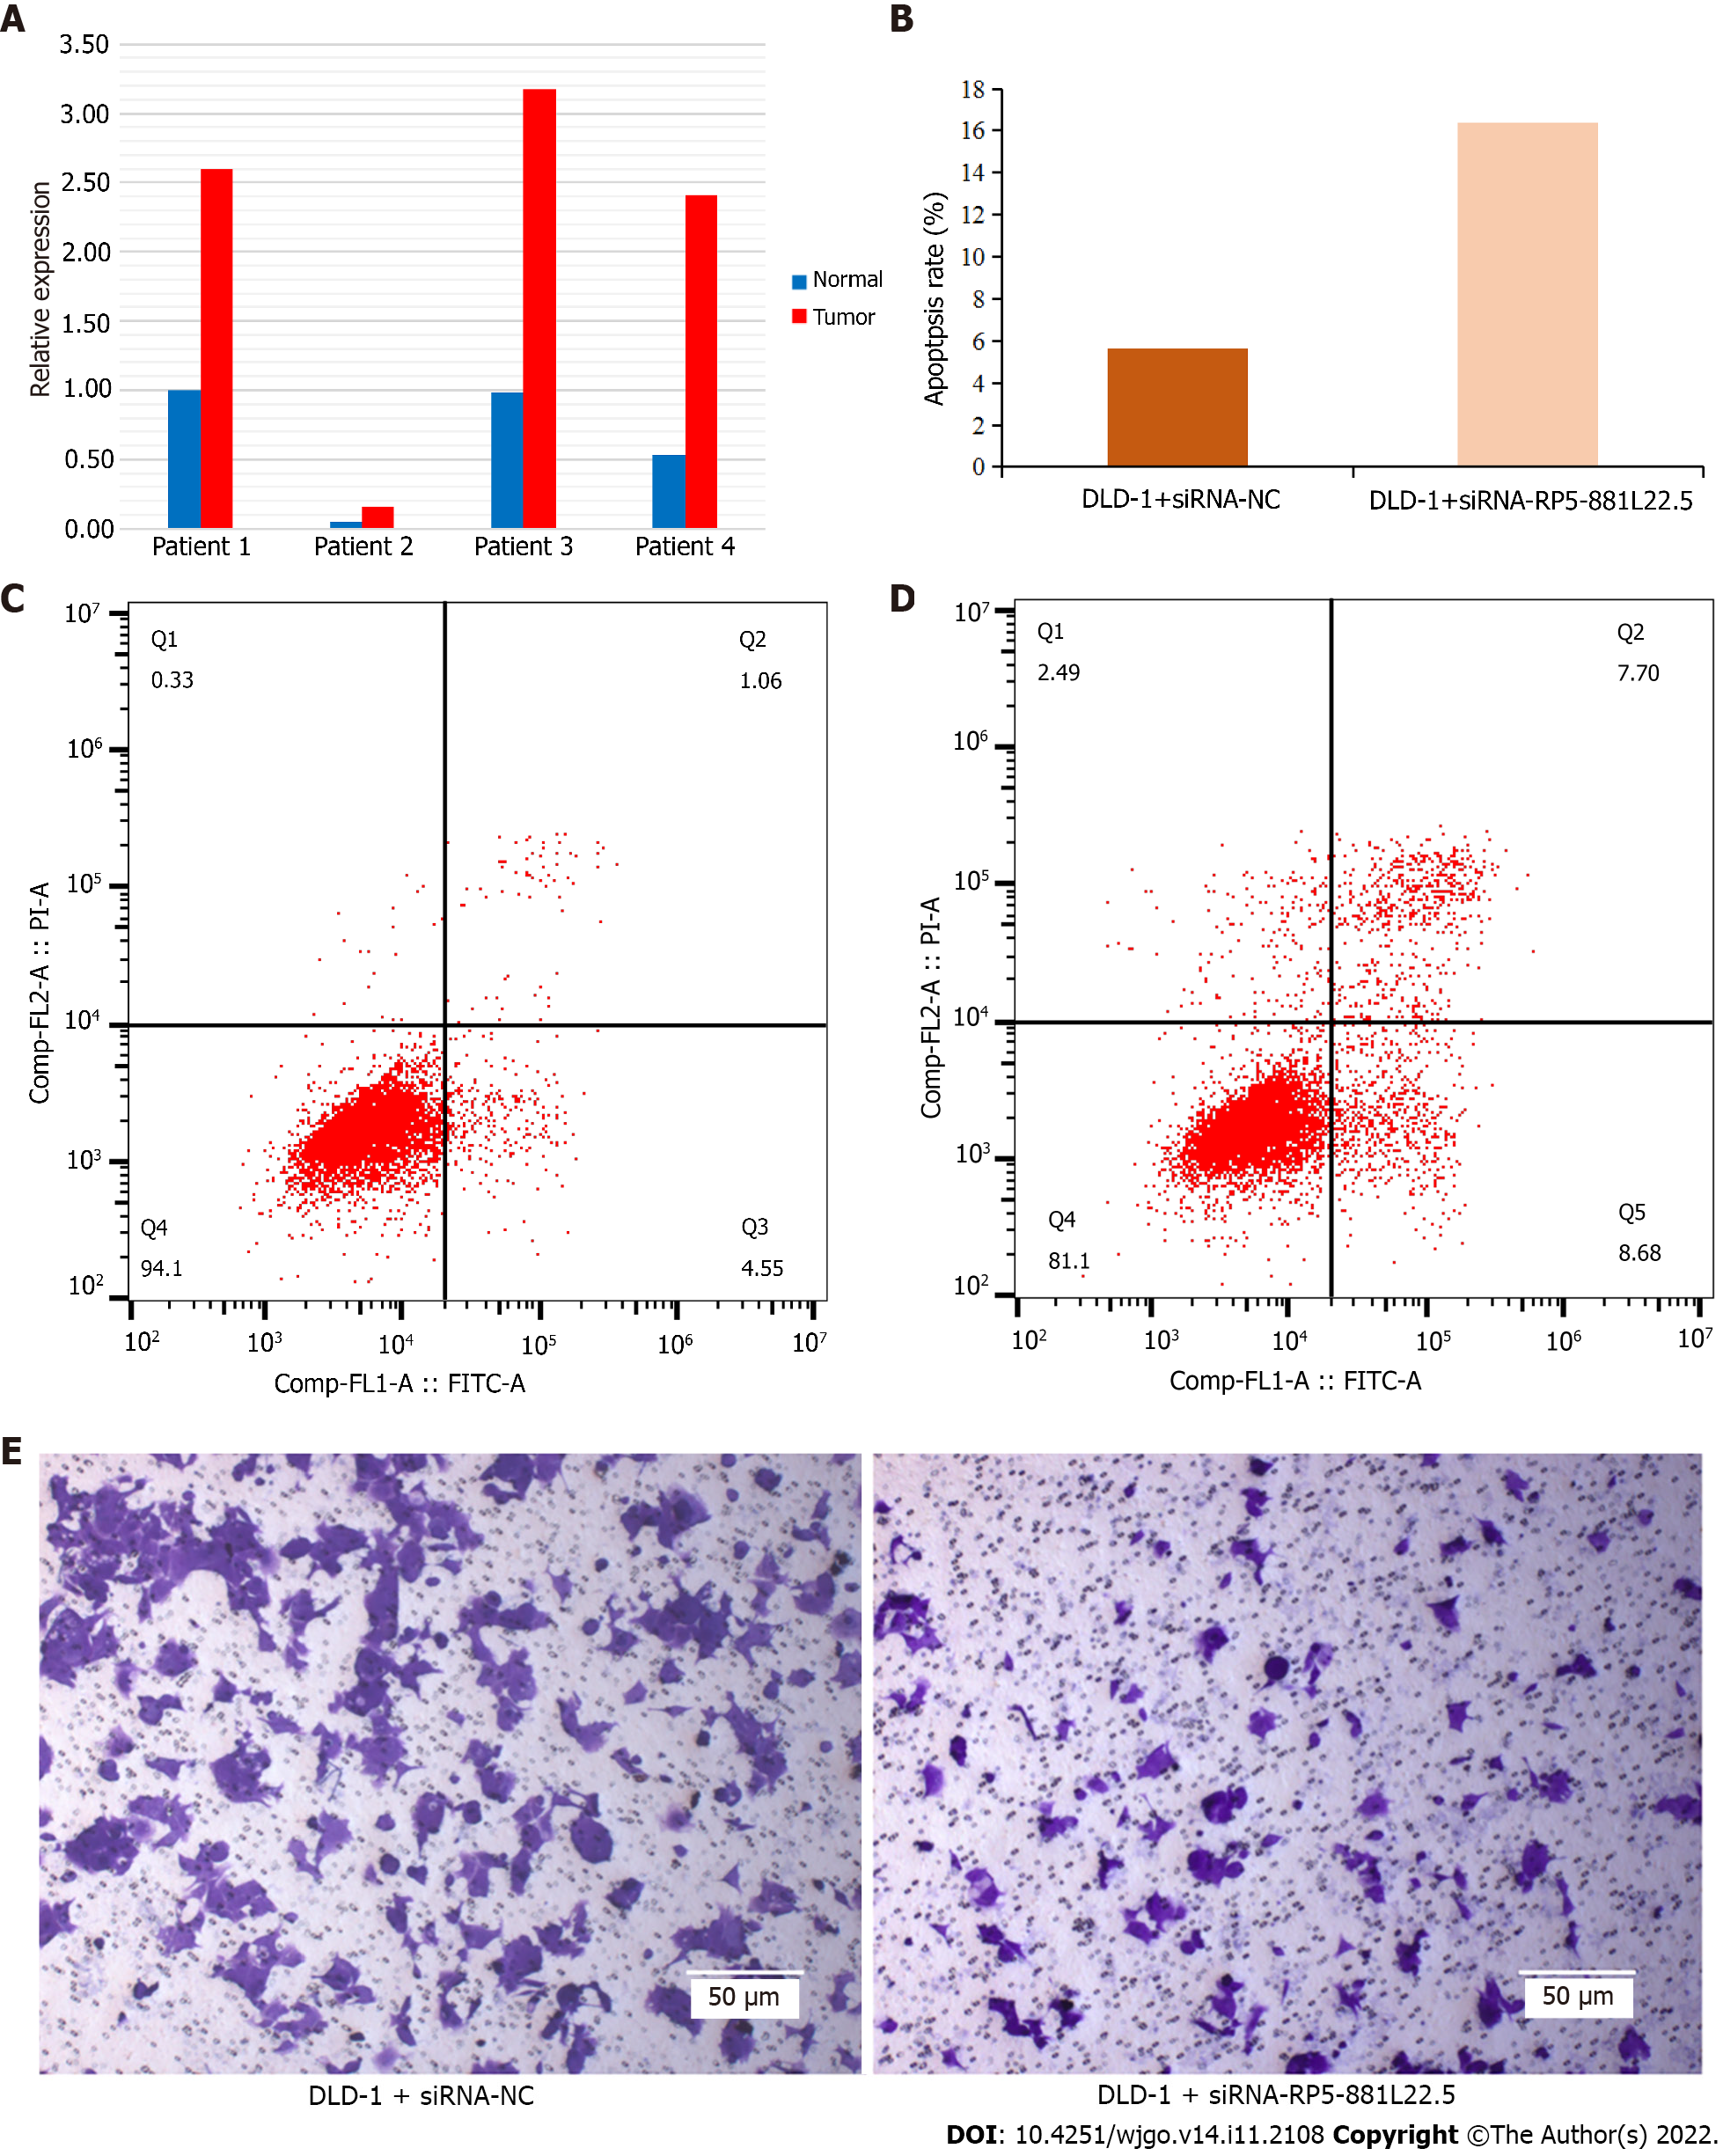
Figure 5 Results of quantitative reverse transcription PCR for clinical specimens and cellular experiments.
A: Expression level of RP5-881L22.5 in tumor tissues and normal tissues among 4 patients’ surgical samples. Red referred to tumor tissues, and blue referred to adjacent normal tissues; B: The apoptosis ratio difference between siRNA + negative control (NC) group and siRNA + RP5-881L22.5; C: Representative image of the siRNA + NC by flow cytometry; D: Representative image of the siRNA+RP5-881L22.5 by flow cytometry; E: Effect of knockdown of RP5-881L22.5 on the transwell invasion assay of colorectal cancer cells. Scale bars: 50 μm. The magnification is 100 times the original size. Left: Representative image of the siRNA + NC; Right: Representative image of the siRNA + RP5-881L22.5.
- Citation: Zong H, Zou JQ, Huang JP, Huang ST. Potential role of long noncoding RNA RP5-881L22.5 as a novel biomarker and therapeutic target of colorectal cancer. World J Gastrointest Oncol 2022; 14(11): 2108-2121
- URL: https://www.wjgnet.com/1948-5204/full/v14/i11/2108.htm
- DOI: https://dx.doi.org/10.4251/wjgo.v14.i11.2108


