Copyright
©The Author(s) 2021.
World J Gastrointest Oncol. Nov 15, 2021; 13(11): 1709-1724
Published online Nov 15, 2021. doi: 10.4251/wjgo.v13.i11.1709
Published online Nov 15, 2021. doi: 10.4251/wjgo.v13.i11.1709
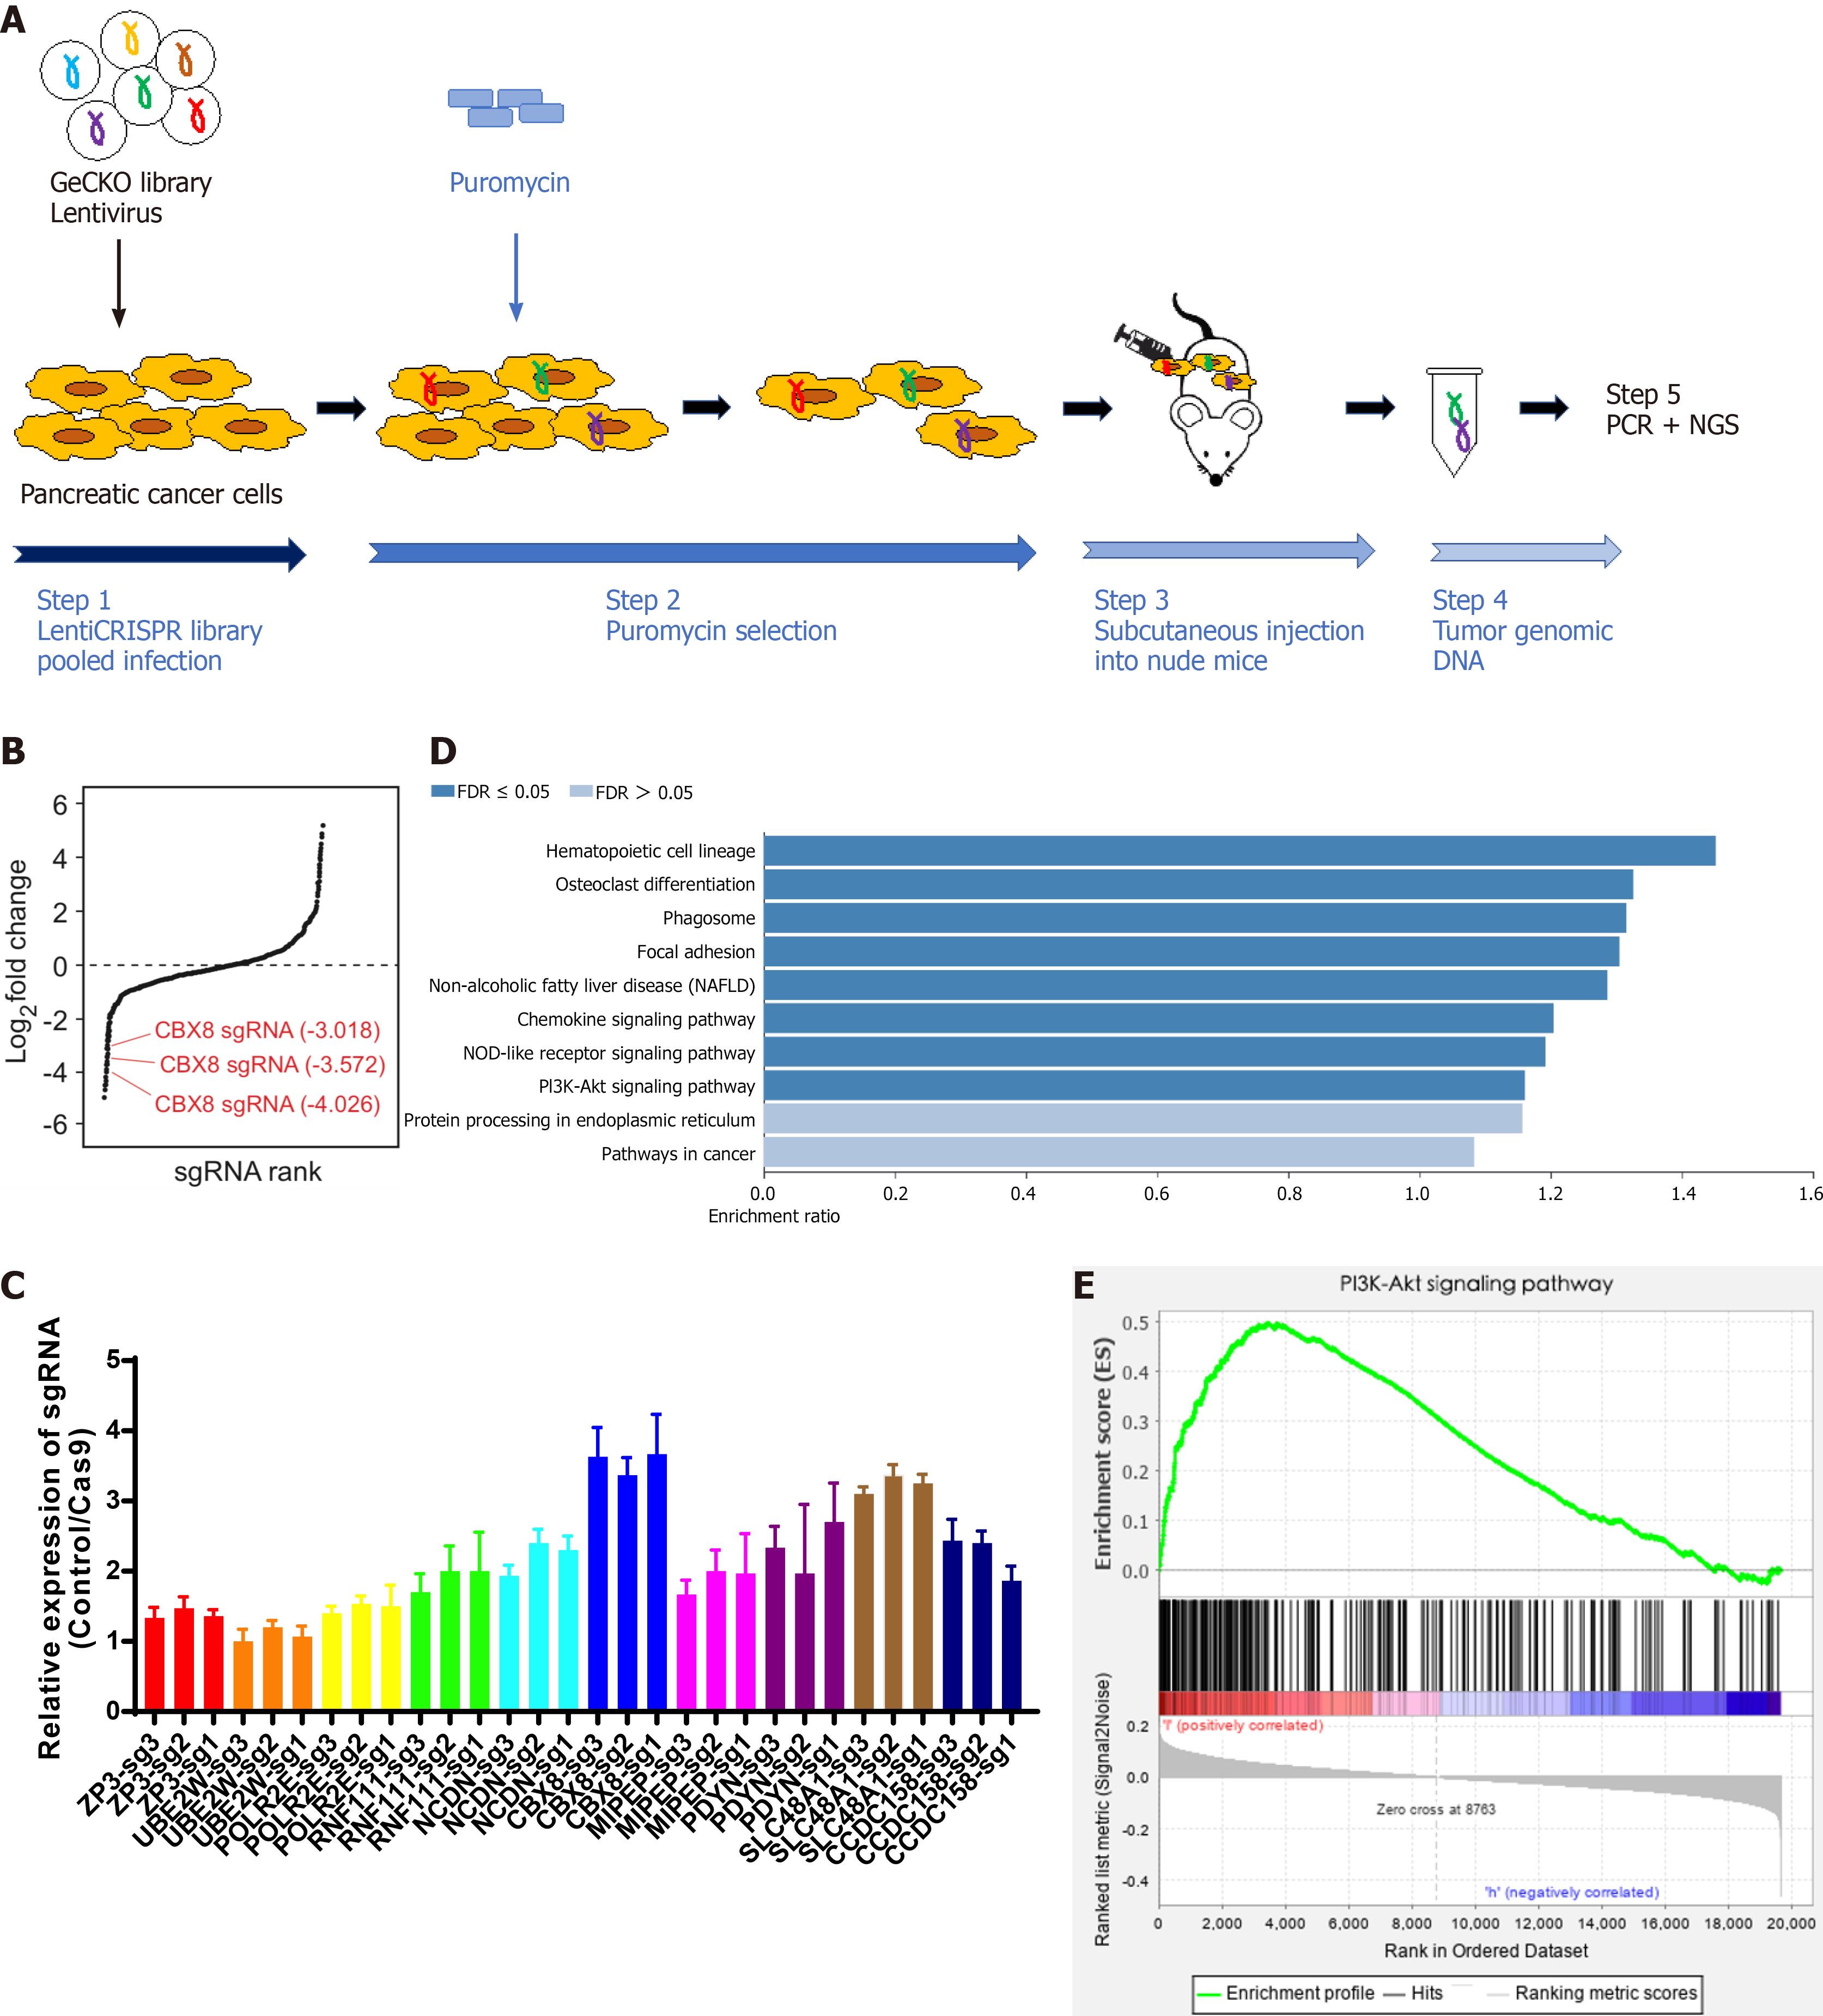
Figure 1 Genome-wide pooled sgRNA library screening identifies genes affecting growth of pancreatic cancer cells in vivo.
A: Schematic overview of experimental timeline and procedures of CRISPR/Cas9-based screening; B: Respective sgRNAs scored in negative selection CRISPR/Cas9 screening; C: Relative mRNA levels of top six sgRNAs detected by qPCR; D: KEGG pathway analysis of sgRNAs in negative selection CRISPR/Cas9 screening; E: GSEA of sgRNAs in the PI3K/AKT pathway.
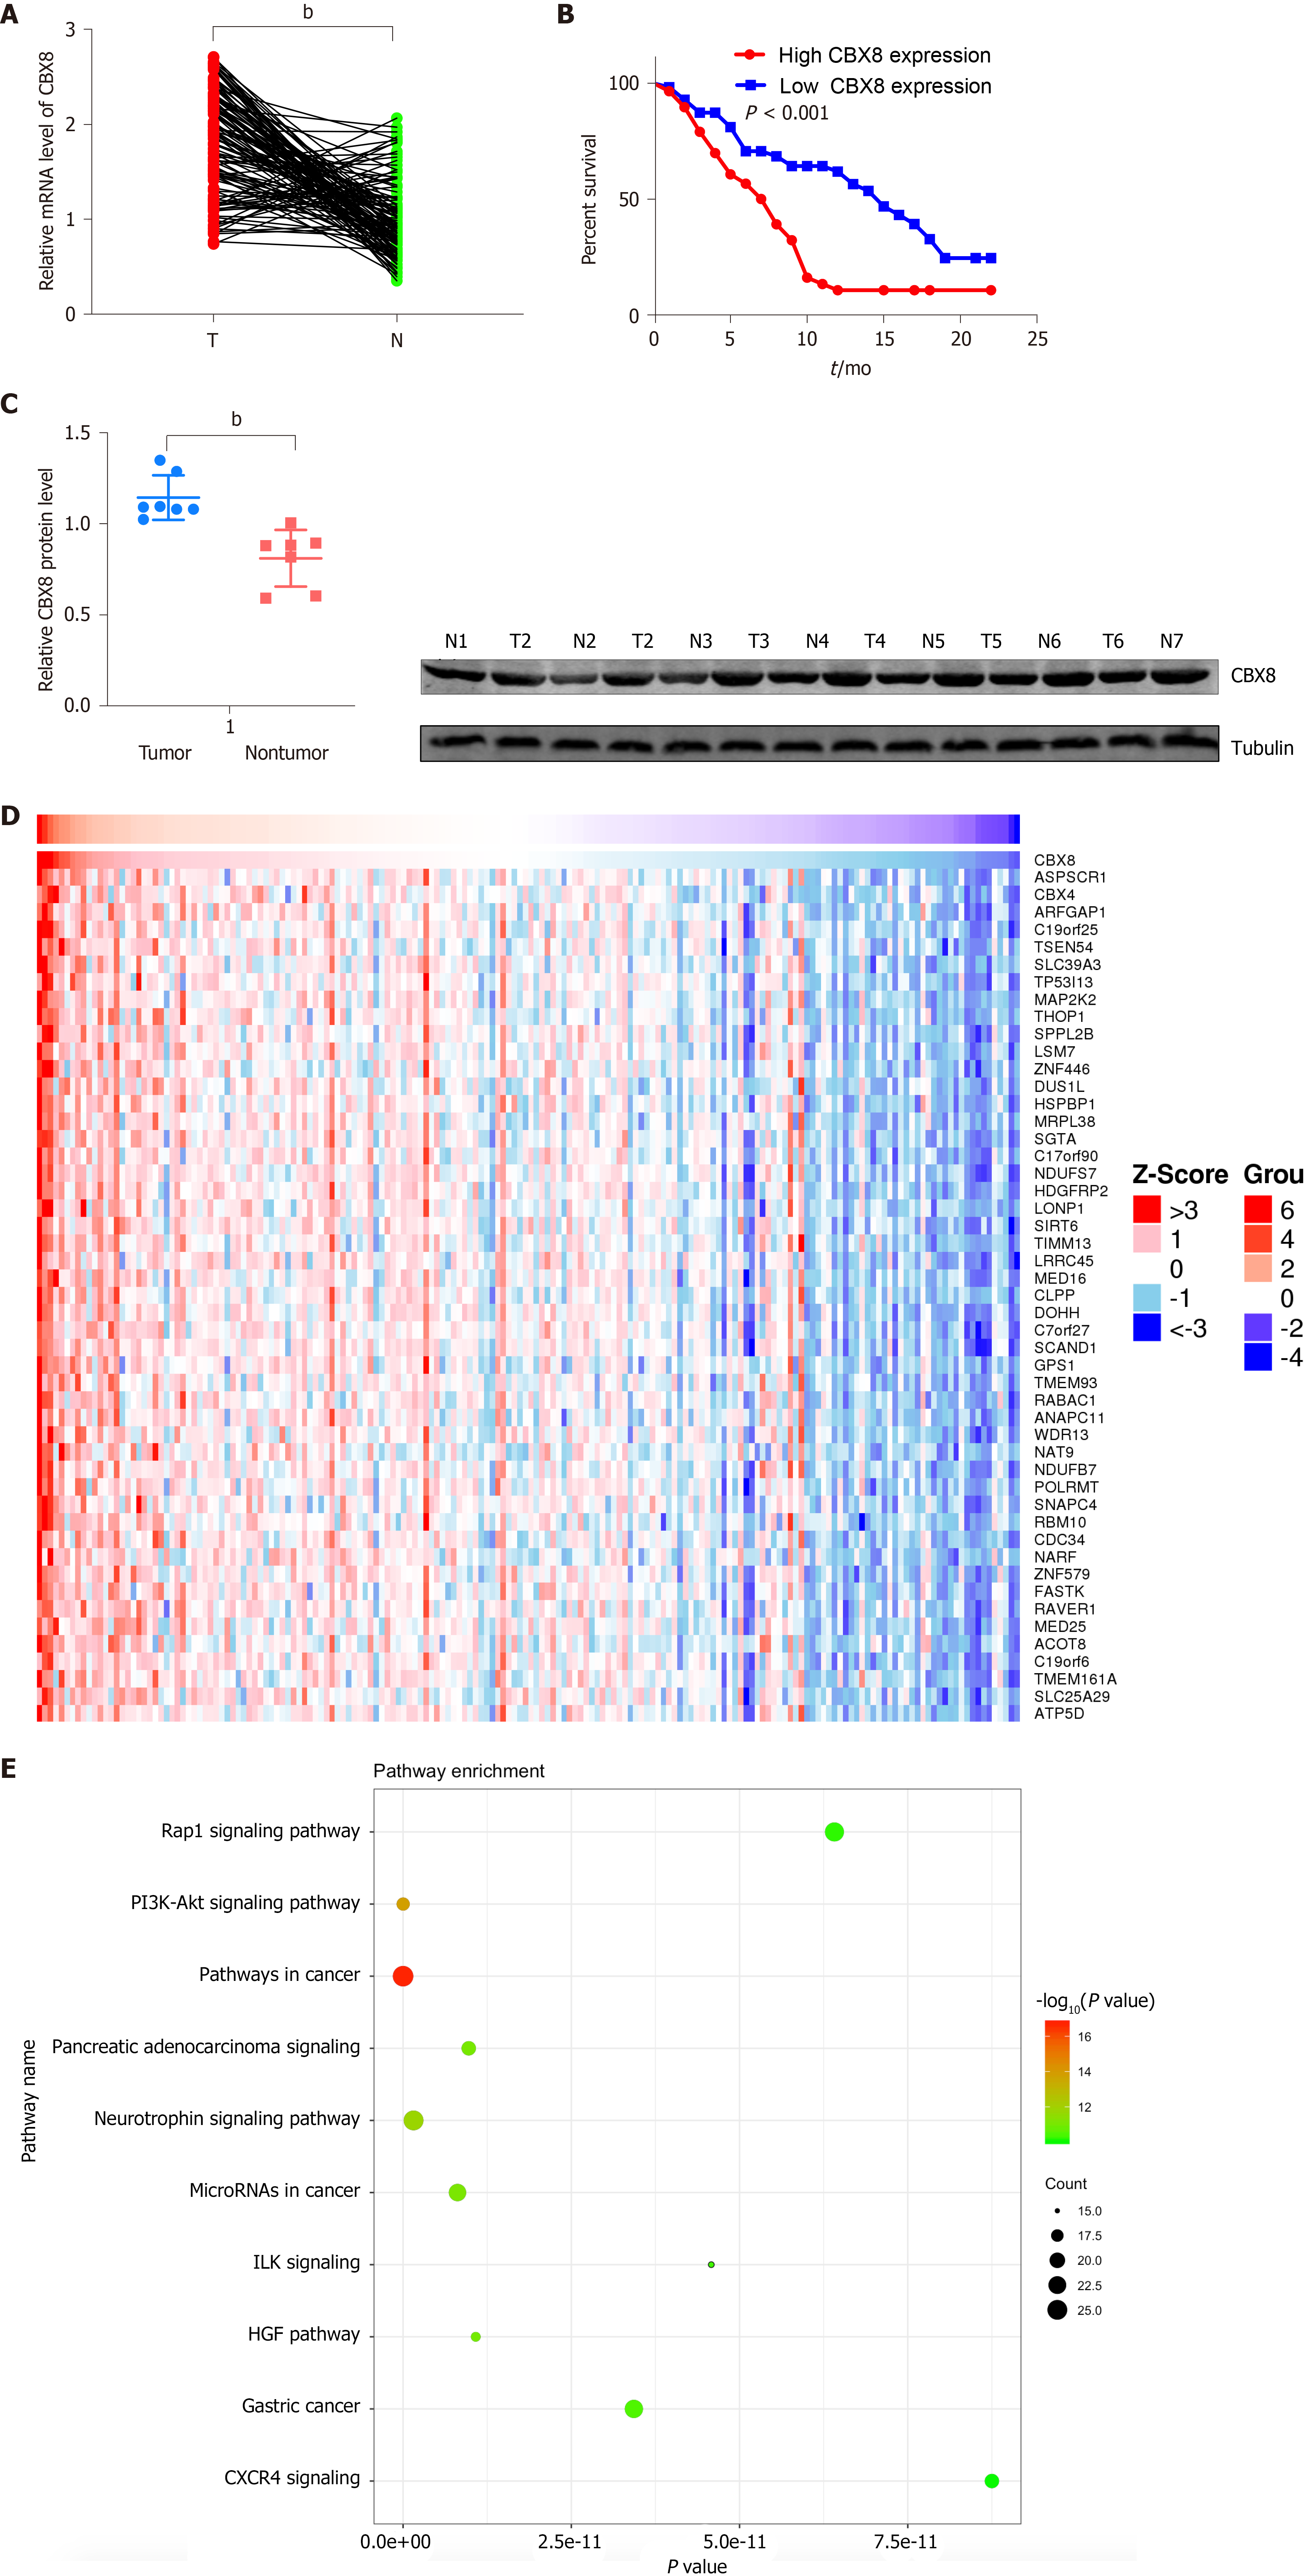
Figure 2 Higher CBX8 expression induces worse clinical outcome in pancreatic cancer tissue.
A: The mRNA expression of CBX8 in 116 paired pancreatic cancer (PC) and normal tissues measured by quantitative reverse transcription-PCR; B: Kaplan–Meier survival of patients with high and low CBX8 mRNA level; C: Protein expression of CBX8 in 20 paired PC and normal tissues measured by Western blot; D: Heatmap indicating genes positively related with CBX8; E: KEGG pathway analysis of genes in positive relation with CBX8. bP < 0.01.
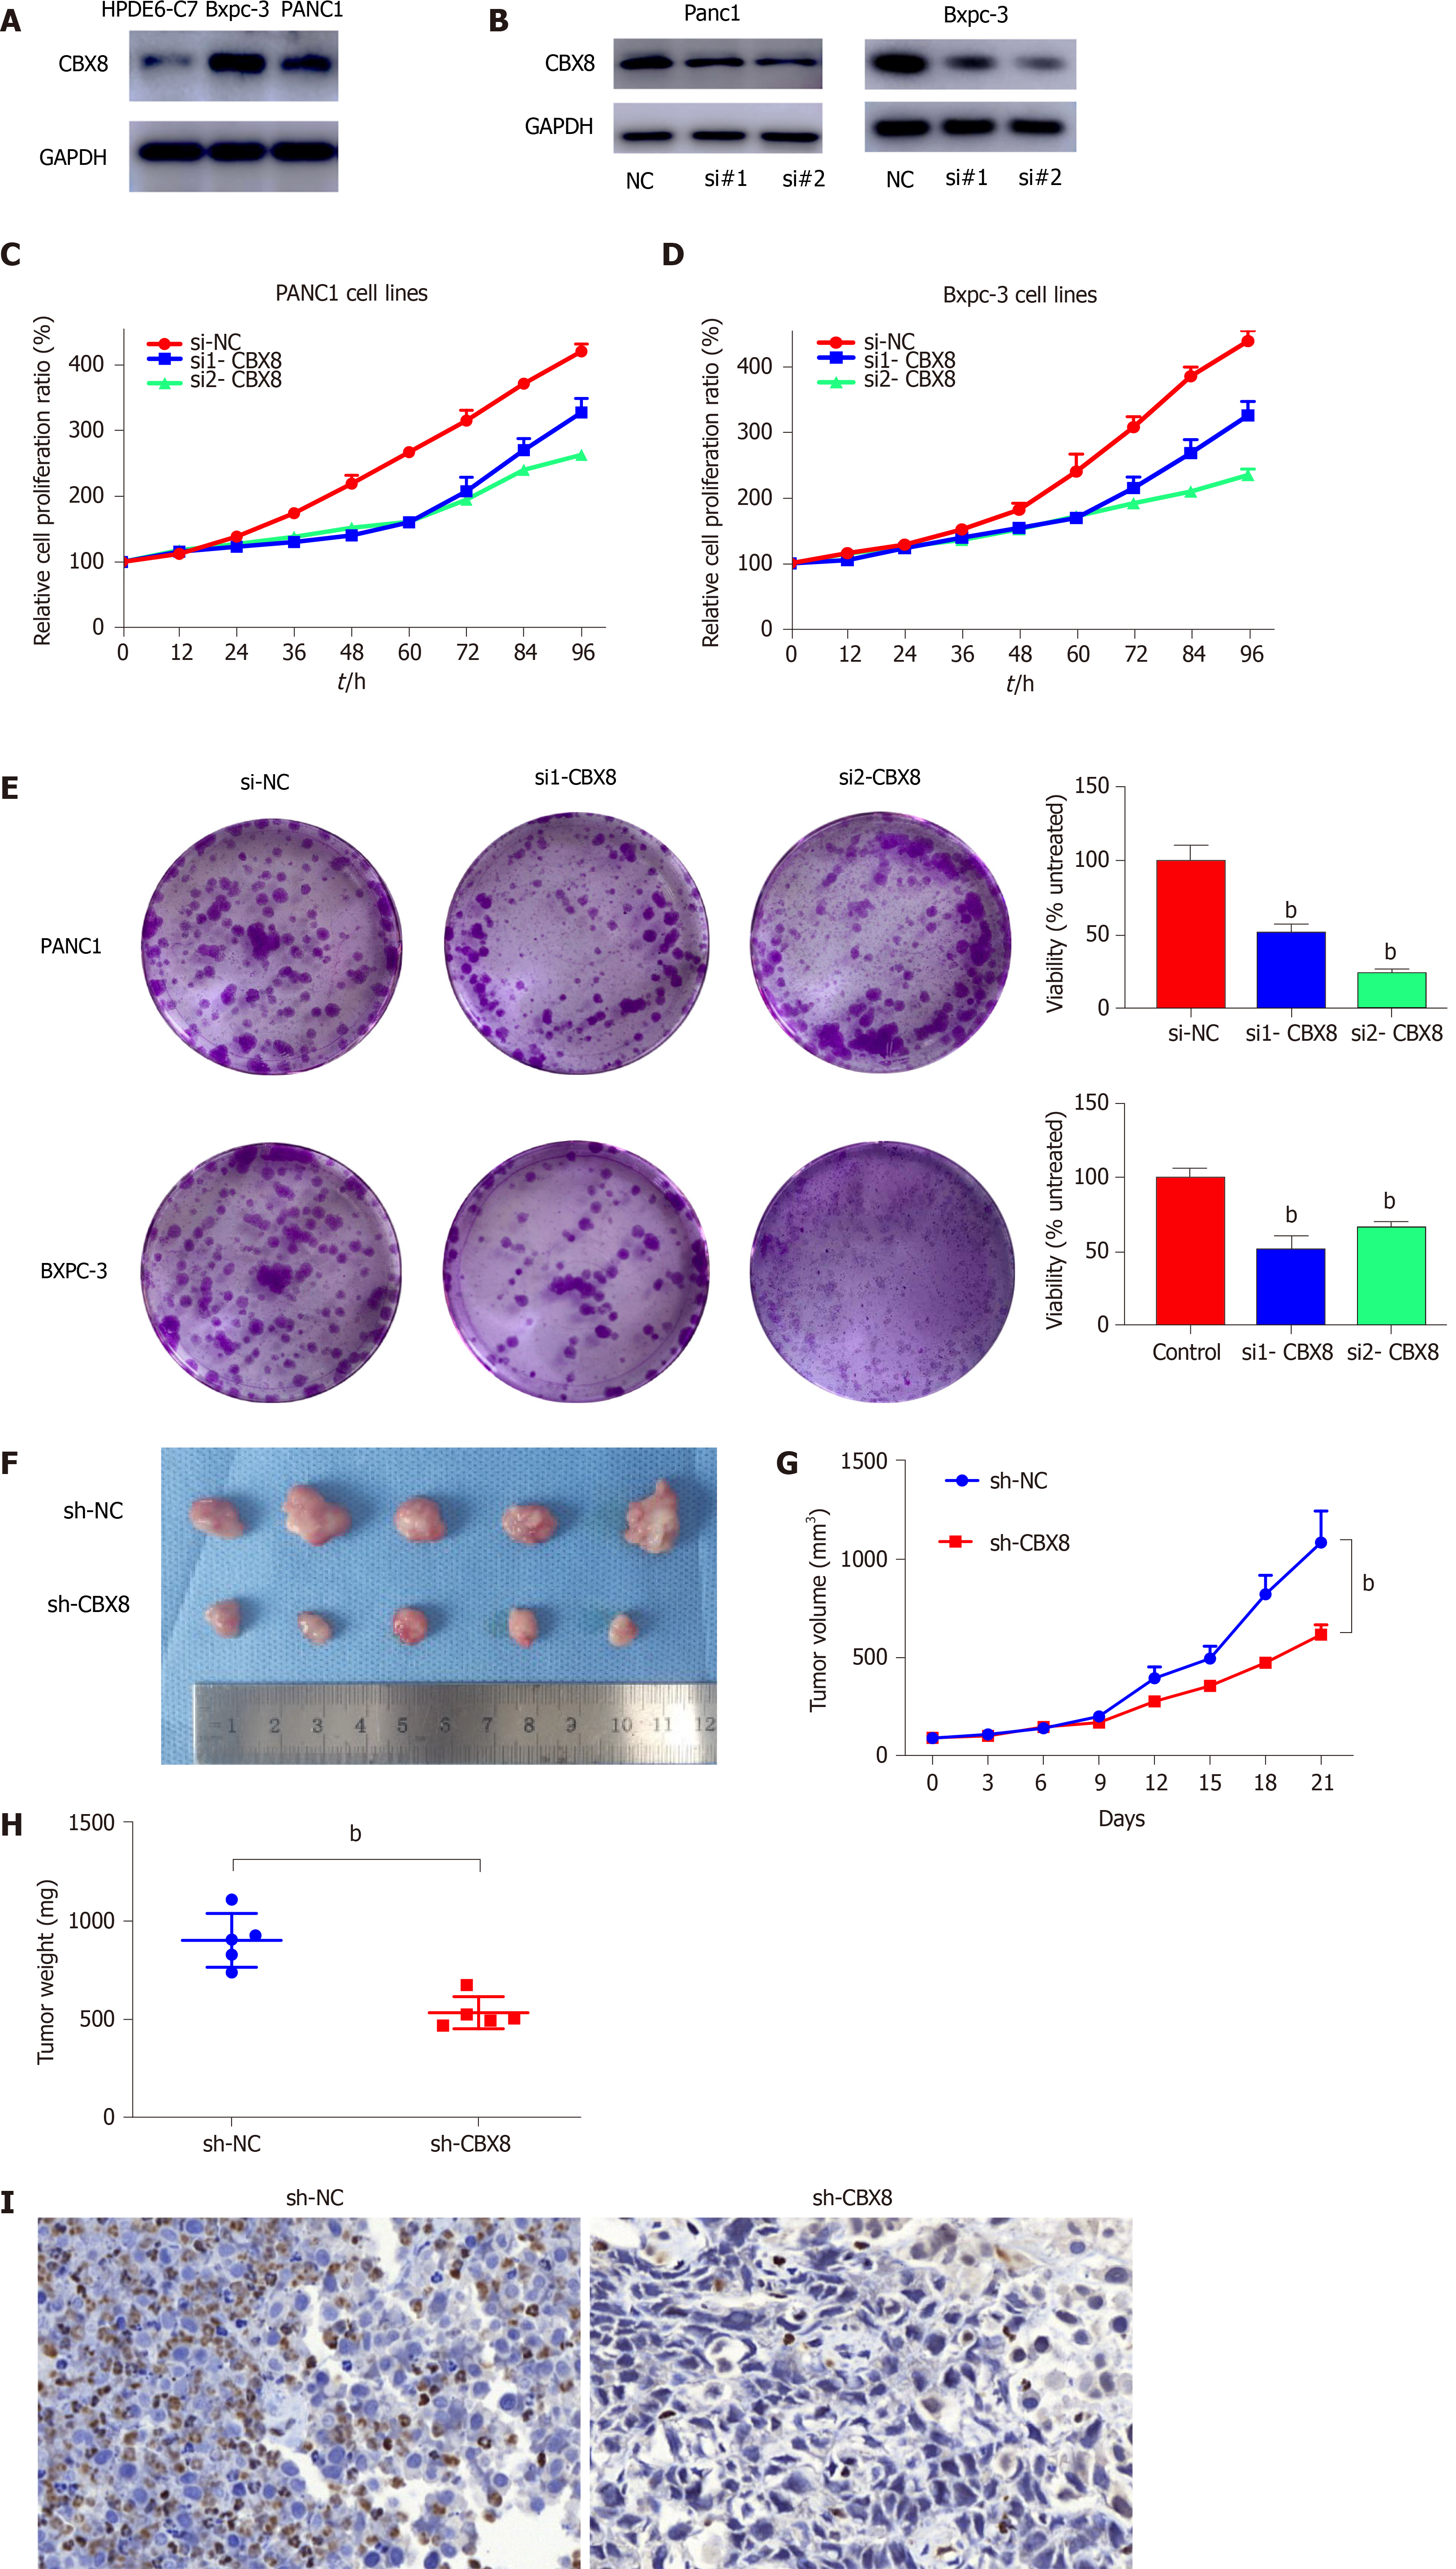
Figure 3 CBX8 is required for efficient proliferation of pancreatic cancer cells in vitro and in vivo.
A: Protein expression of CBX8 in pancreatic cancer (PC) cells and normal pancreatic cells; B: Western blot analysis of CBX8 knockdown efficiency in PC cells; C: Viability of PANC1 cells after transfection with CBX8 knockdown and control plasmids; D: Viability of BXPC-3 cells after transfection with CBX8 knockdown and control plasmids; E: Colony formation assay for evaluation of the effect of CBX8 on PC cell proliferation; F: Images of tumors harvested from each group; G: Tumor growth curve drawn based on the tumor size measured each week; H: Weight of tumors in each group; I: Representative images of immunohistochemistry staining for Ki67 in xenograft tumors. bP < 0.01.
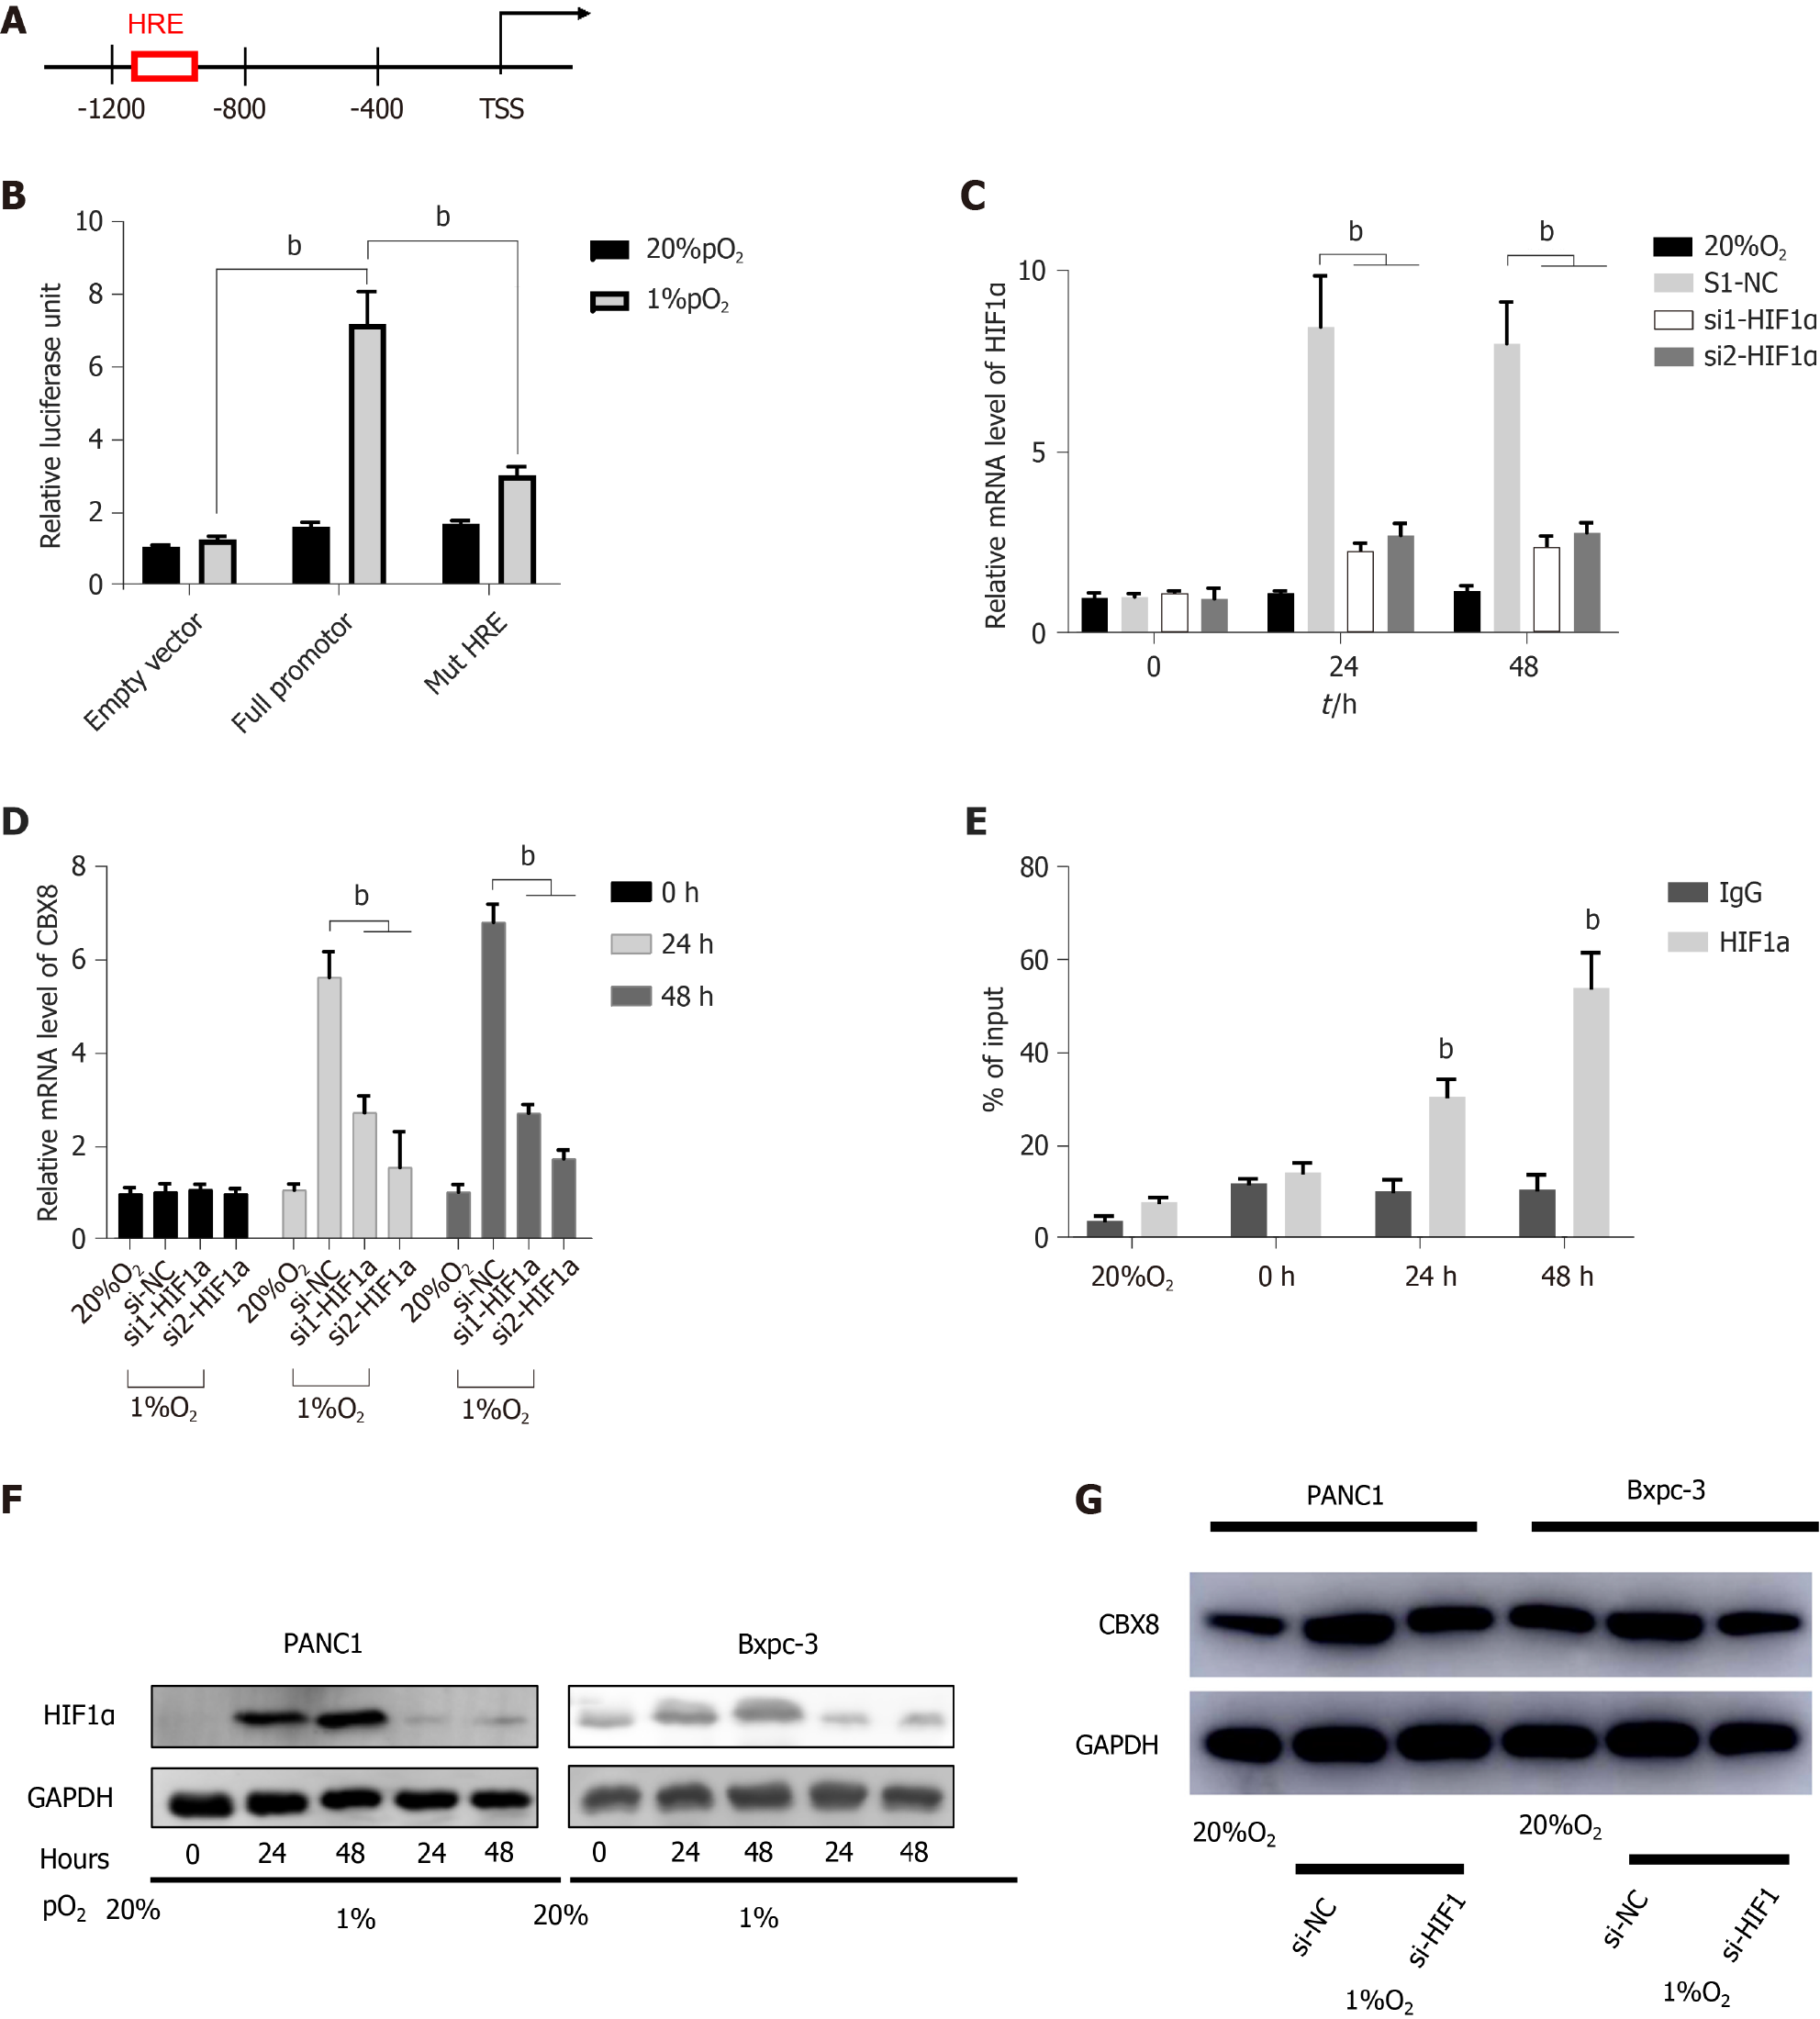
Figure 4 Hypoxia-inducible factor-1α modulates CBX8 expression transcriptionally in pancreatic cancer cells.
A: Human CBX8 promoter shown with HRE; B: 293T cells transfected with full HRE promoter and mutant HRE were cultured under normoxia or hypoxia for 48 h, and firefly luciferase activity determined relative to control Renilla luciferase; C: Quantitative reverse transcription-polymerase chain reaction for detecting hypoxia-inducible factor-1α (HIF-1α) knockdown efficiency under hypoxia; D: Expression level of CBX8 mRNA was evaluated and normalized to control group; E: Chromatin immunoprecipitation-qPCR analysis was used to determine the binding affinity of HIF-1α to CBX8 promoter regions; F and G: Expression levels of HIF-1α and CBX8 protein were evaluated and normalized to control group. bP < 0.01.
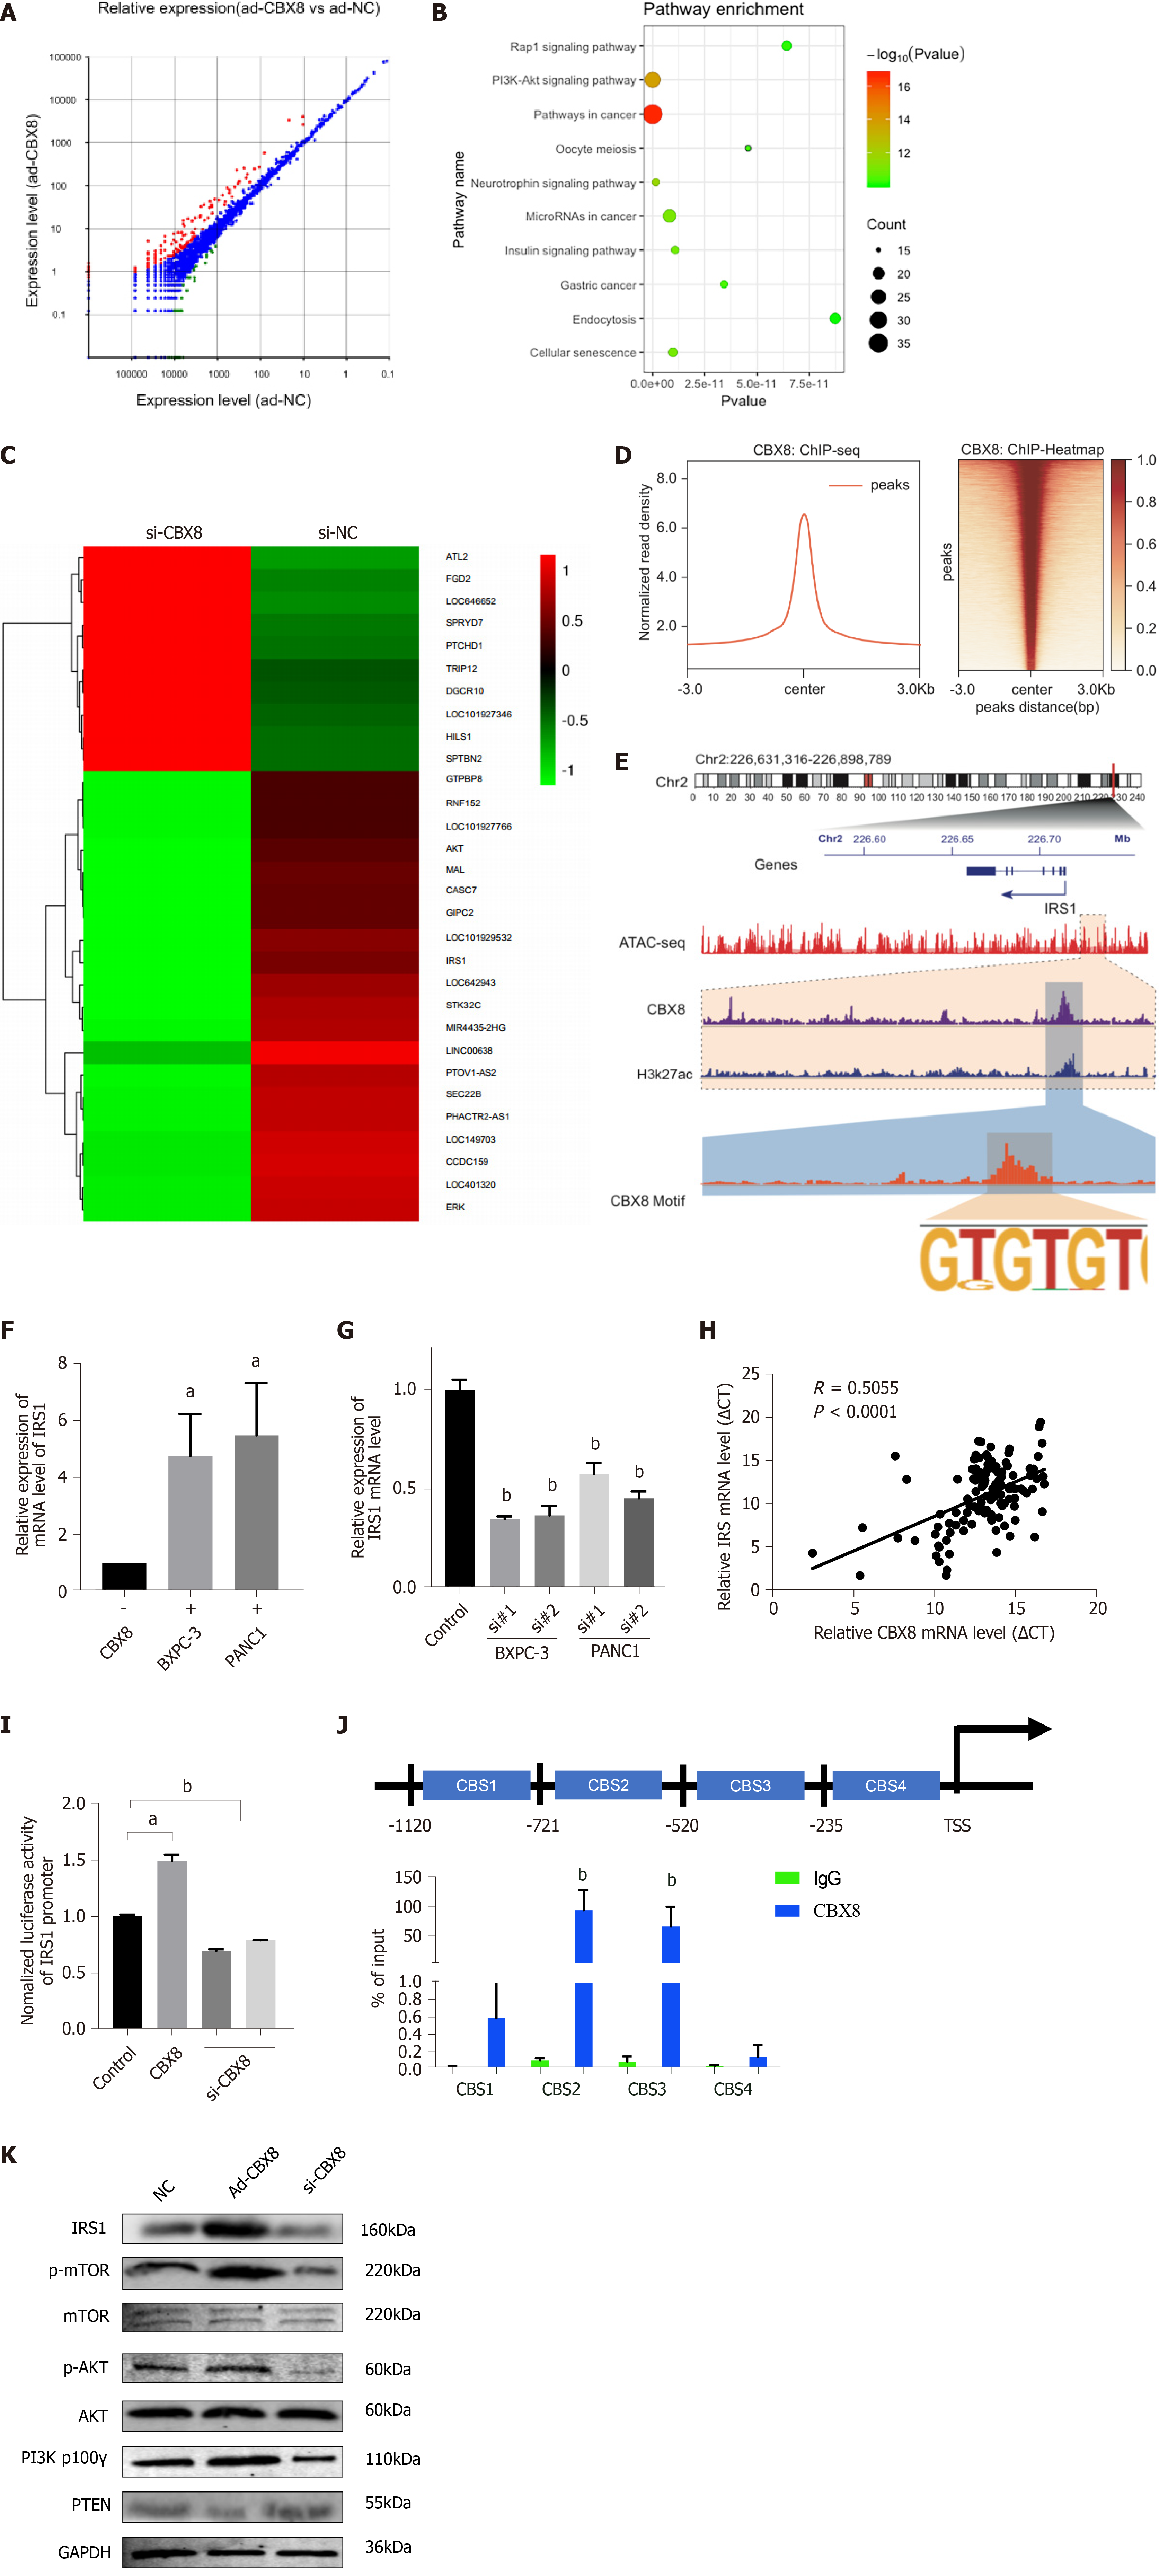
Figure 5 CBX8 promotes pancreatic cancer cell proliferation by targeting IRS1/PI3K pathway.
A: Differently expressed genes (DEGs) after CBX8 knockdown; B: KEGG pathway analysis of DEGs; C: Heatmap indicating the top 30 DEGs; D: Chromatin immunoprecipitation (ChIP)-Seq summary plot of CBX8-binding intensities across CBX8 peaks in BXPC-3 cells; E: Multiple tracks in the IGV diagram exhibited the co-occupancy of CBX8 and H3K27ac in the IRS1 enhancer region; F: Expression level of IRS1 mRNA was evaluated and normalized to the control group; G: Expression level of IRS1 mRNA was evaluated and normalized to untransduced controls; H: Expression of CBX8 and IRS1 exhibited a positive correlation in PC tissues; I: Luciferase reporter assay was performed to confirm the binding of CBX8 to the promoter region of IRS1 in 293T cells; J: ChIP-qPCR analysis was used to determine the binding affinity of CBX8 to IRS1 promoter regions; K: Expression of PTEN and PI3Kγ and the phosphorylation levels of IRS1, AKT, and mTOR in PC cells were assessed by Western blot. aP < 0.05, bP < 0.01.
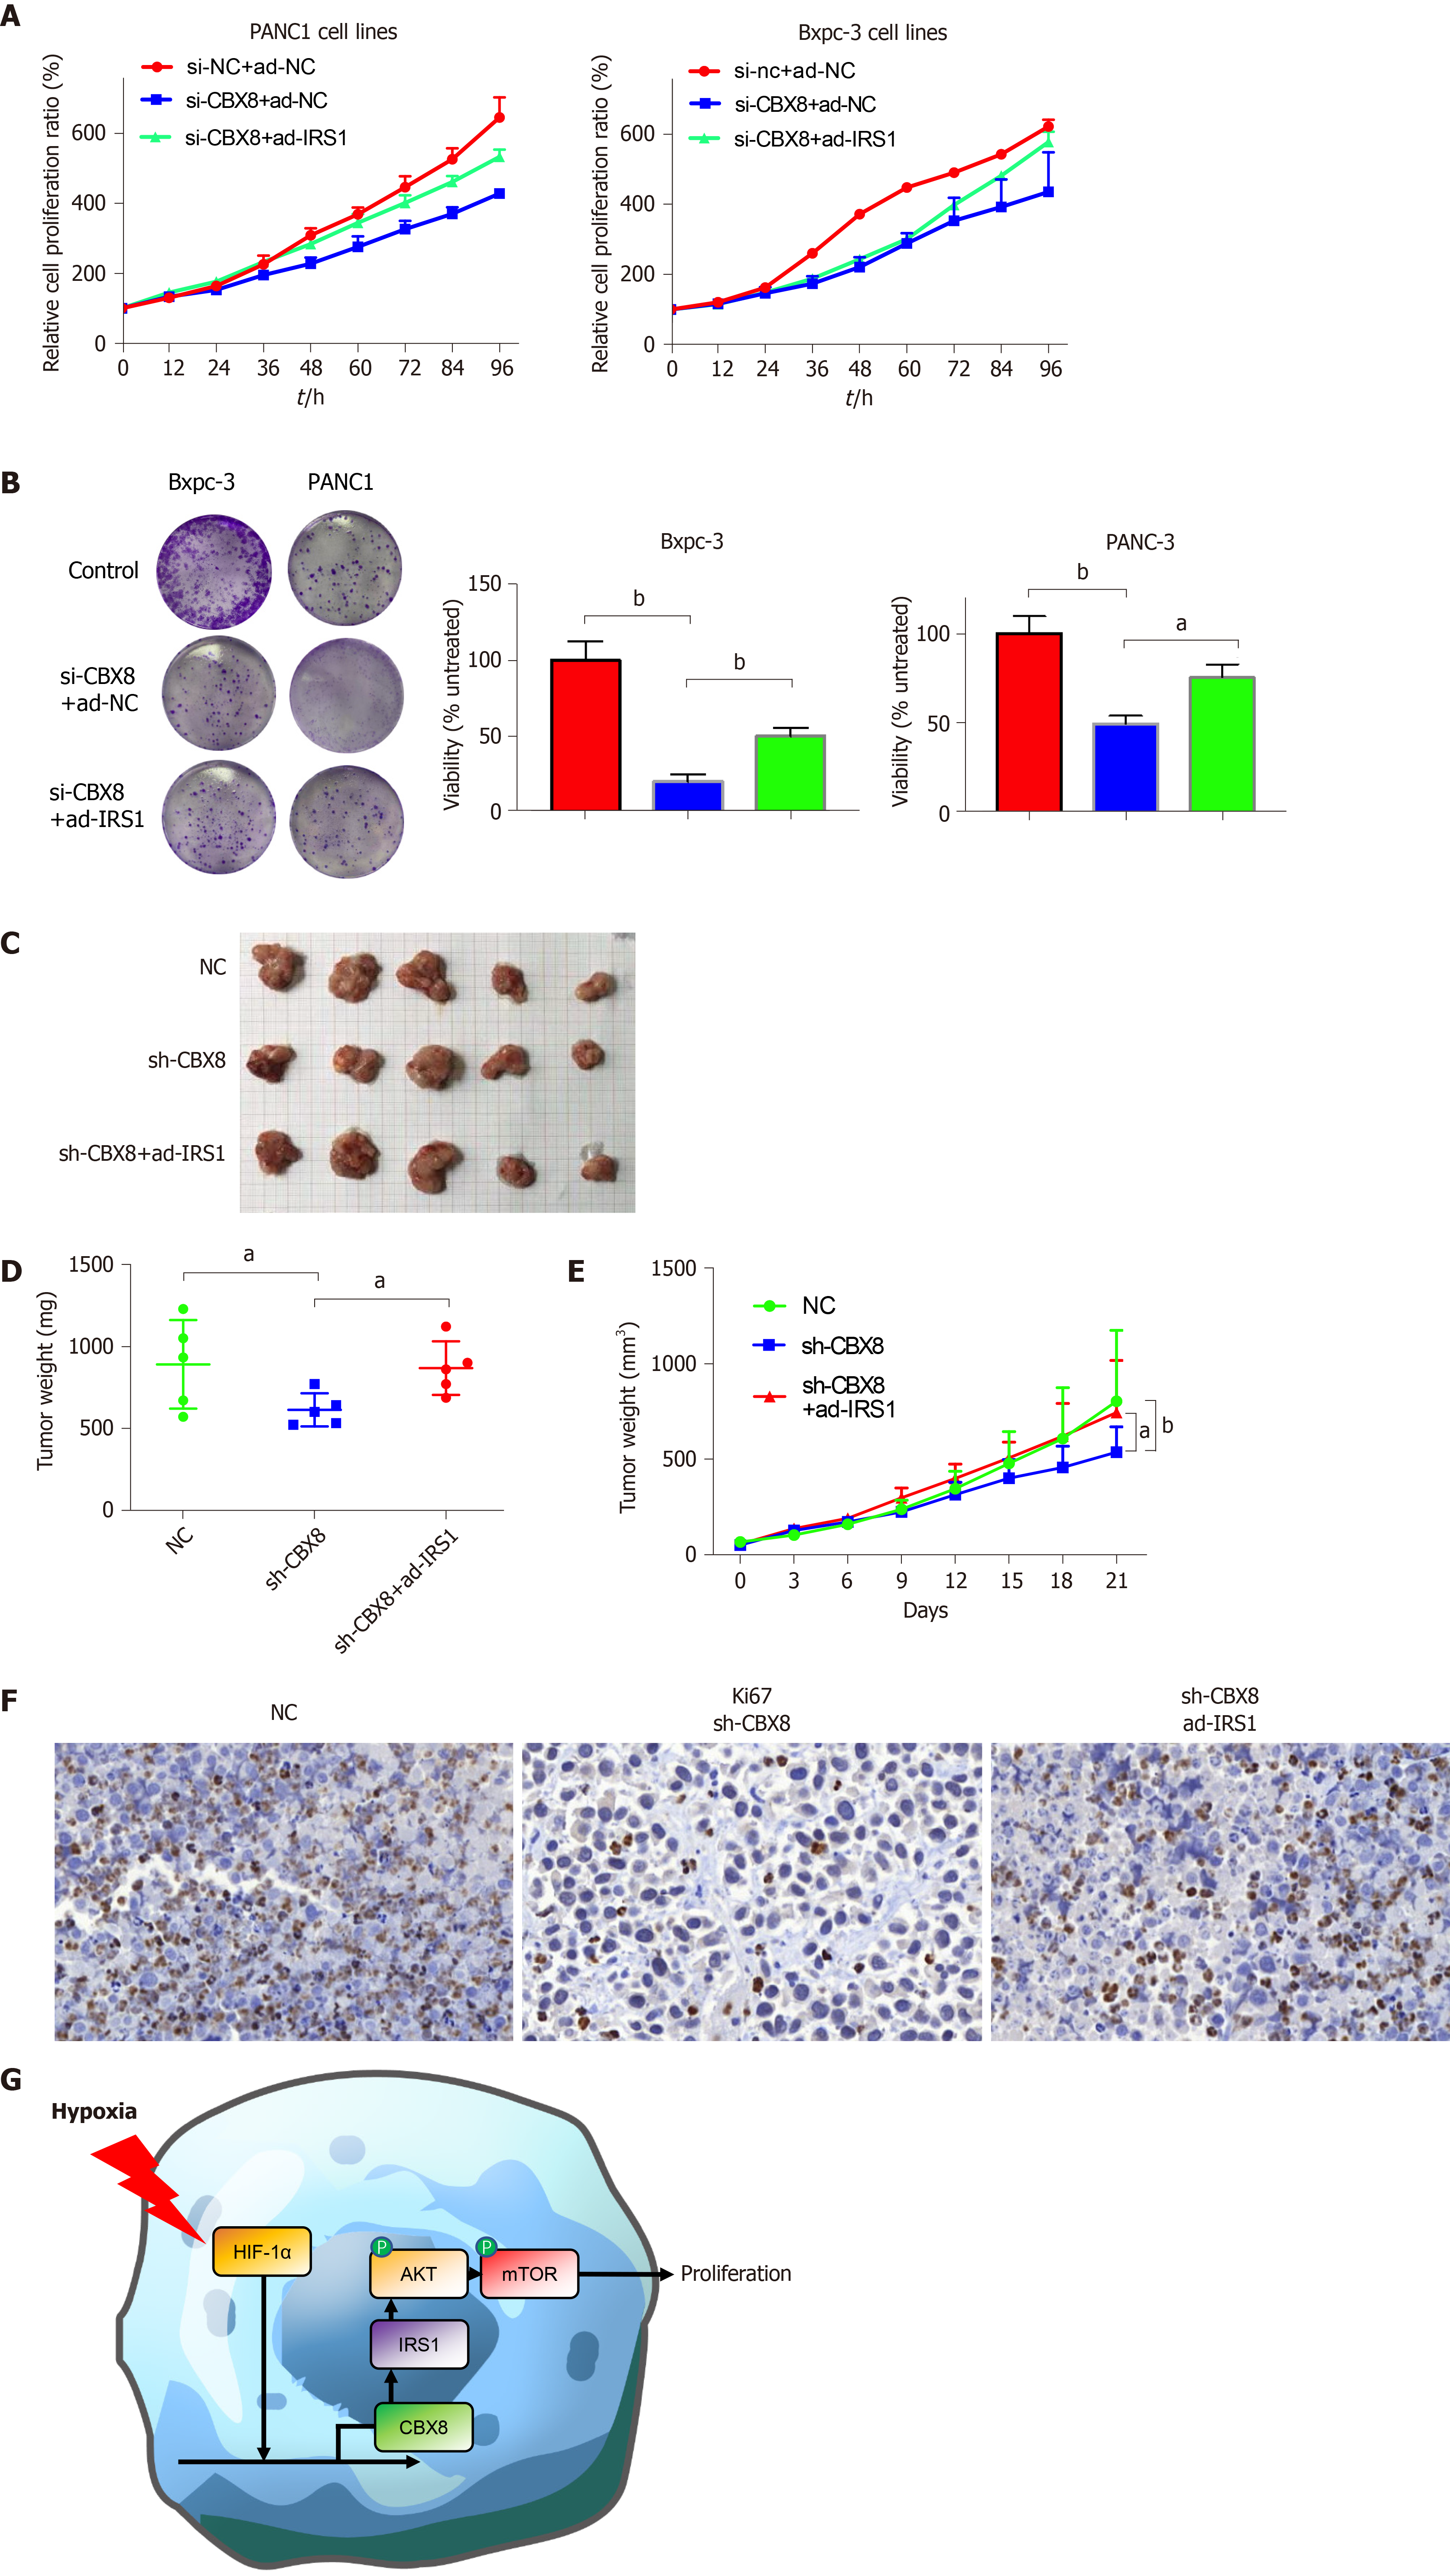
Figure 6 CBX8 promotes the growth and proliferation of pancreatic cancer cells through IRS1 in vivo.
A: Viability of BXPC-3 and PANC1 cells after transfection with CBX8 knockdown and/or IRS1 plasmid; B: Colony formation assay was performed to evaluate the effect of CBX8 on PC cell proliferation; C: Images of tumors harvested from each group; D: Weight of tumors in each group; E: Tumor growth curve drawn based on the tumor size measured each week; F: Representative images of immunohistochemistry staining for Ki67 in xenograft tumors; G: Schematic model illustrating that HIF-1a-meditated CBX8 transcription promotes pancreatic cancer progression via IRS1/AKT axis. aP < 0.05, bP < 0.01.
- Citation: Teng BW, Zhang KD, Yang YH, Guo ZY, Chen WW, Qiu ZJ. Genome-wide CRISPR-Cas9 screening identifies that hypoxia-inducible factor-1a-induced CBX8 transcription promotes pancreatic cancer progression via IRS1/AKT axis. World J Gastrointest Oncol 2021; 13(11): 1709-1724
- URL: https://www.wjgnet.com/1948-5204/full/v13/i11/1709.htm
- DOI: https://dx.doi.org/10.4251/wjgo.v13.i11.1709


