Copyright
©The Author(s) 2021.
World J Gastrointest Oncol. Oct 15, 2021; 13(10): 1492-1505
Published online Oct 15, 2021. doi: 10.4251/wjgo.v13.i10.1492
Published online Oct 15, 2021. doi: 10.4251/wjgo.v13.i10.1492
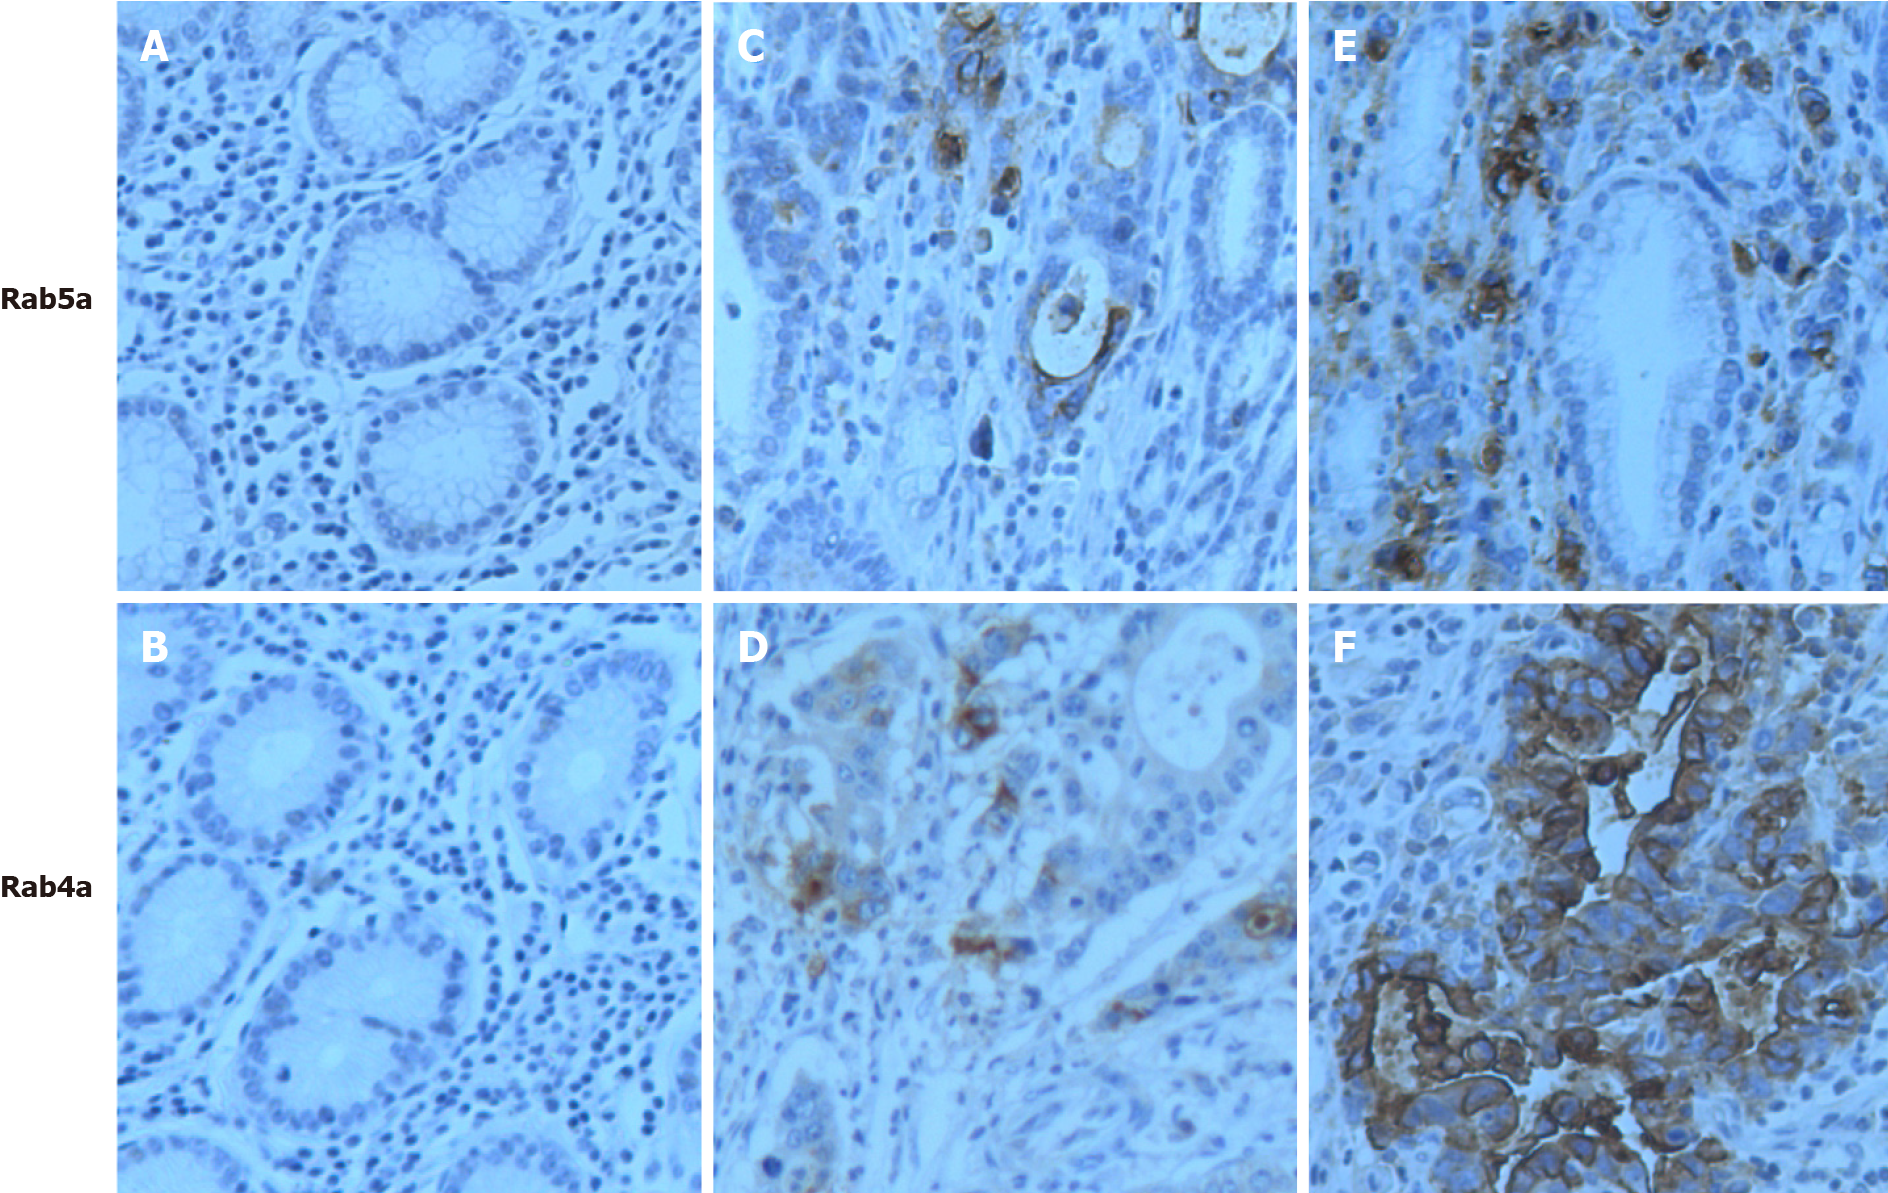
Figure 1 Microscopic images of immunohistochemical staining for Rab4a or Rab5a in gastric tissues.
A and B: Negative (–) in normal tissue sections; C and D: Weak positive (+) in paracancerous tissue sections; E: Strong positive (+++); F; Moderate positive (++) in gastric cancer tissue sections. Original magnification: 200 ×.
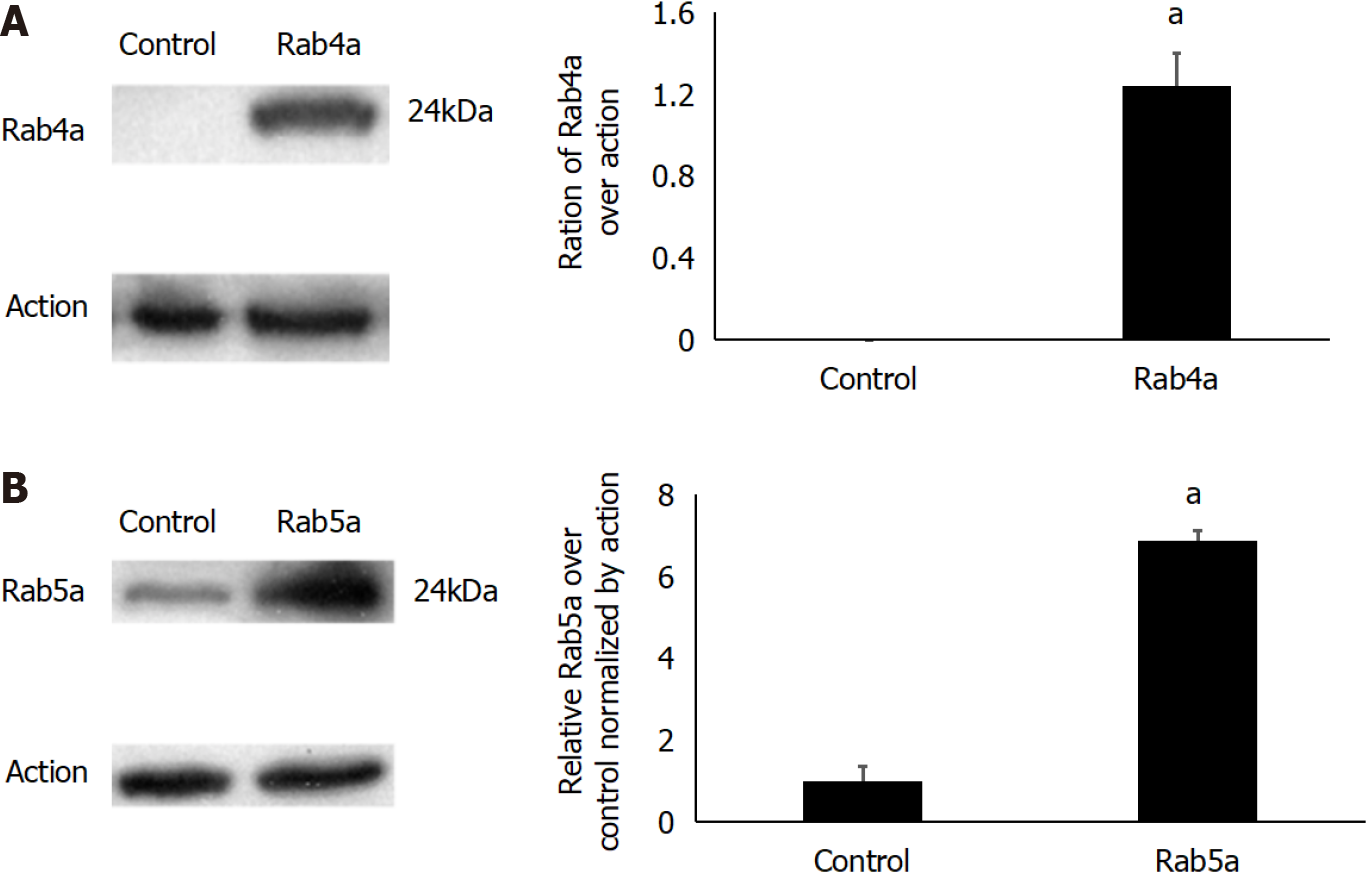
Figure 2 Expression levels of Rab5a and Rab4a in untransfected and transfected 293T cells.
A: Expression level of Rab4a in 293T cells transfected with a plasmid overexpressing wild-type Rab4a. Untransfected 293T cells served as a Control group; B: Expression level of Rab5a in 293T cells transfected with a plasmid overexpressing wild-type Rab5a. Untransfected 293T cells served as a Control group. The asterisks indicate aP < 0.05 compared with the controls.
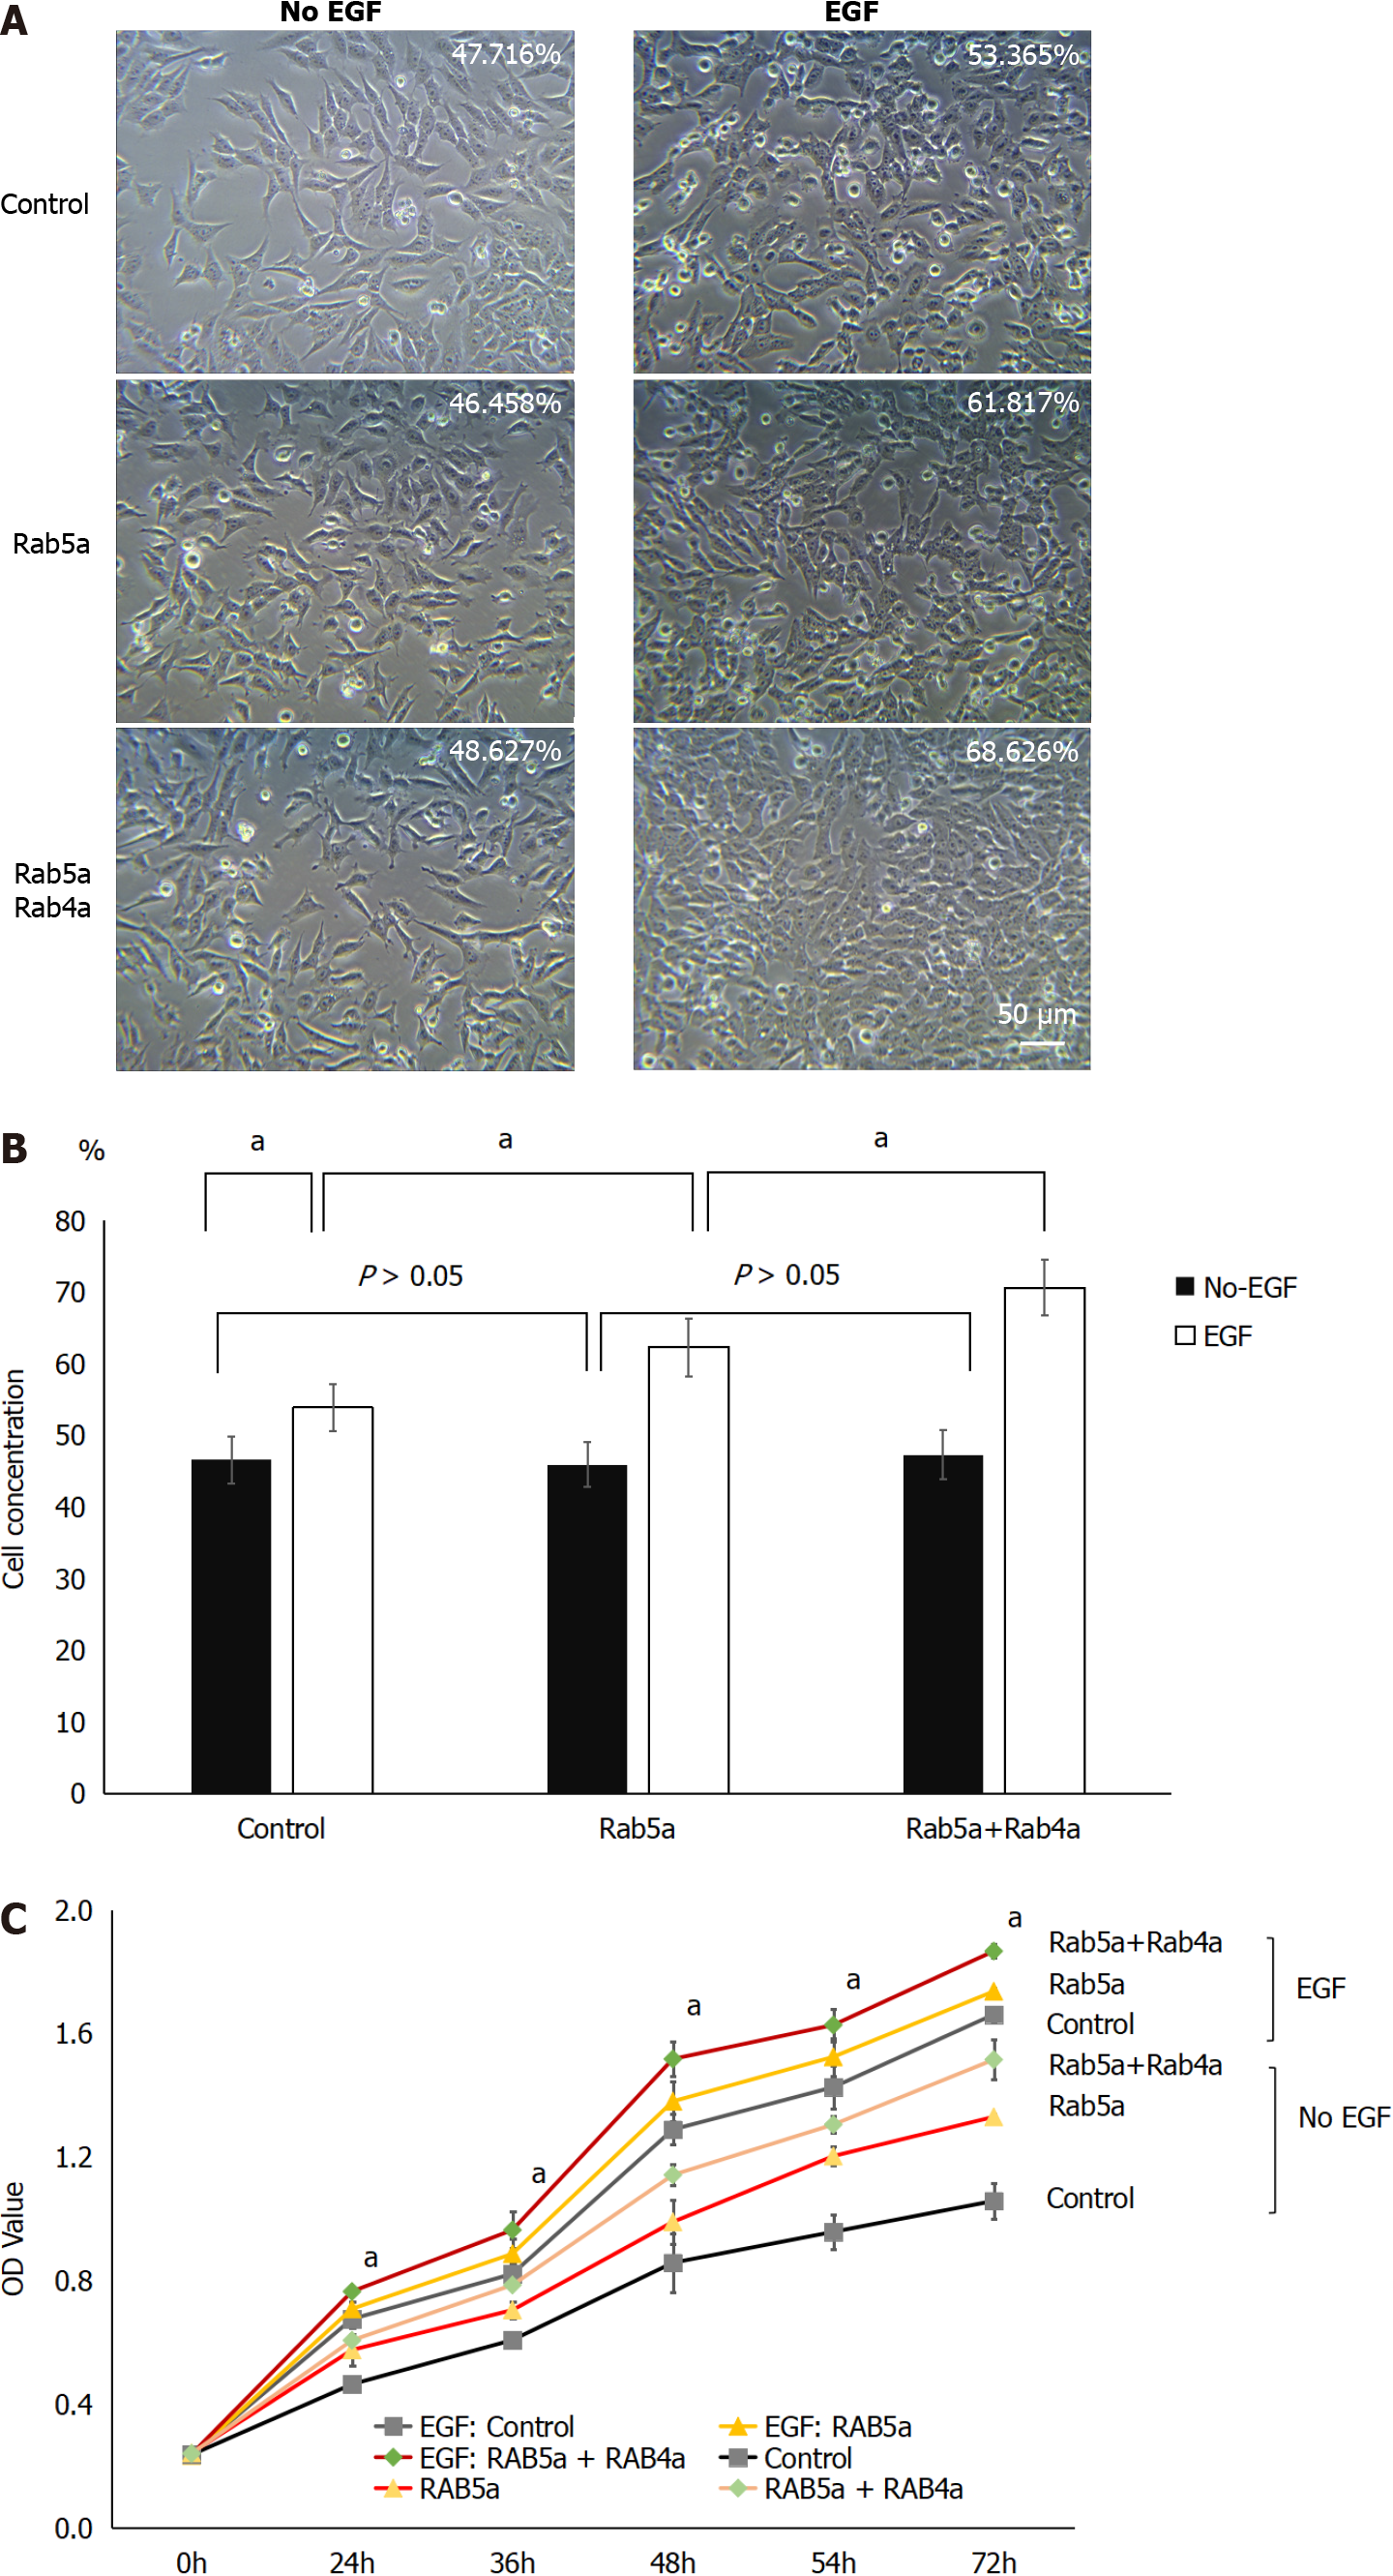
Figure 3 Overexpression of Rab5a and Rab4a promotes epidermal growth factor-induced proliferation of HGC-27 cells.
Three groups of Control, Rab5a overexpression, and Rab5a + Rab4a overexpression were compared. Each group was analyzed with epidermal growth factor (EGF) or without (No-EGF) the presence of EGF treatment. A: A representative image of unstained cells (200 × magnification). The number in the upper right corner represents the cell concentration. Scale bar: 50 μm; B: Analysis of HGC-27 cell concentration was performed using ImageJ software based on optical densities. Cell concentrations are expressed as percentages. The bars represent mean values and the mean ± standard error calculated based on 10 representative images from each group (n = 10). The asterisks indicate aP < 0.05; C: Cell proliferation of each group was analyzed by cell counting kit-8 assay. The results showed that overexpression of Rab5a increased the proliferation of HGC-27 cells, and this effect was further enhanced by Rab4a overexpression. The asterisks indicate P < 0.05 (n = 3).
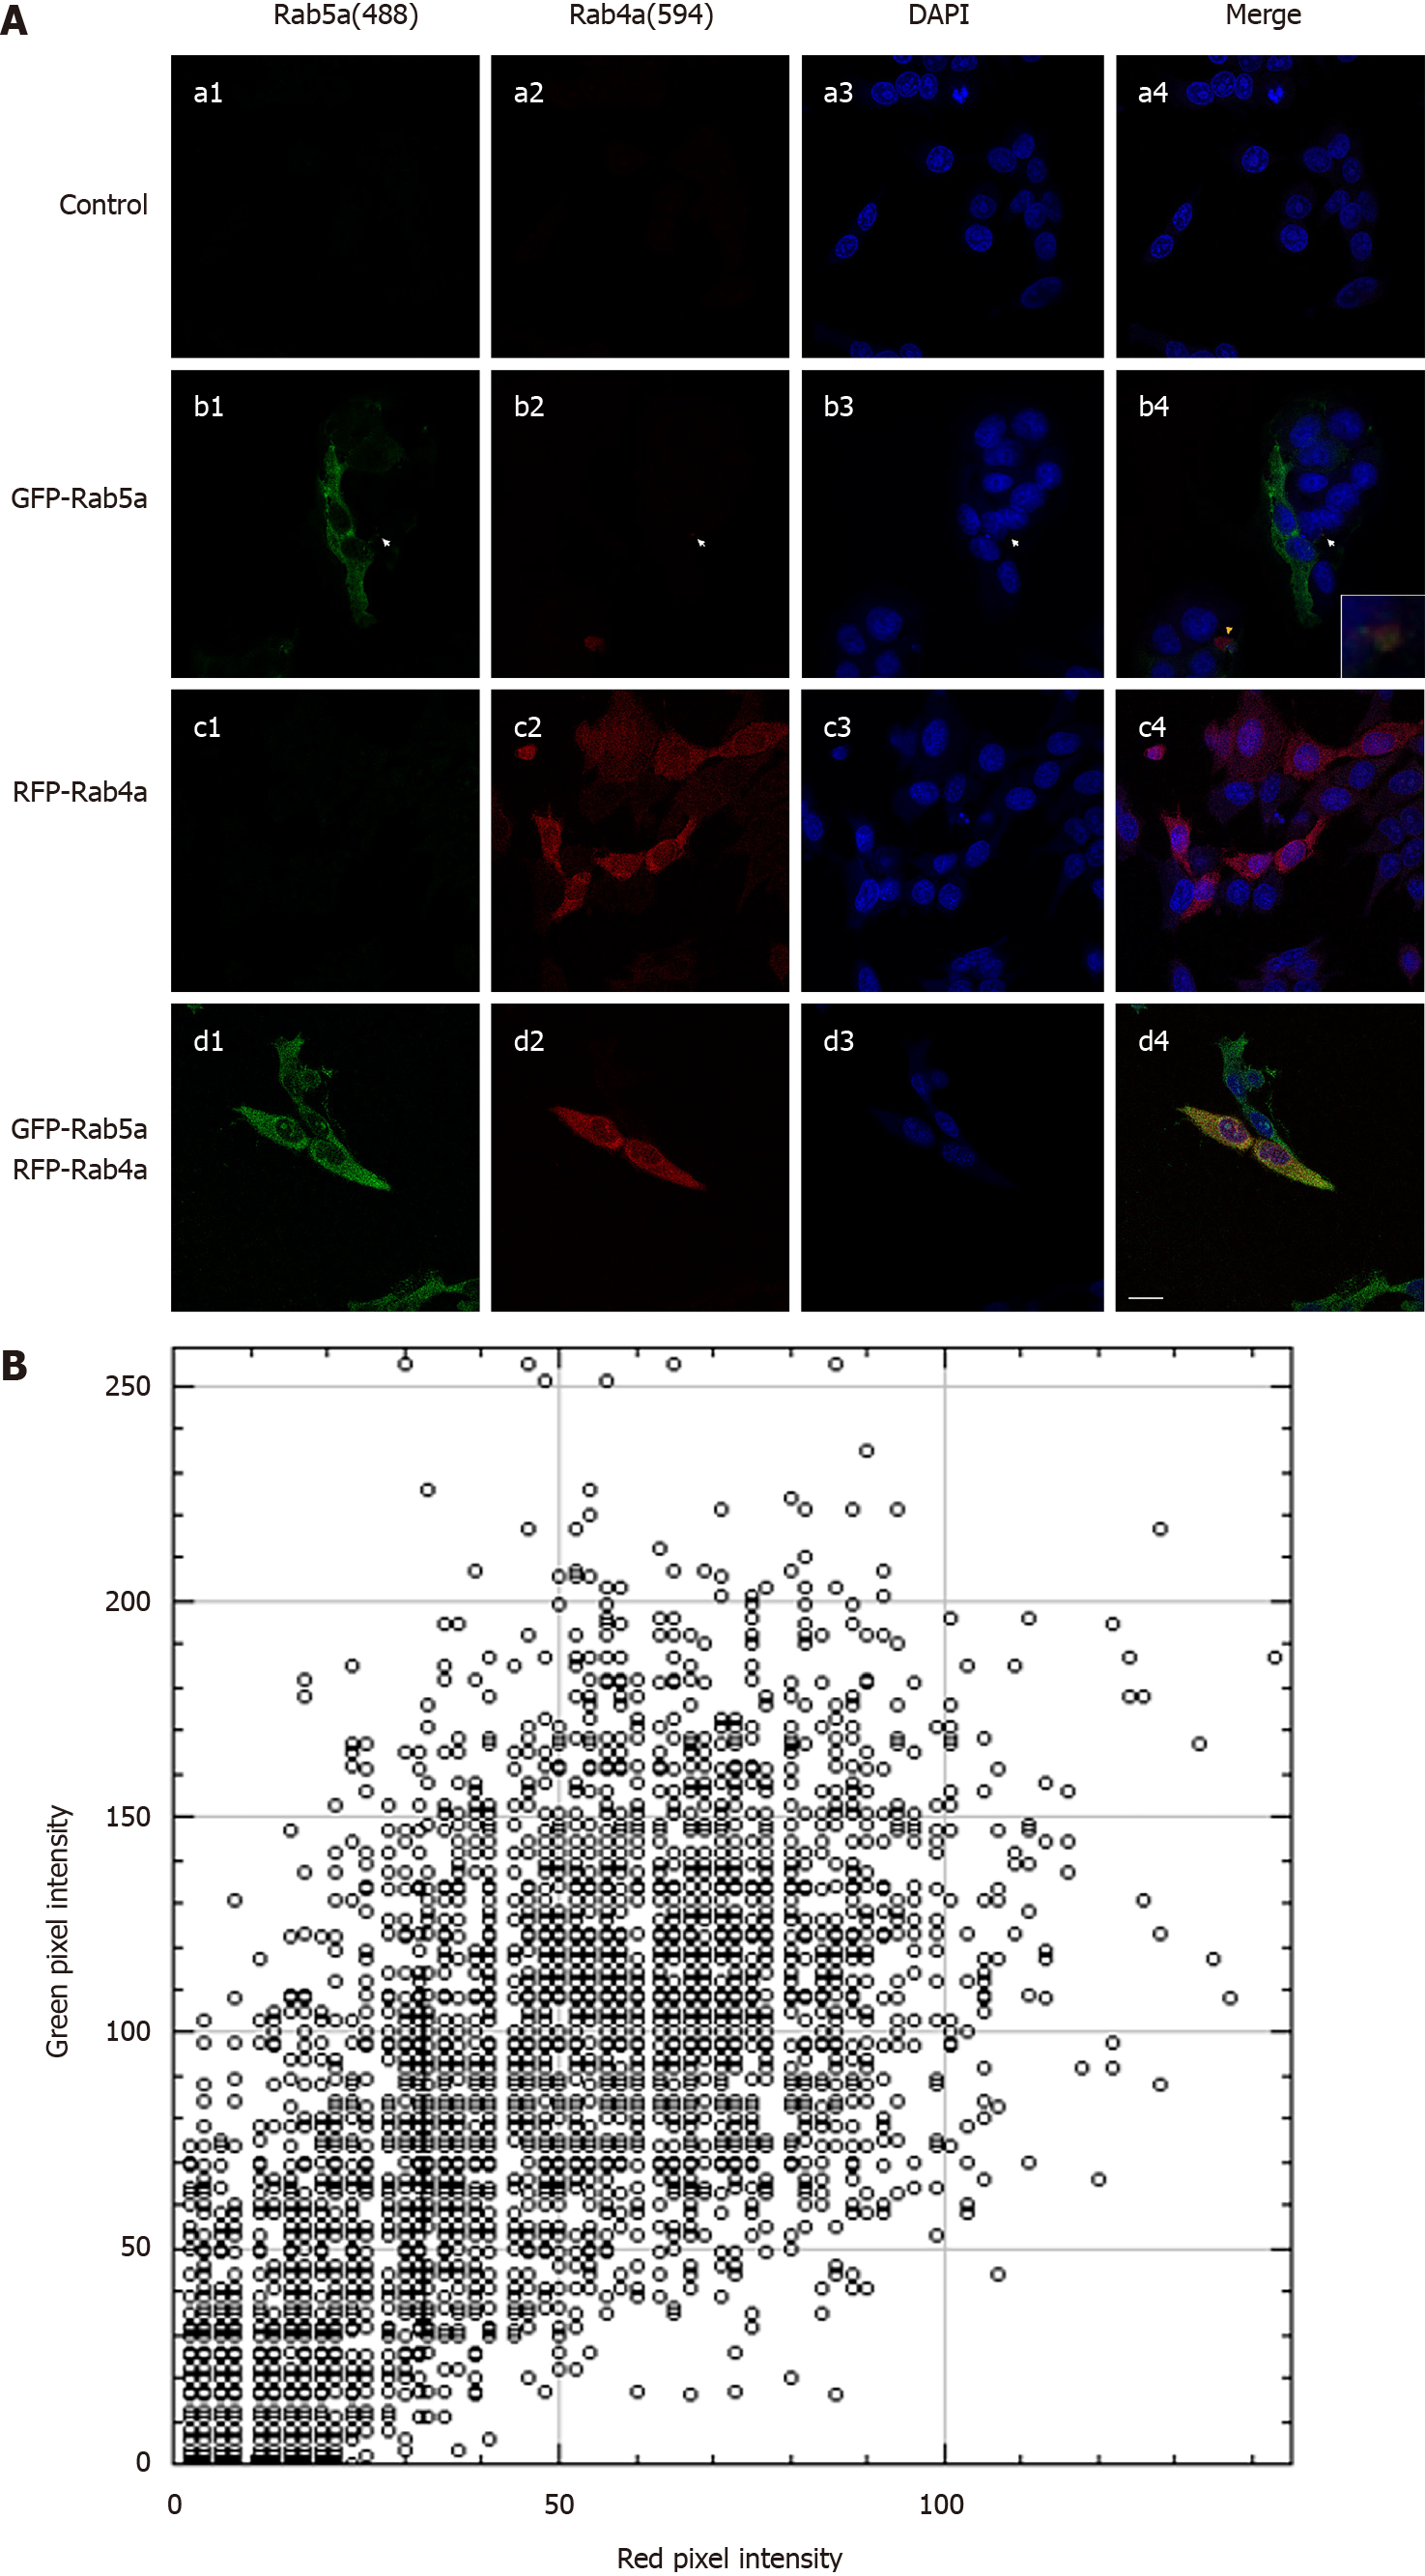
Figure 4 Confocal immunofluorescent analysis of the co-localization between Rab5a and Rab4a in endosomes of HGC-27 cells.
A: Green fluorescent protein (GFP)–Rab5a and red fluorescent protein (RFP)–Rab4a overexpressed in HGC-27 cells were visualized using immunofluorescent confocal microscopy. Four groups of HGC-27 cells are shown, namely the Control group (a1-a4), the Rab5a overexpression group (b1-b4), the Rab4a overexpression group (c1-c4), and the Rab5a + Rab4a overexpression group (d1-d4). Scale bar = 20 μm; B: The colocalization between Rab5a and Rab4a was evaluated by EzColocalization plugin of ImageJ. Scatterplot of GFP–Rab5a and RFP–Rab4a is shown for cells in the Rab5a + Rab4a overexpression group (d4).
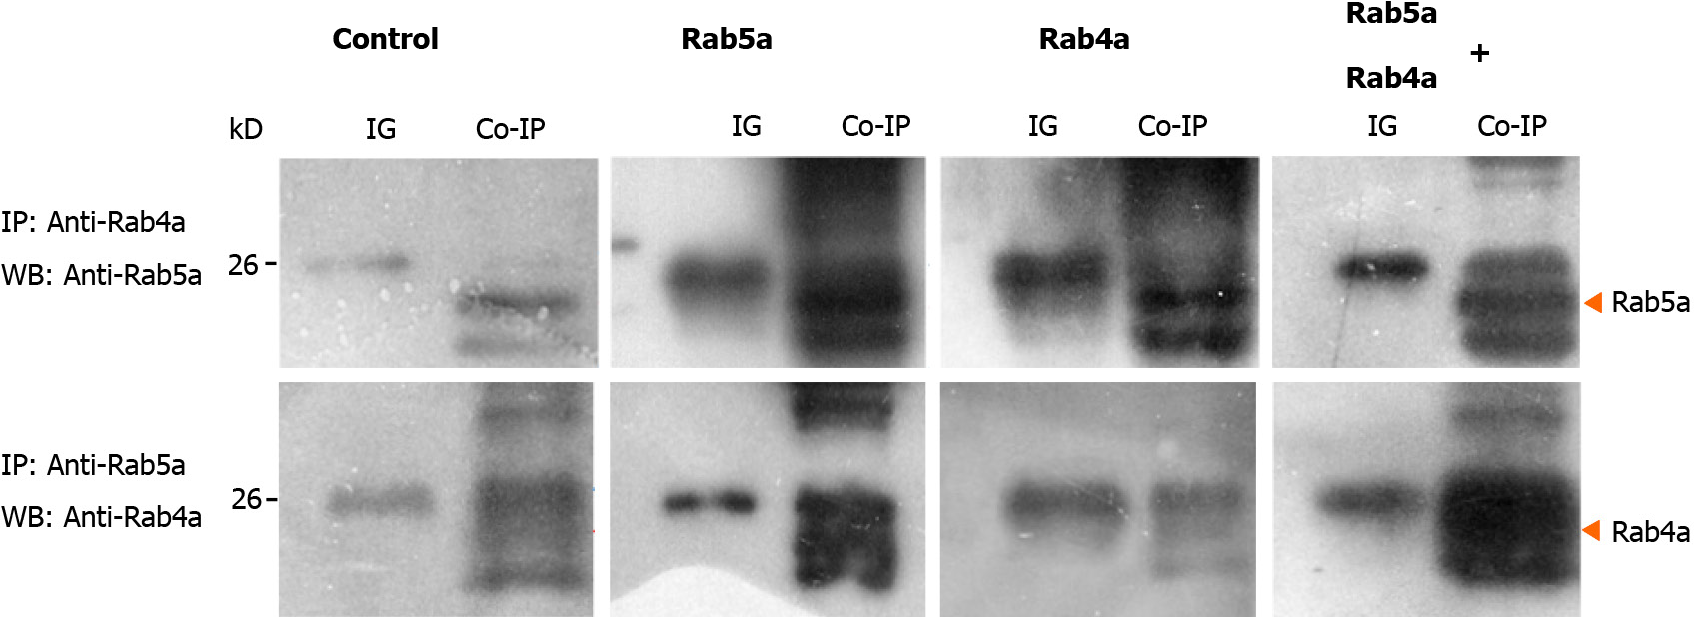
Figure 5 Rab5a could directly interact with Rab4a to regulate its protein level in HGC-27 cells.
Lysates of untransfected HGC-27 cells (A and E) and HGC-27 cells transiently transfected with Rab5a (B and F), Rab4a (C and G), or Rab5a + Rab4a (D and H) were incubated with 20-40 μL of washed protein G agarose beads. Then the mixture was added with either anti-Rab4a antibody (upper row) or anti-Rab5a antibody (lower row). The immunocomplexes were resolved by sodium dodecyl sulfate polyacrylamide gel electrophoresis and were immunoblotted with either anti-Rab5a antibody (upper row) or anti-Rab4a antibody (lower row) as indicated. Results presented are representatives of at least three independent experiments.
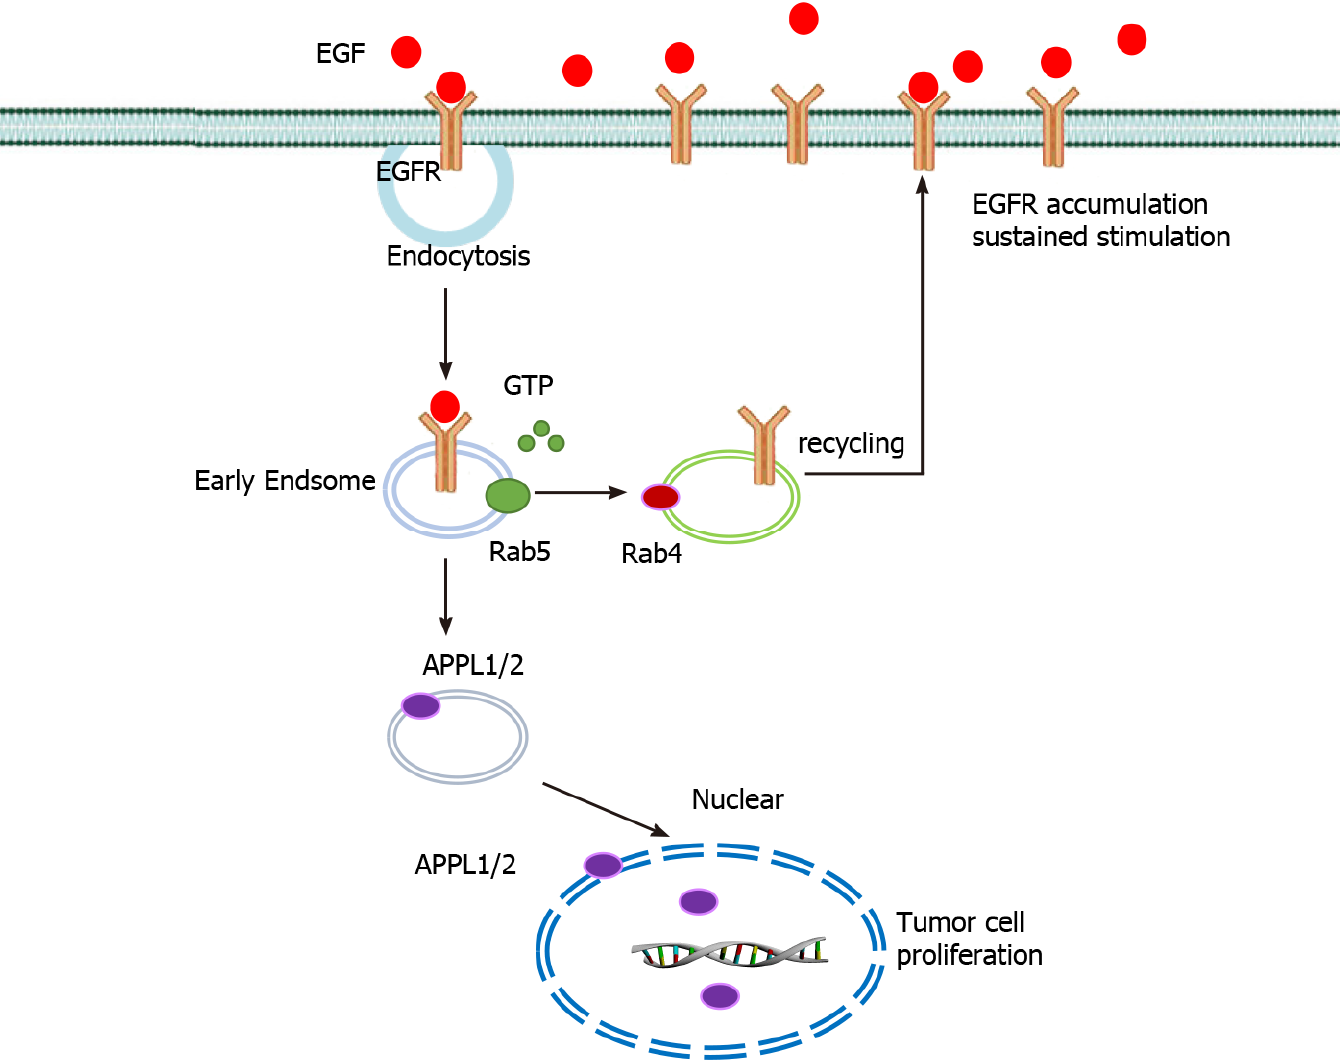
Figure 6 Proposed schematic diagram of aberrant phenotype of endocytosis in cancer cells exhibiting enhanced cell proliferation and increased invasiveness.
EGF; Epidermal growth factor; EGFR: Epidermal growth factor receptor; APPL1/2: Leucine zipper motif 1/2.
- Citation: Cao GJ, Wang D, Zeng ZP, Wang GX, Hu CJ, Xing ZF. Direct interaction between Rab5a and Rab4a enhanced epidermal growth factor-stimulated proliferation of gastric cancer cells. World J Gastrointest Oncol 2021; 13(10): 1492-1505
- URL: https://www.wjgnet.com/1948-5204/full/v13/i10/1492.htm
- DOI: https://dx.doi.org/10.4251/wjgo.v13.i10.1492


