Copyright
©The Author(s) 2020.
World J Gastrointest Oncol. Apr 15, 2020; 12(4): 503-513
Published online Apr 15, 2020. doi: 10.4251/wjgo.v12.i4.503
Published online Apr 15, 2020. doi: 10.4251/wjgo.v12.i4.503
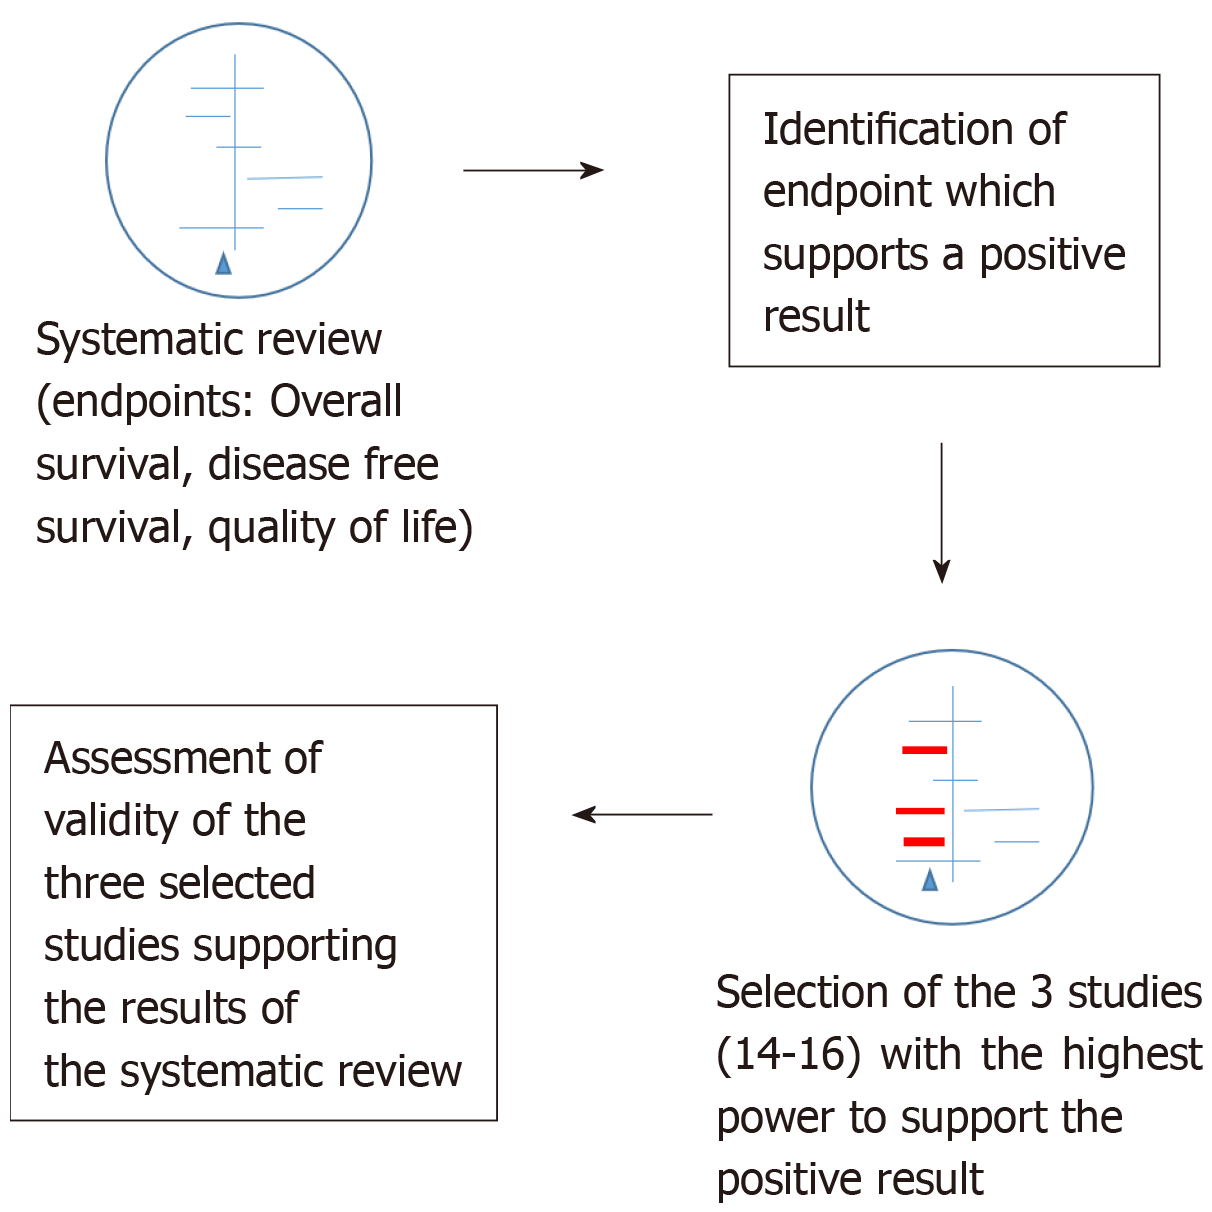
Figure 1 Four steps to the analysis of validity of a systematic review.
We identified the endpoint of interest (overall survival) and selected the three most powerful studies addressing this endpoint based on the assigned weights from the authors of the systematic review as these studies contributed essentially to the positive result of the systematic review. We finally assessed the validity of these studies by using the CONSORT checklist.
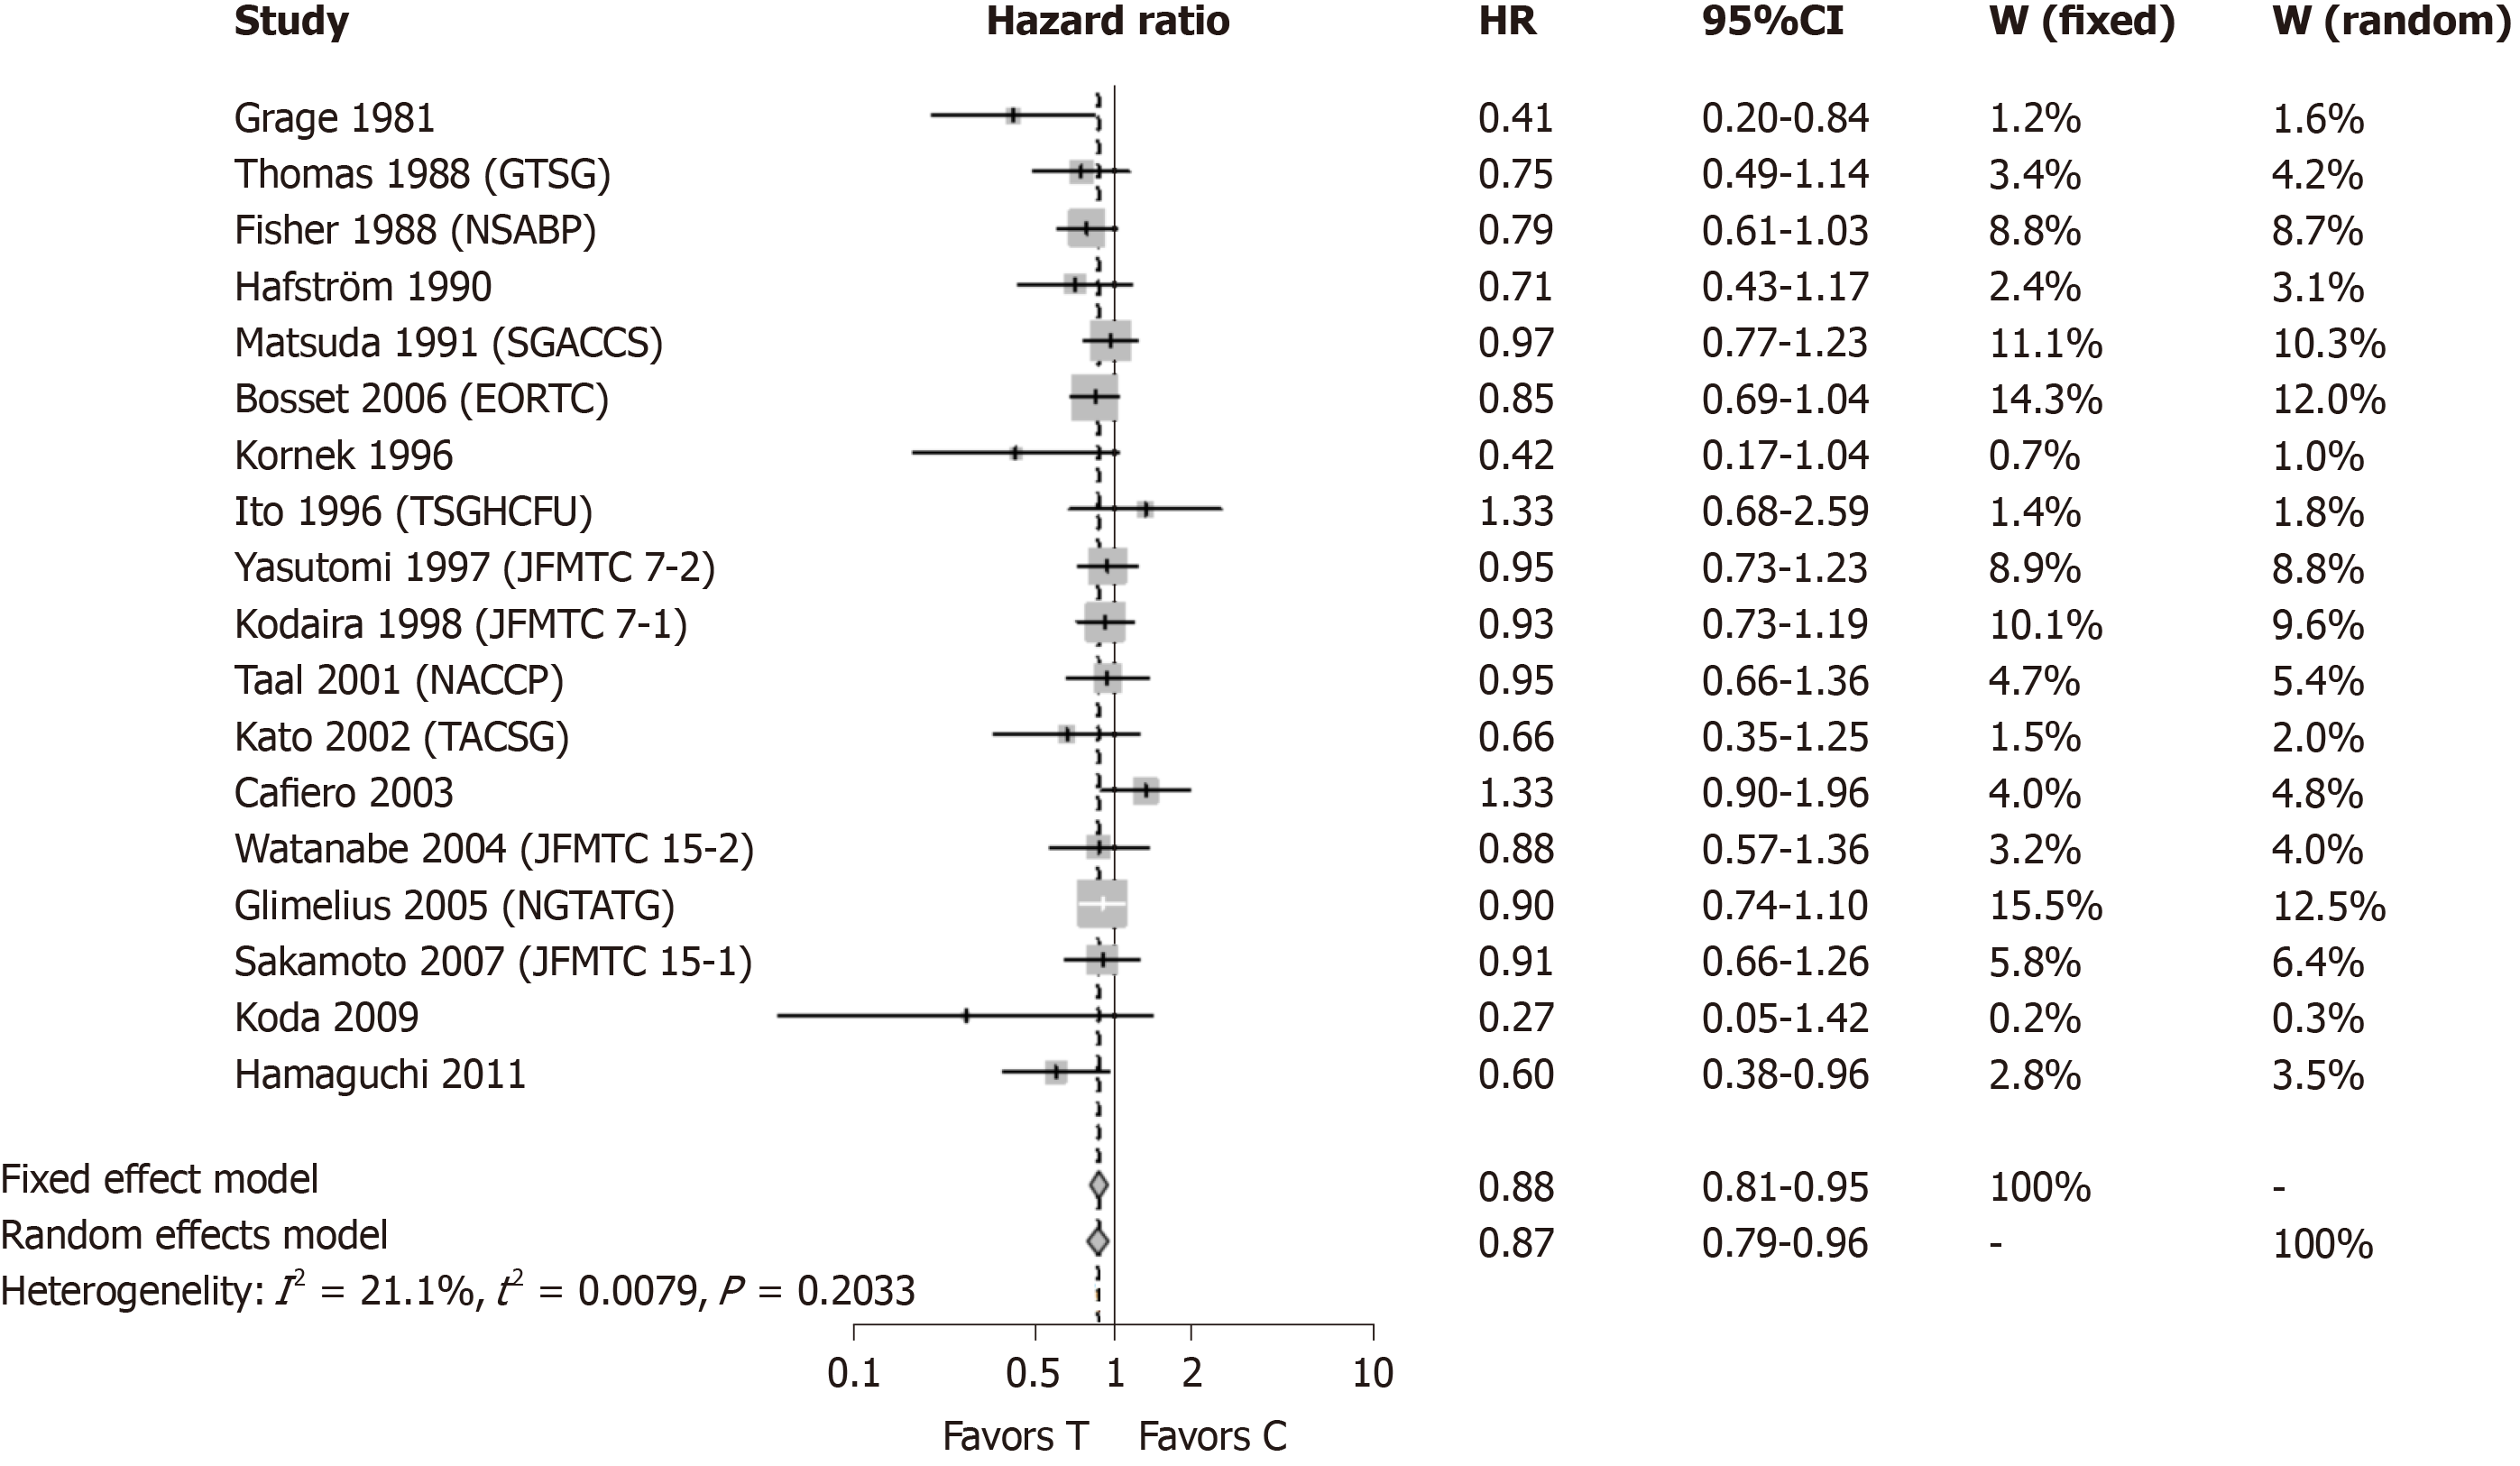
Figure 2 Meta-analysis of n = 18 studies after the exclusion of the three analyzed studies.
Each study included in the meta-analysis is represented on the forest plot by a box [put either in the region of favors (T) or favors (C) of the graphic according to the hazard ratio] and a line which indicates the 95% confidence interval. The pooled hazard ratio of the meta-analysis is represented by a diamond. In this case the estimate of overall effect is in the region which favors the treatment [favors (T)]. HR: Hazard ratio; CI: Confidence interval; W(fixed): Weight assigned to the study by using a fixed effect model; W(random): Weight assigned to the study by using a random effect model; Favors (T): Result in favor of the treatment (intervention) group (i.e., adjuvant chemotherapy after curative surgery); Favors(C): Result in favor of the control group (no adjuvant chemotherapy after surgery).
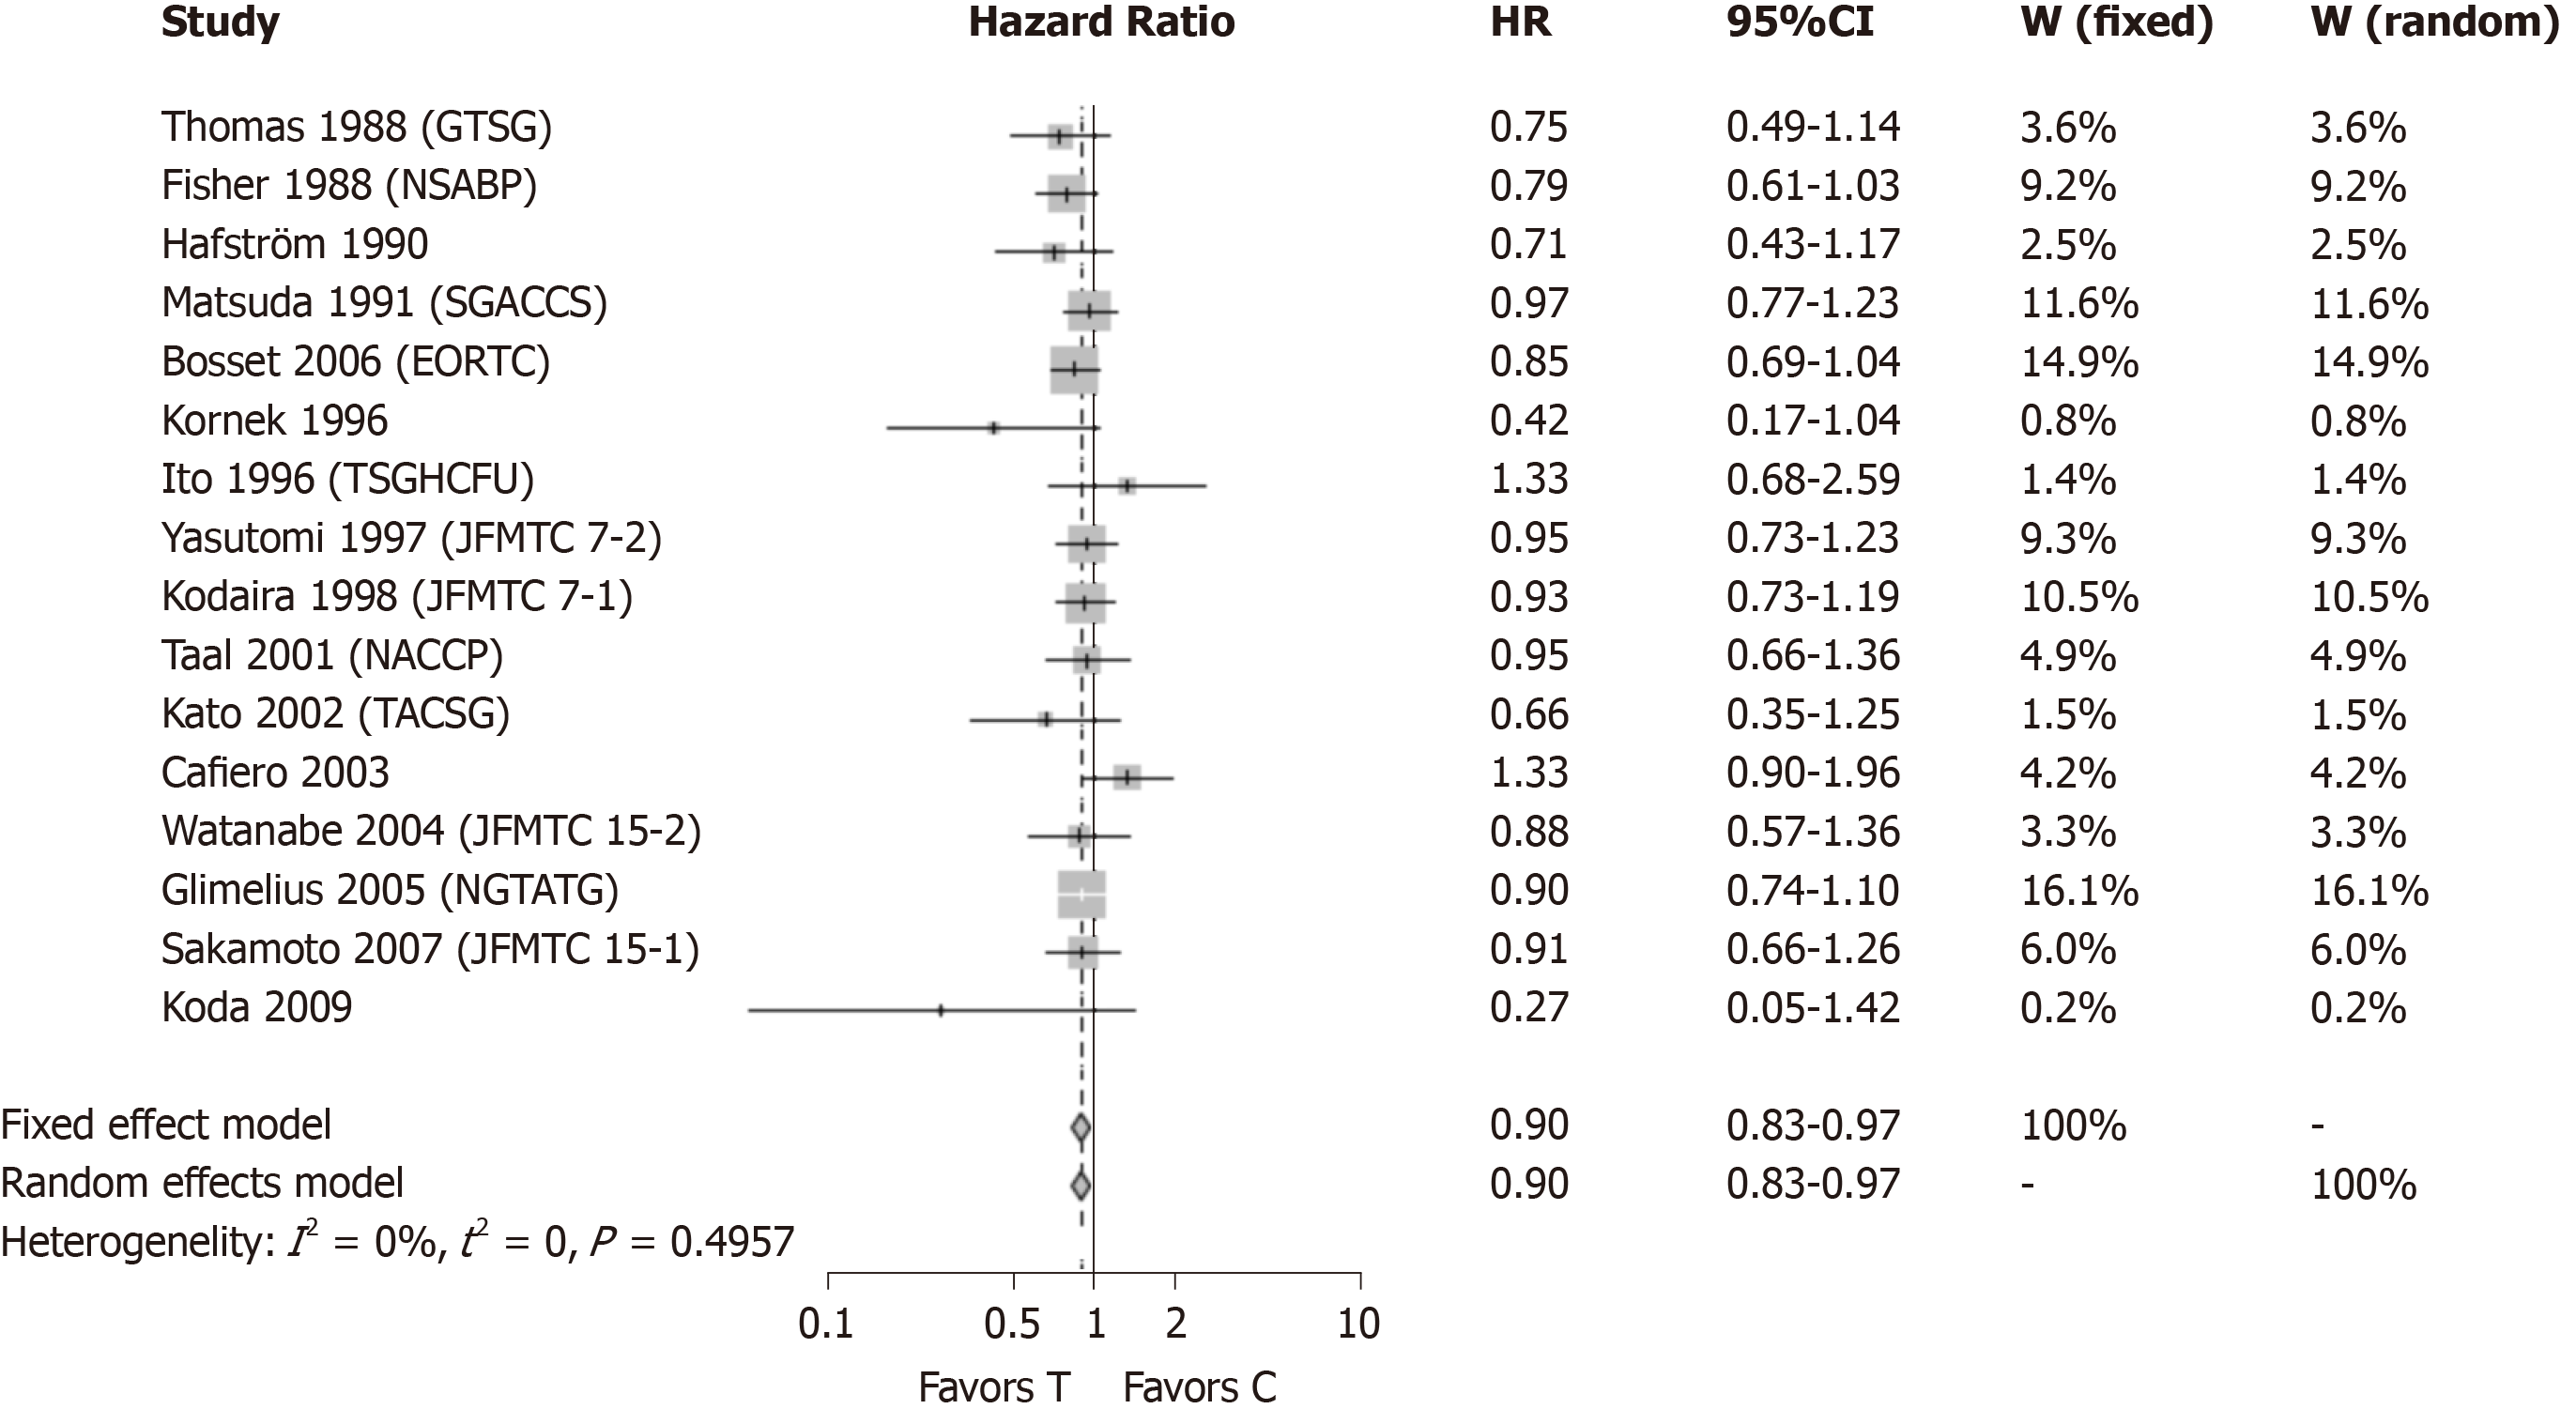
Figure 3 Meta-analysis of n = 16 studies after the exclusion of all studies which found a statistically significant survival advantage in the experimental group.
Each study included in the meta-analysis is represented on the forest plot by a box [put either in the region of favors (T) or favors (C) of the graphic according to the hazard ratio] and a line which indicates the 95% confidence interval. The pooled hazard ratio of the meta-analysis is represented by a diamond. In this case the estimate of overall effect is in the region which favors the treatment [favors (T)]. HR: Hazard ratio; CI: Confidence interval; W(fixed): Weight assigned to the study by using a fixed effect model; W(random): Weight assigned to the study by using a random effect model; Favors (T): Result in favor of the treatment (intervention) group (i.e., adjuvant chemotherapy after curative surgery); Favors(C): Result in favor of the control group (no adjuvant chemotherapy after surgery).
- Citation: Manzini G, Hapke F, Hines IN, Henne-Bruns D, Kremer M. Adjuvant chemotherapy in curatively resected rectal cancer: How valid are the data? World J Gastrointest Oncol 2020; 12(4): 503-513
- URL: https://www.wjgnet.com/1948-5204/full/v12/i4/503.htm
- DOI: https://dx.doi.org/10.4251/wjgo.v12.i4.503


