Copyright
©The Author(s) 2020.
World J Gastrointest Oncol. Apr 15, 2020; 12(4): 447-456
Published online Apr 15, 2020. doi: 10.4251/wjgo.v12.i4.447
Published online Apr 15, 2020. doi: 10.4251/wjgo.v12.i4.447
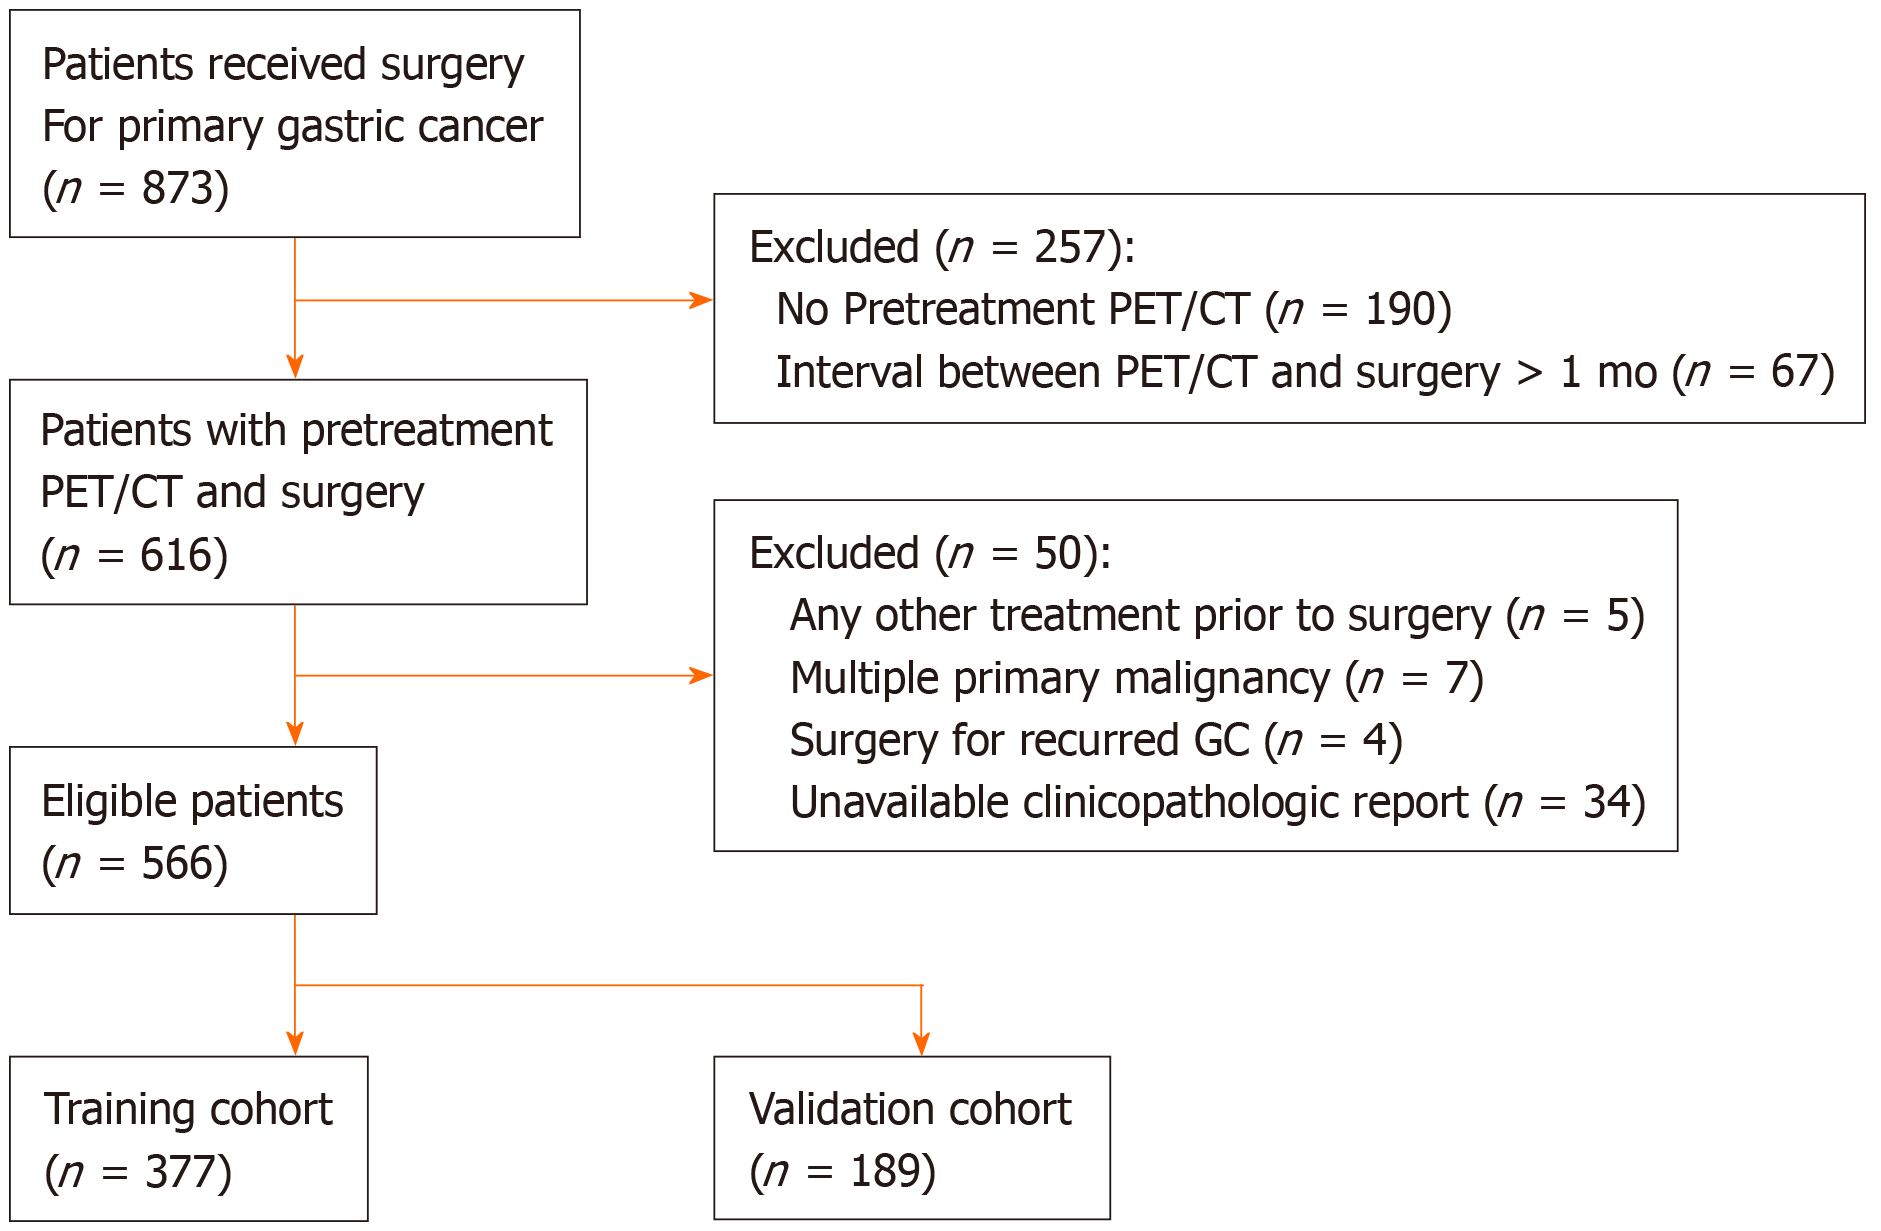
Figure 1 Flow diagram of patient selection.
PET/CT: Positron emission tomography/computed tomography; GC: Gastric cancer.
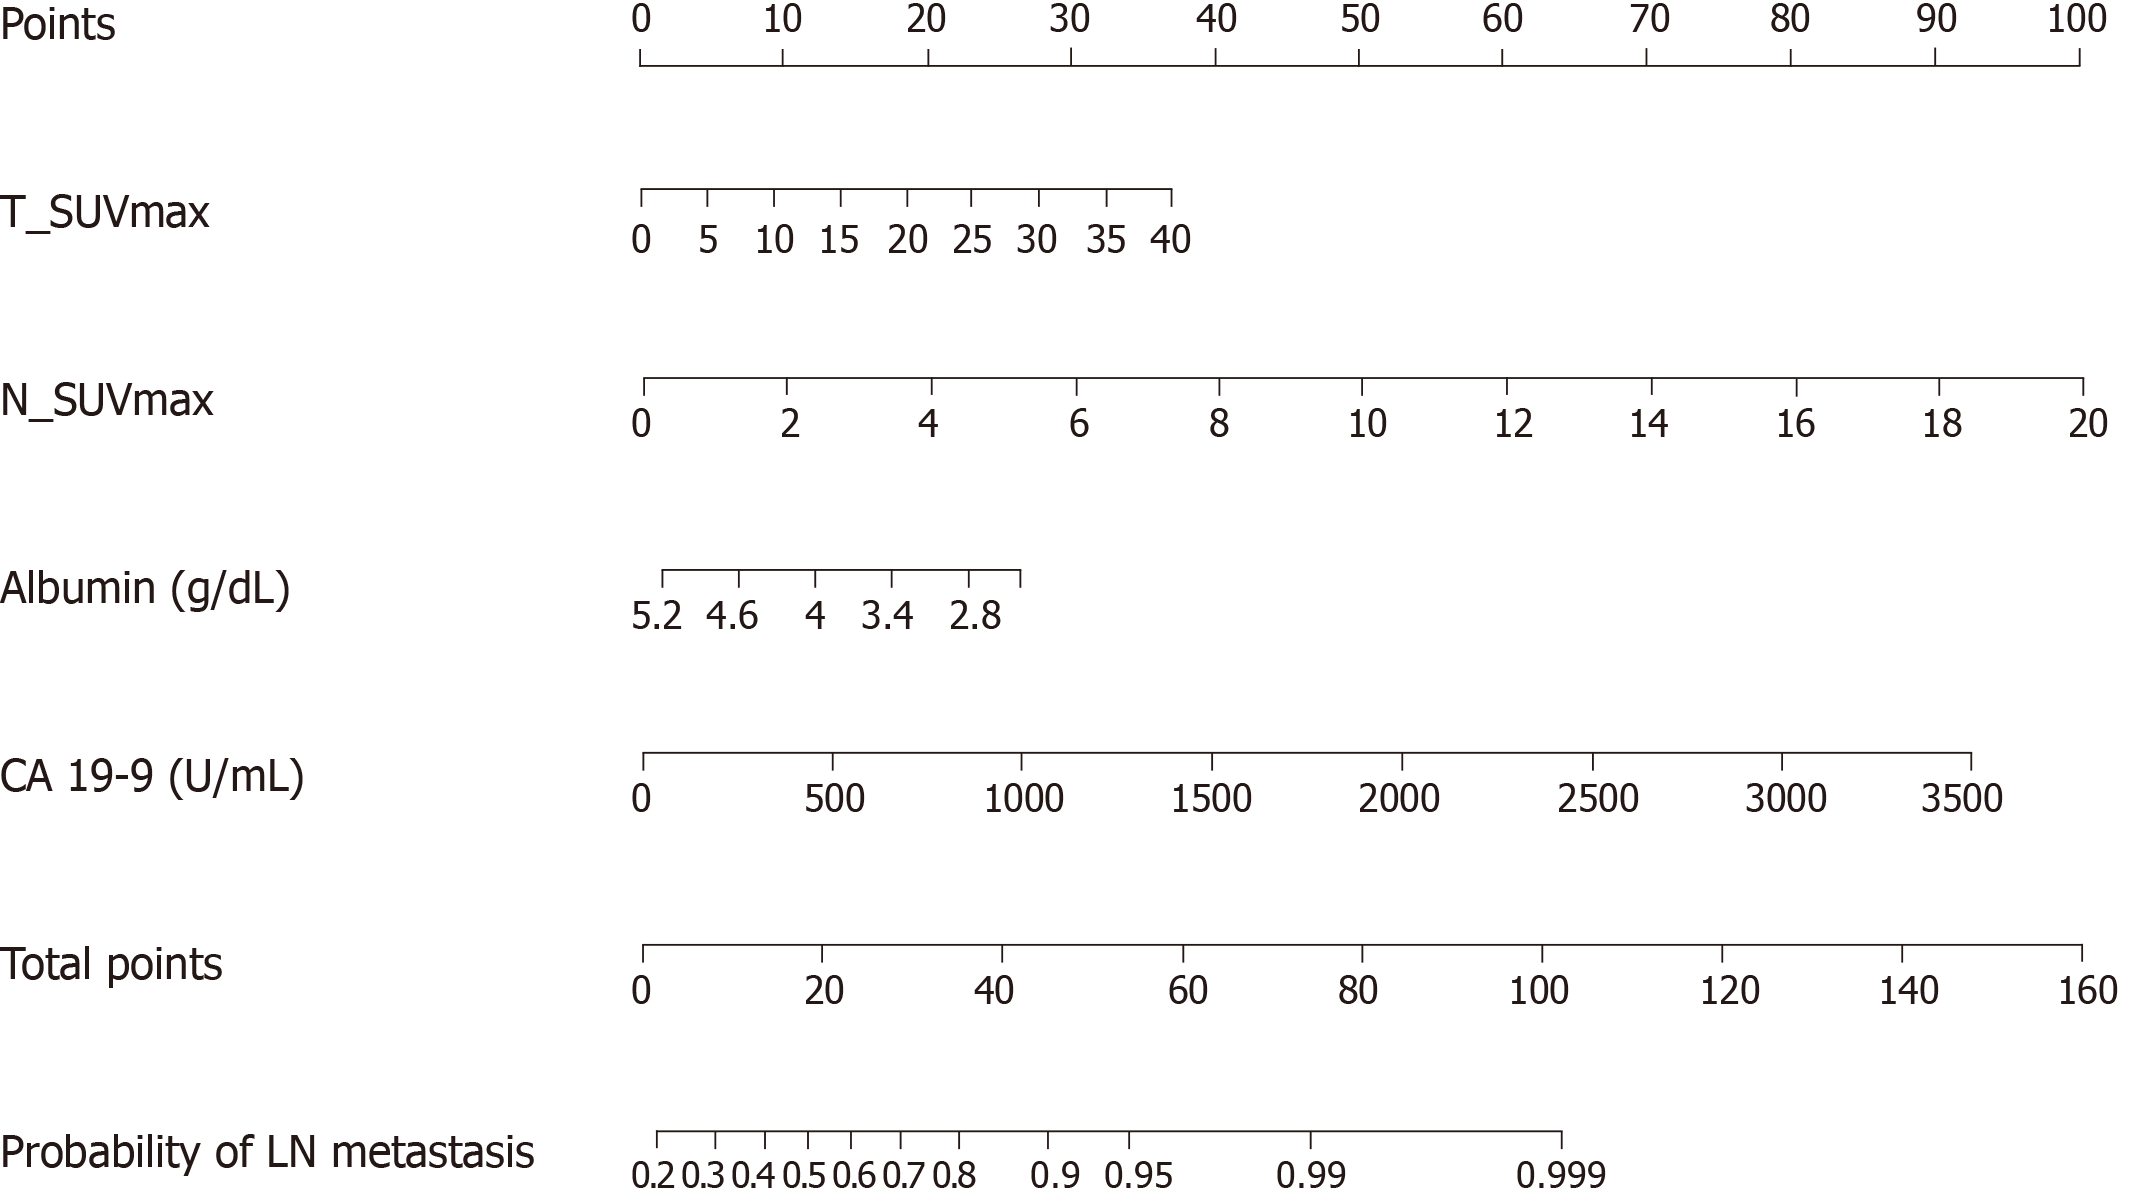
Figure 2 Nomogram for predicting the risk of lymph node metastasis using preoperative F-18 Fluorodeoxyglucose positron emission tomography/computed tomography and laboratory parameters.
First, the number of points for each parameter –maximum standardized uptake value of primary tumor, maximum standardized uptake value of lymph node, albumin, and CA 19-9 – should be determined by drawing a vertical line from the exact value of variables to the points row. Subsequently, total points can be obtained by sum of four variables. The individual predictive risk of lymph node metastasis can be calculated by drawing a vertical line from the total points row to the probability of regional lymph node metastasis. T_SUVmax: Maximum standardized uptake value of primary tumor; N_SUVmax: Maximum standardized uptake value of lymph node; LN: Lymph node.
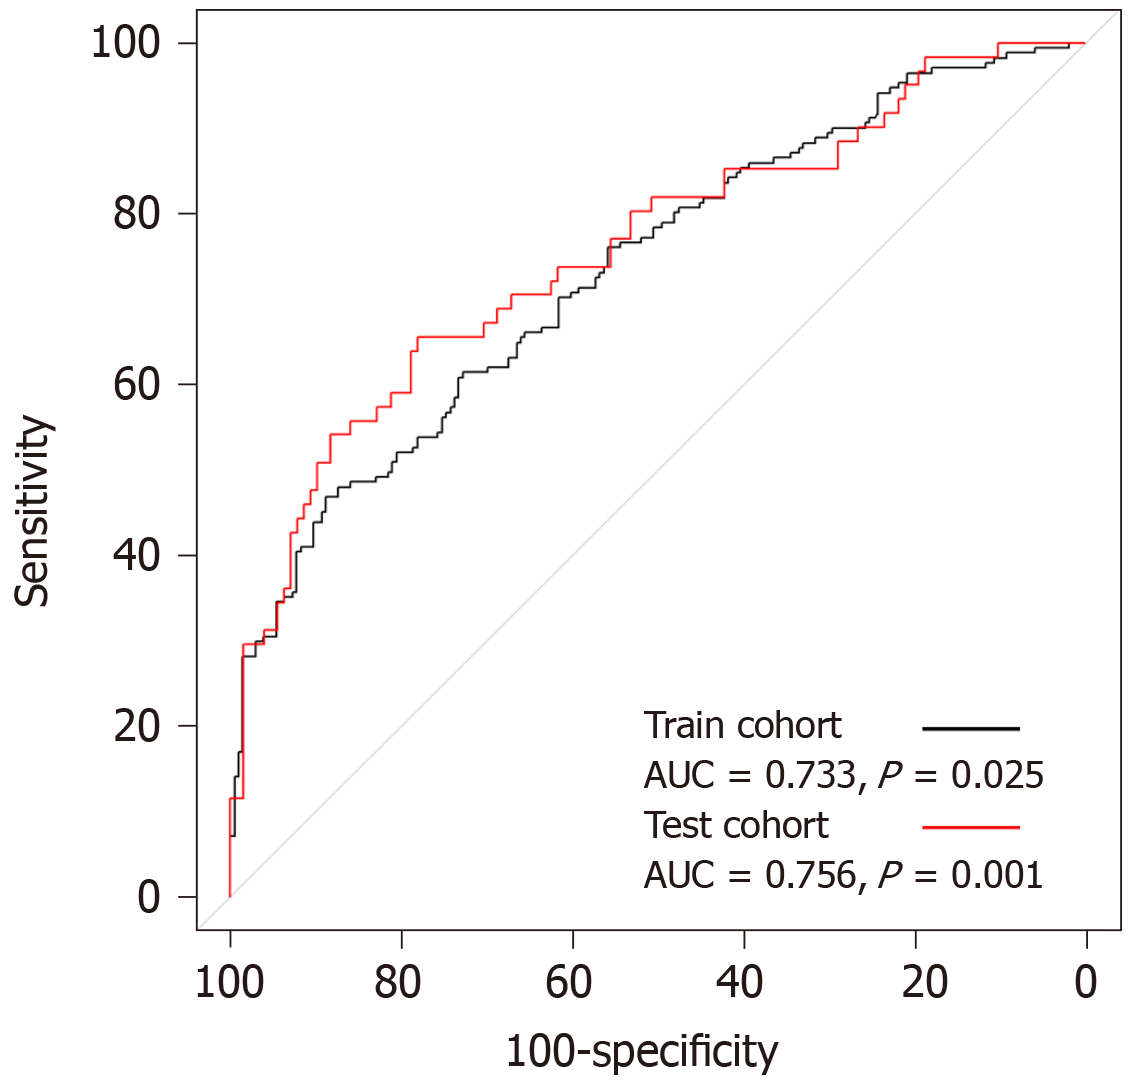
Figure 3 C-statistic of the combination model using metabolic parameters (maximum standardized uptake value of primary tumor and maximum standardized uptake value of lymph node) and laboratory findings (albumin and CA 19-9).
C-statistic using receiver operating characteristic curve analysis, the area under the curve was 0.733 (95%CI: 0.683–0.784, P = 0.025) for lymph node metastasis prediction performance in the training cohort (black line), and area under the curve was of 0.756 (95%CI: 0.678–0.833, P < 0.001) in the test cohort (red line). AUC: Area under the curve.
- Citation: Song BI. Nomogram using F-18 fluorodeoxyglucose positron emission tomography/computed tomography for preoperative prediction of lymph node metastasis in gastric cancer. World J Gastrointest Oncol 2020; 12(4): 447-456
- URL: https://www.wjgnet.com/1948-5204/full/v12/i4/447.htm
- DOI: https://dx.doi.org/10.4251/wjgo.v12.i4.447


