Copyright
©The Author(s) 2020.
World J Gastrointest Oncol. Apr 15, 2020; 12(4): 383-393
Published online Apr 15, 2020. doi: 10.4251/wjgo.v12.i4.383
Published online Apr 15, 2020. doi: 10.4251/wjgo.v12.i4.383
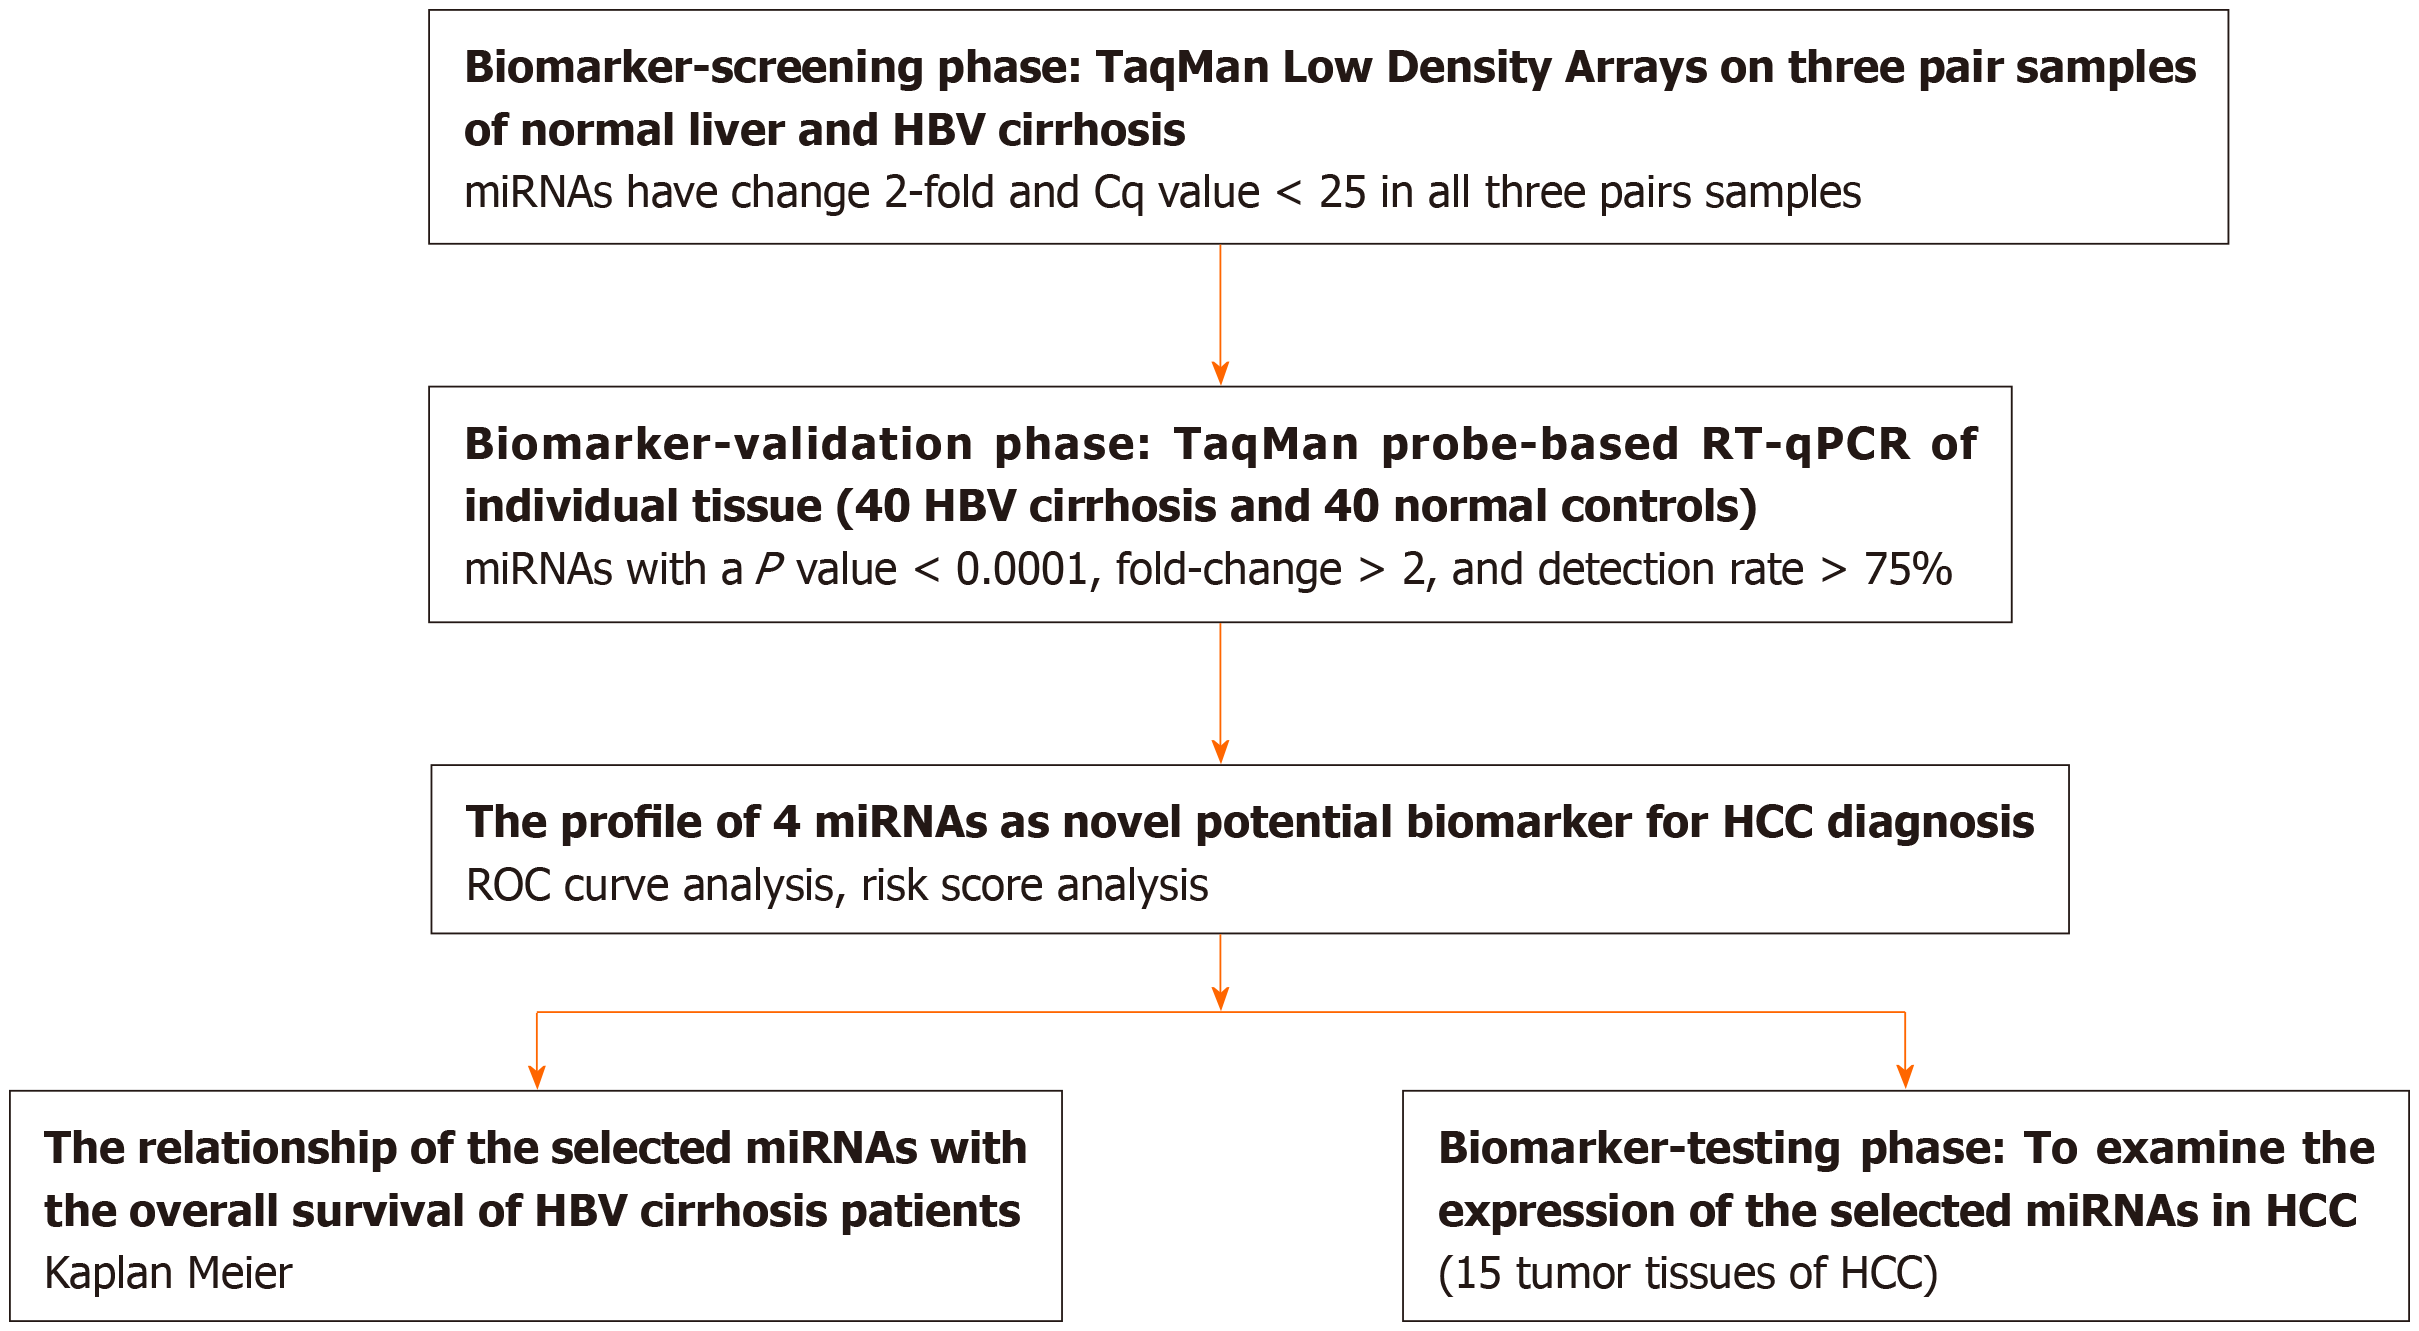
Figure 1 A flow chart of the experimental design.
HCC: Hepatocellular carcinoma; HBV: Hepatitis B virus; RT-qPCR: Real time quantitative polymerase chain reaction.
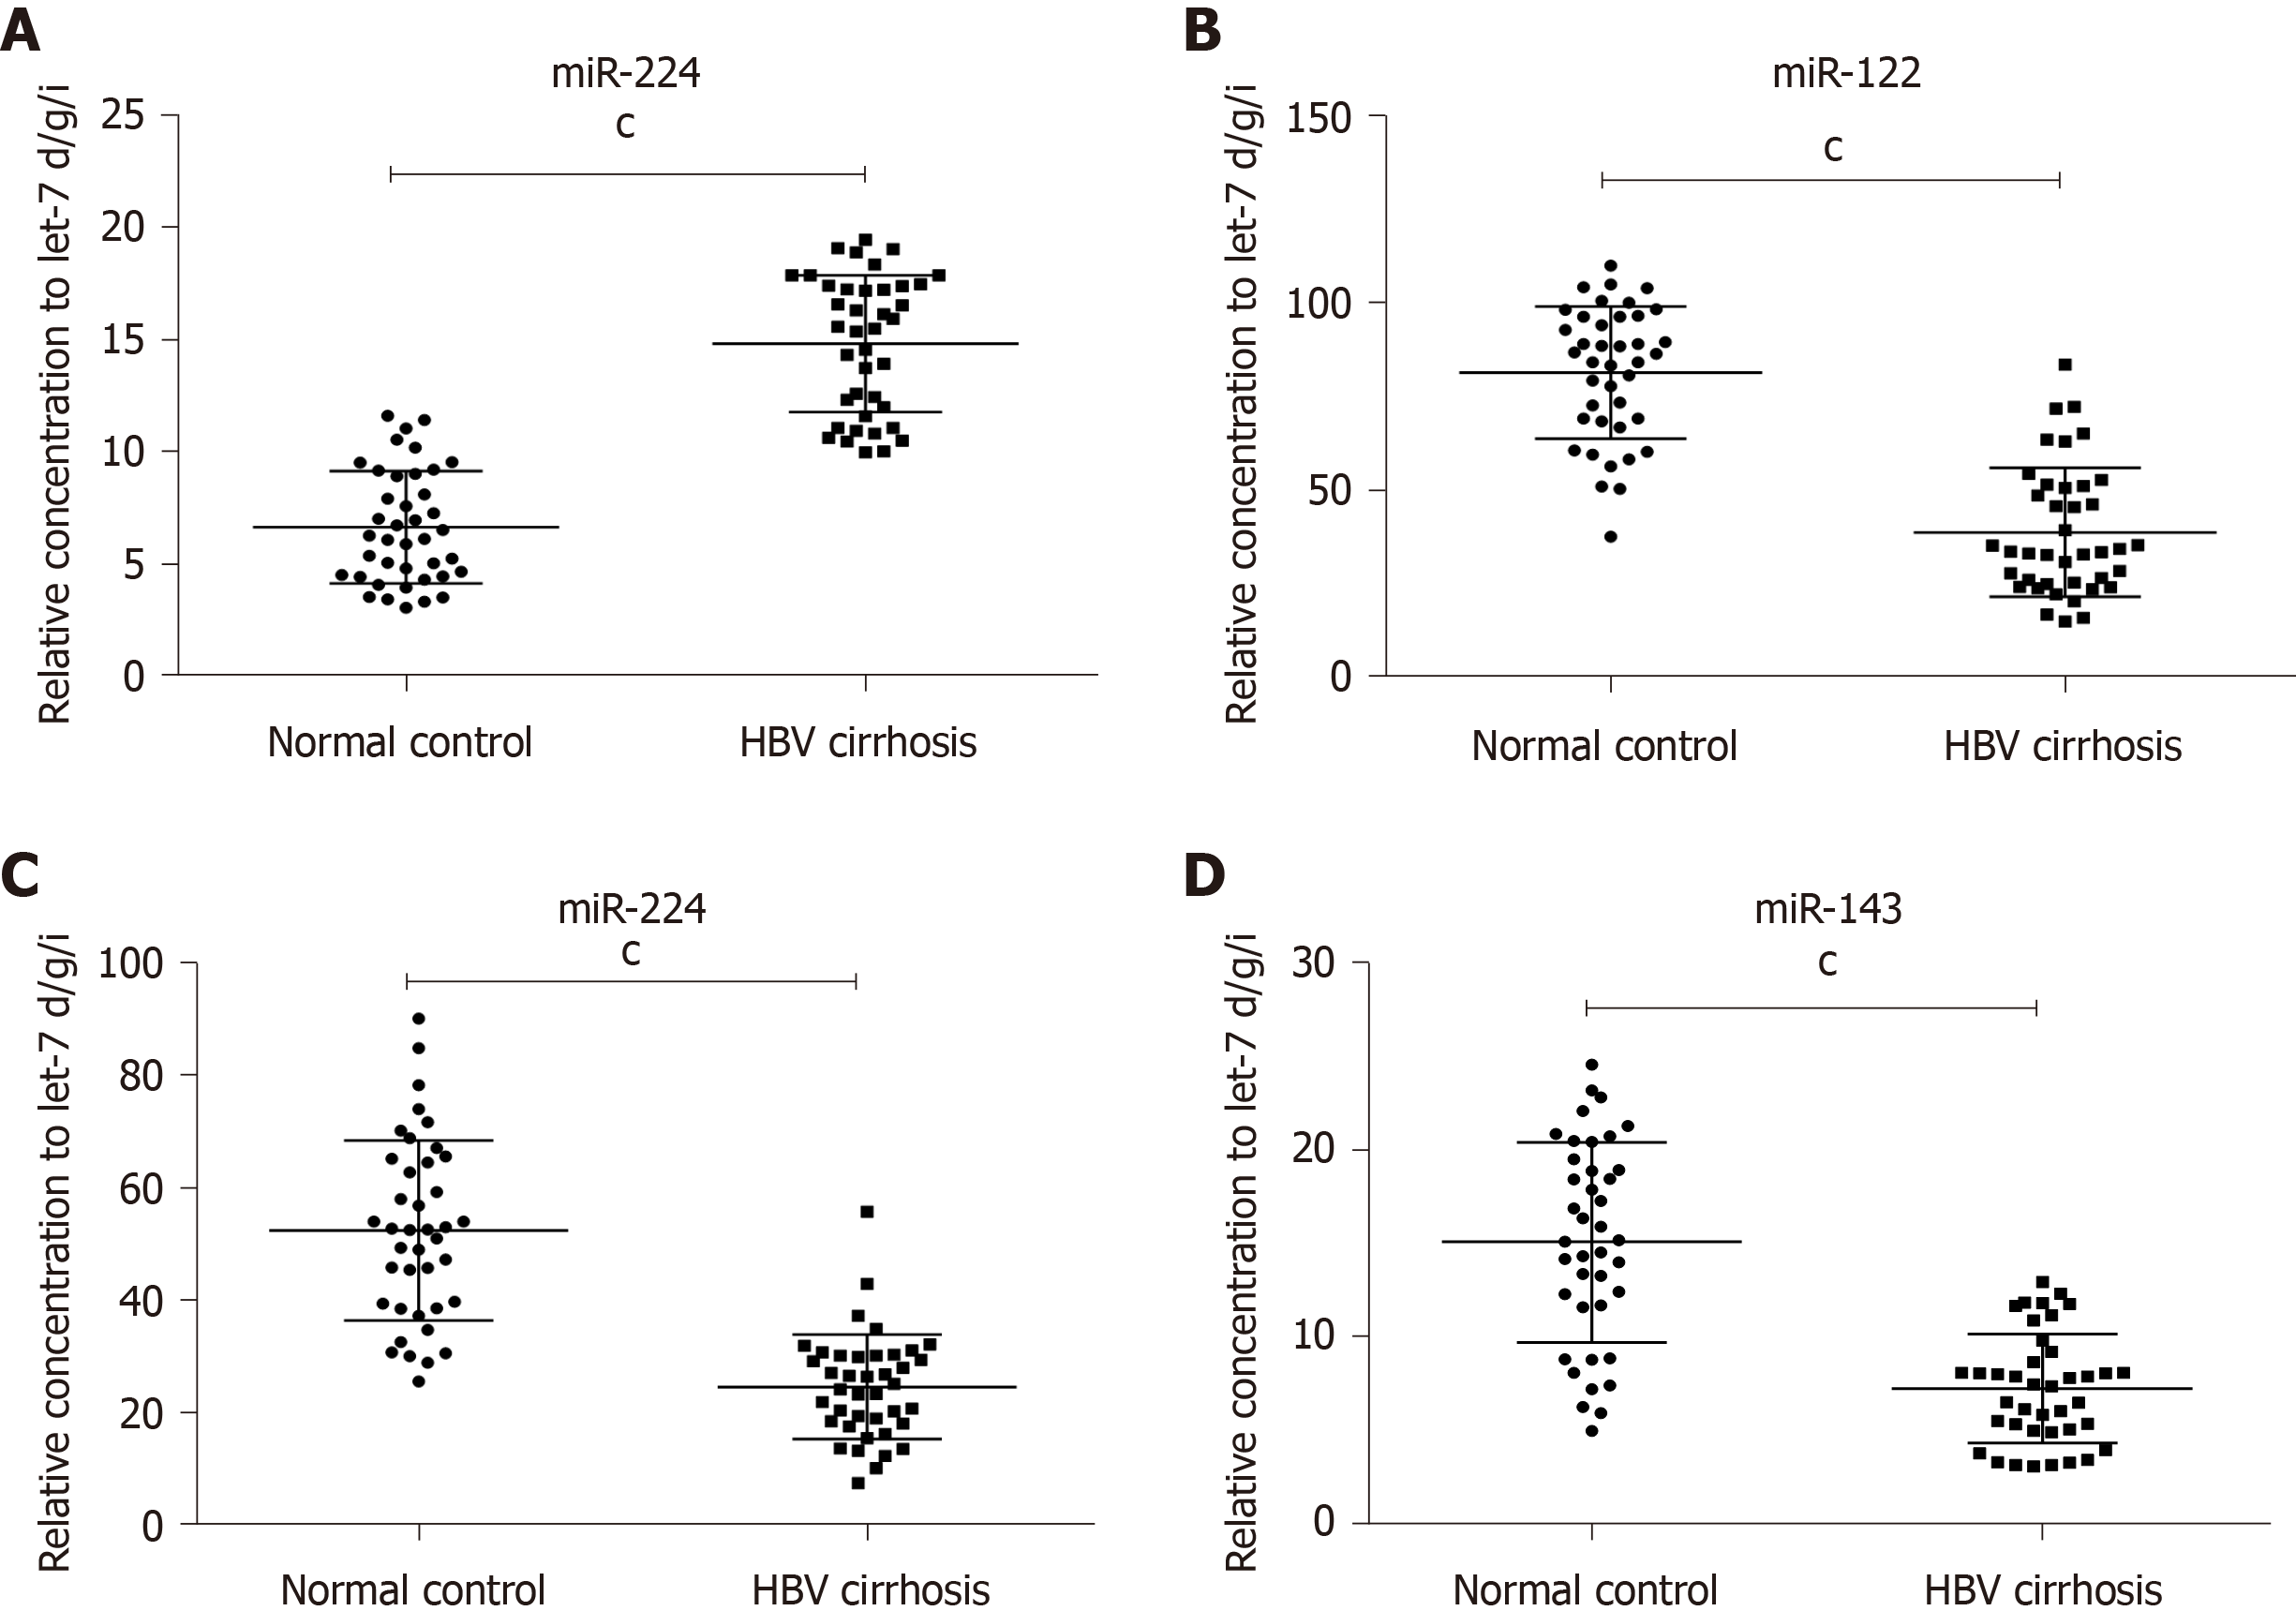
Figure 2 The relative concentration of the selected four miRNAs in the tissue from hepatitis B virus cirrhosis patients and normal controls.
A: miR-224; B: miR-122; C: miR-375; D: miR-143. cP < 0.001.
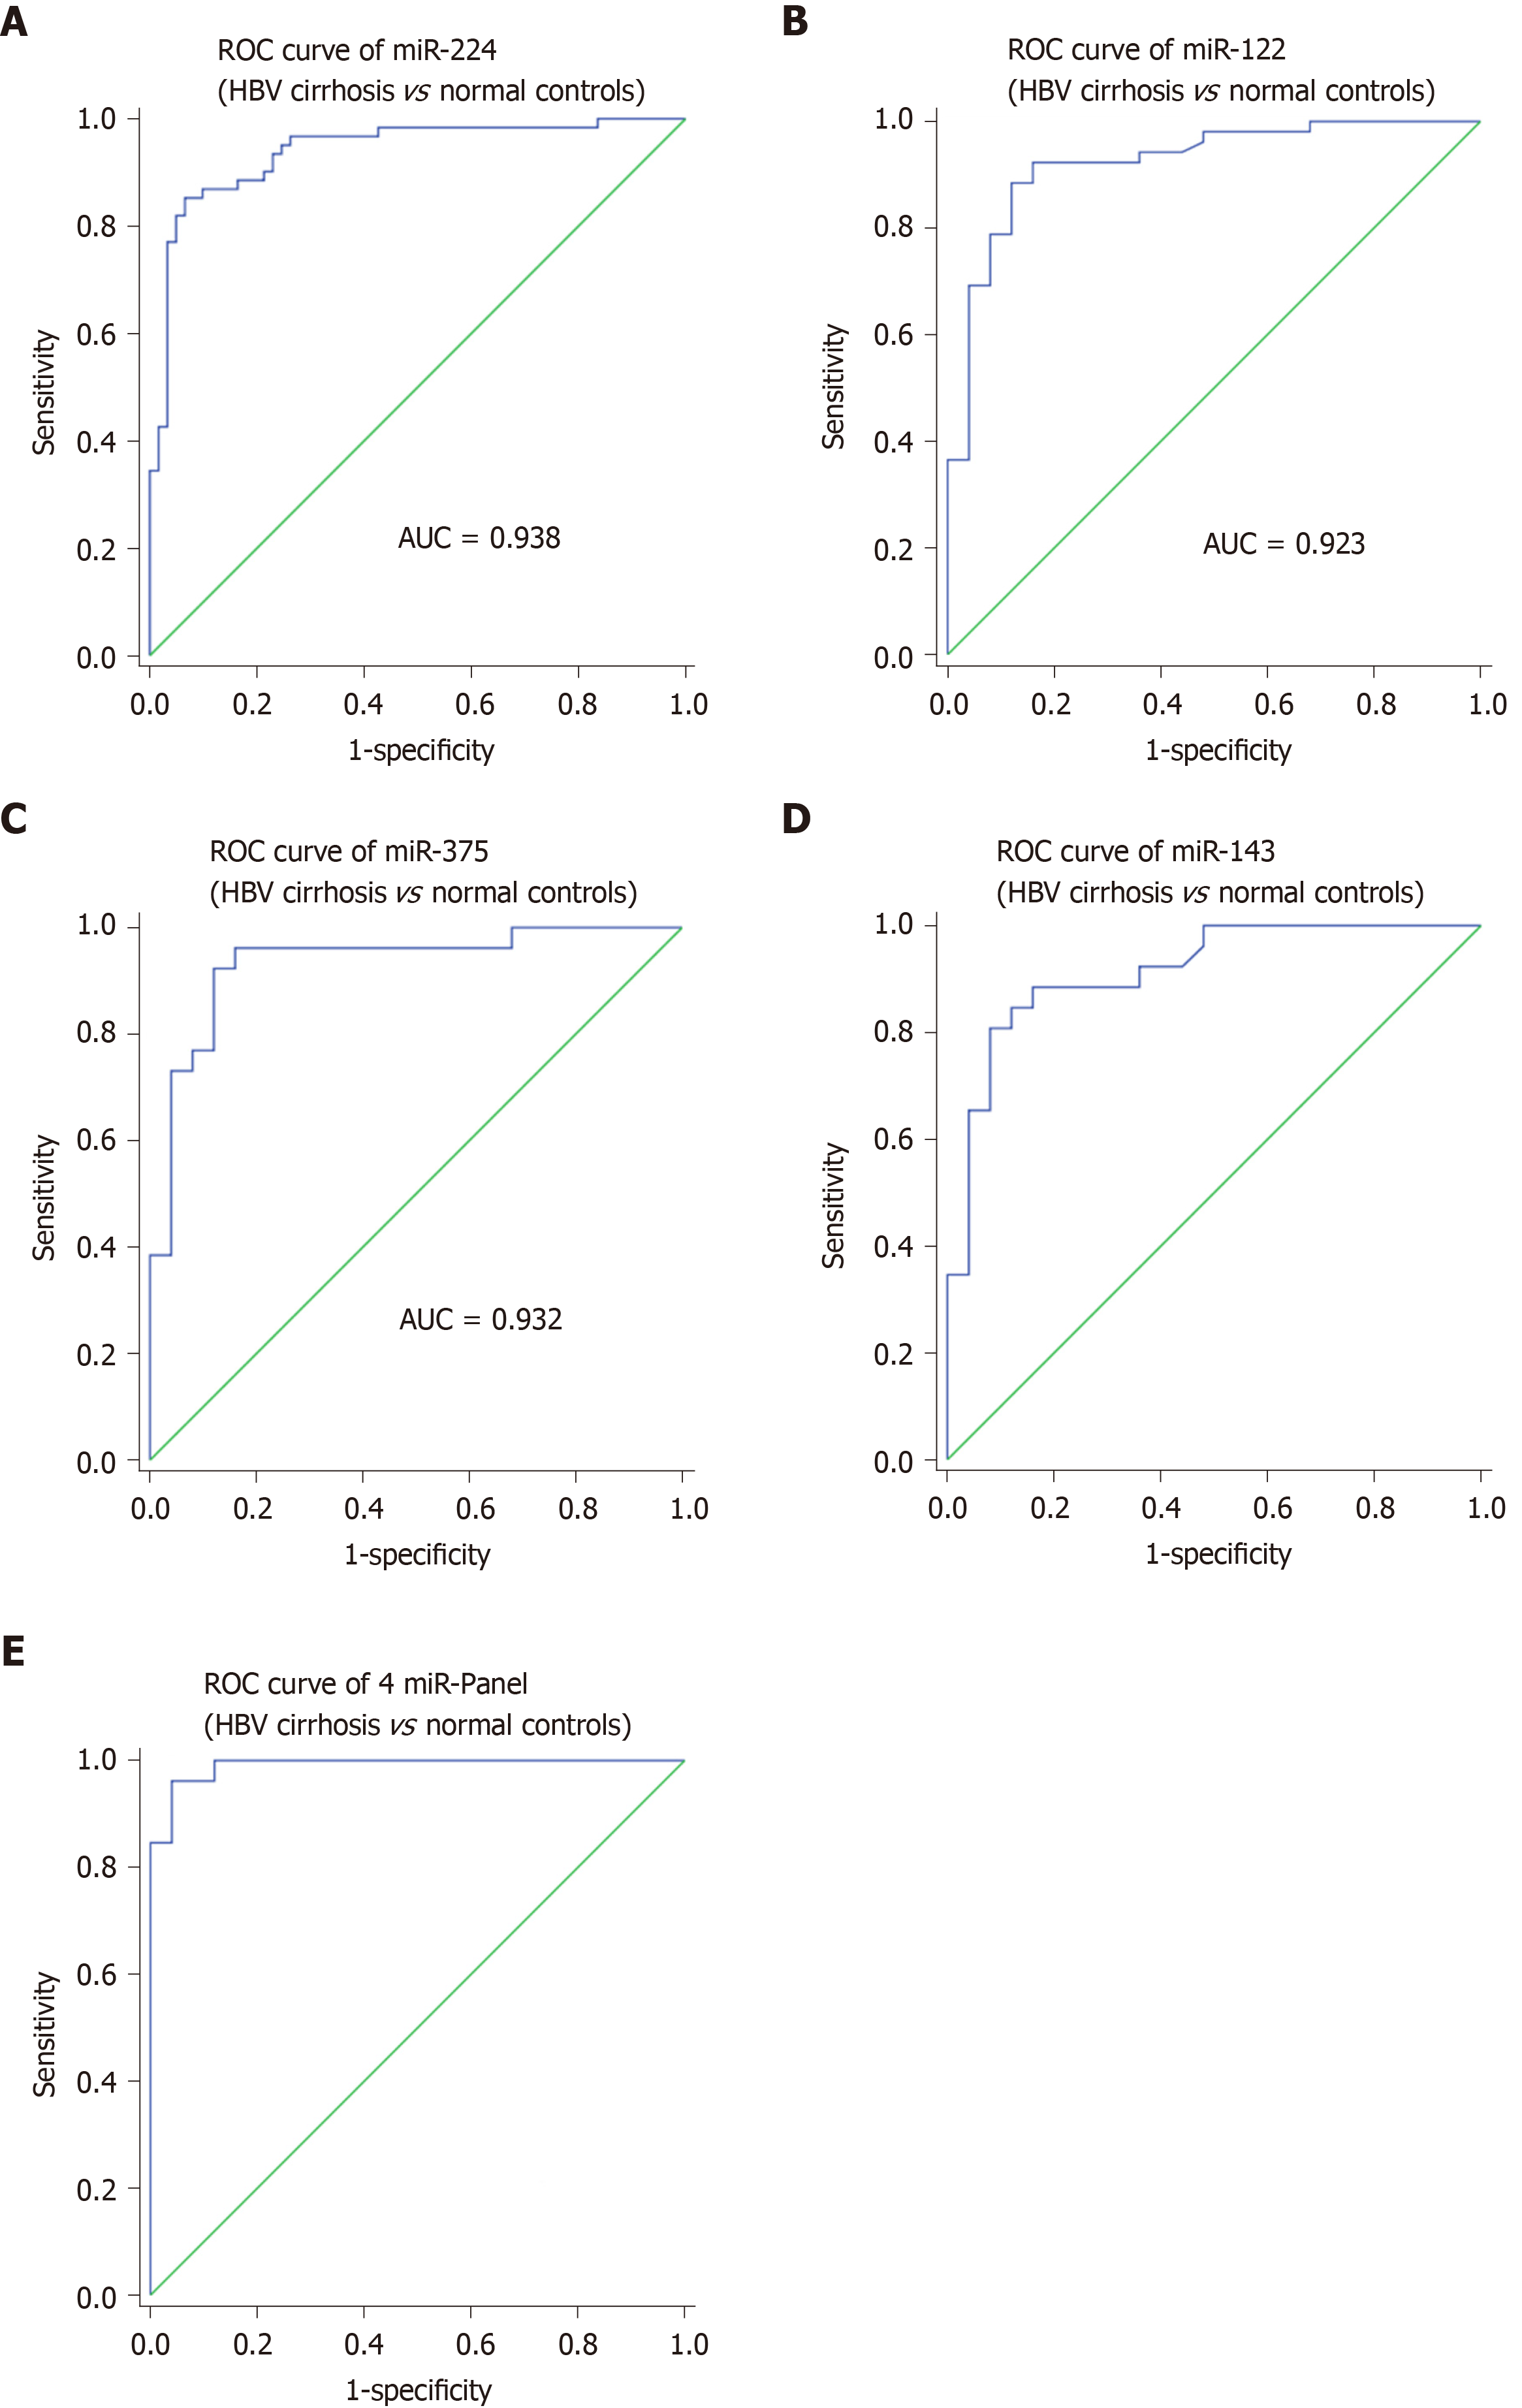
Figure 3 Sensitivity and specificity of the four-miRNA and their panel.
A: Receiver operating characteristic (ROC) curve of miR-224; B: ROC curve of miR-122; C: ROC curve of miR-375; D: ROC curve of miR-143; E: ROC curve of 4 miR-Panel. ROC: Receiver operating characteristic curves; AUC: Area under curves; HBV: Hepatitis B virus.
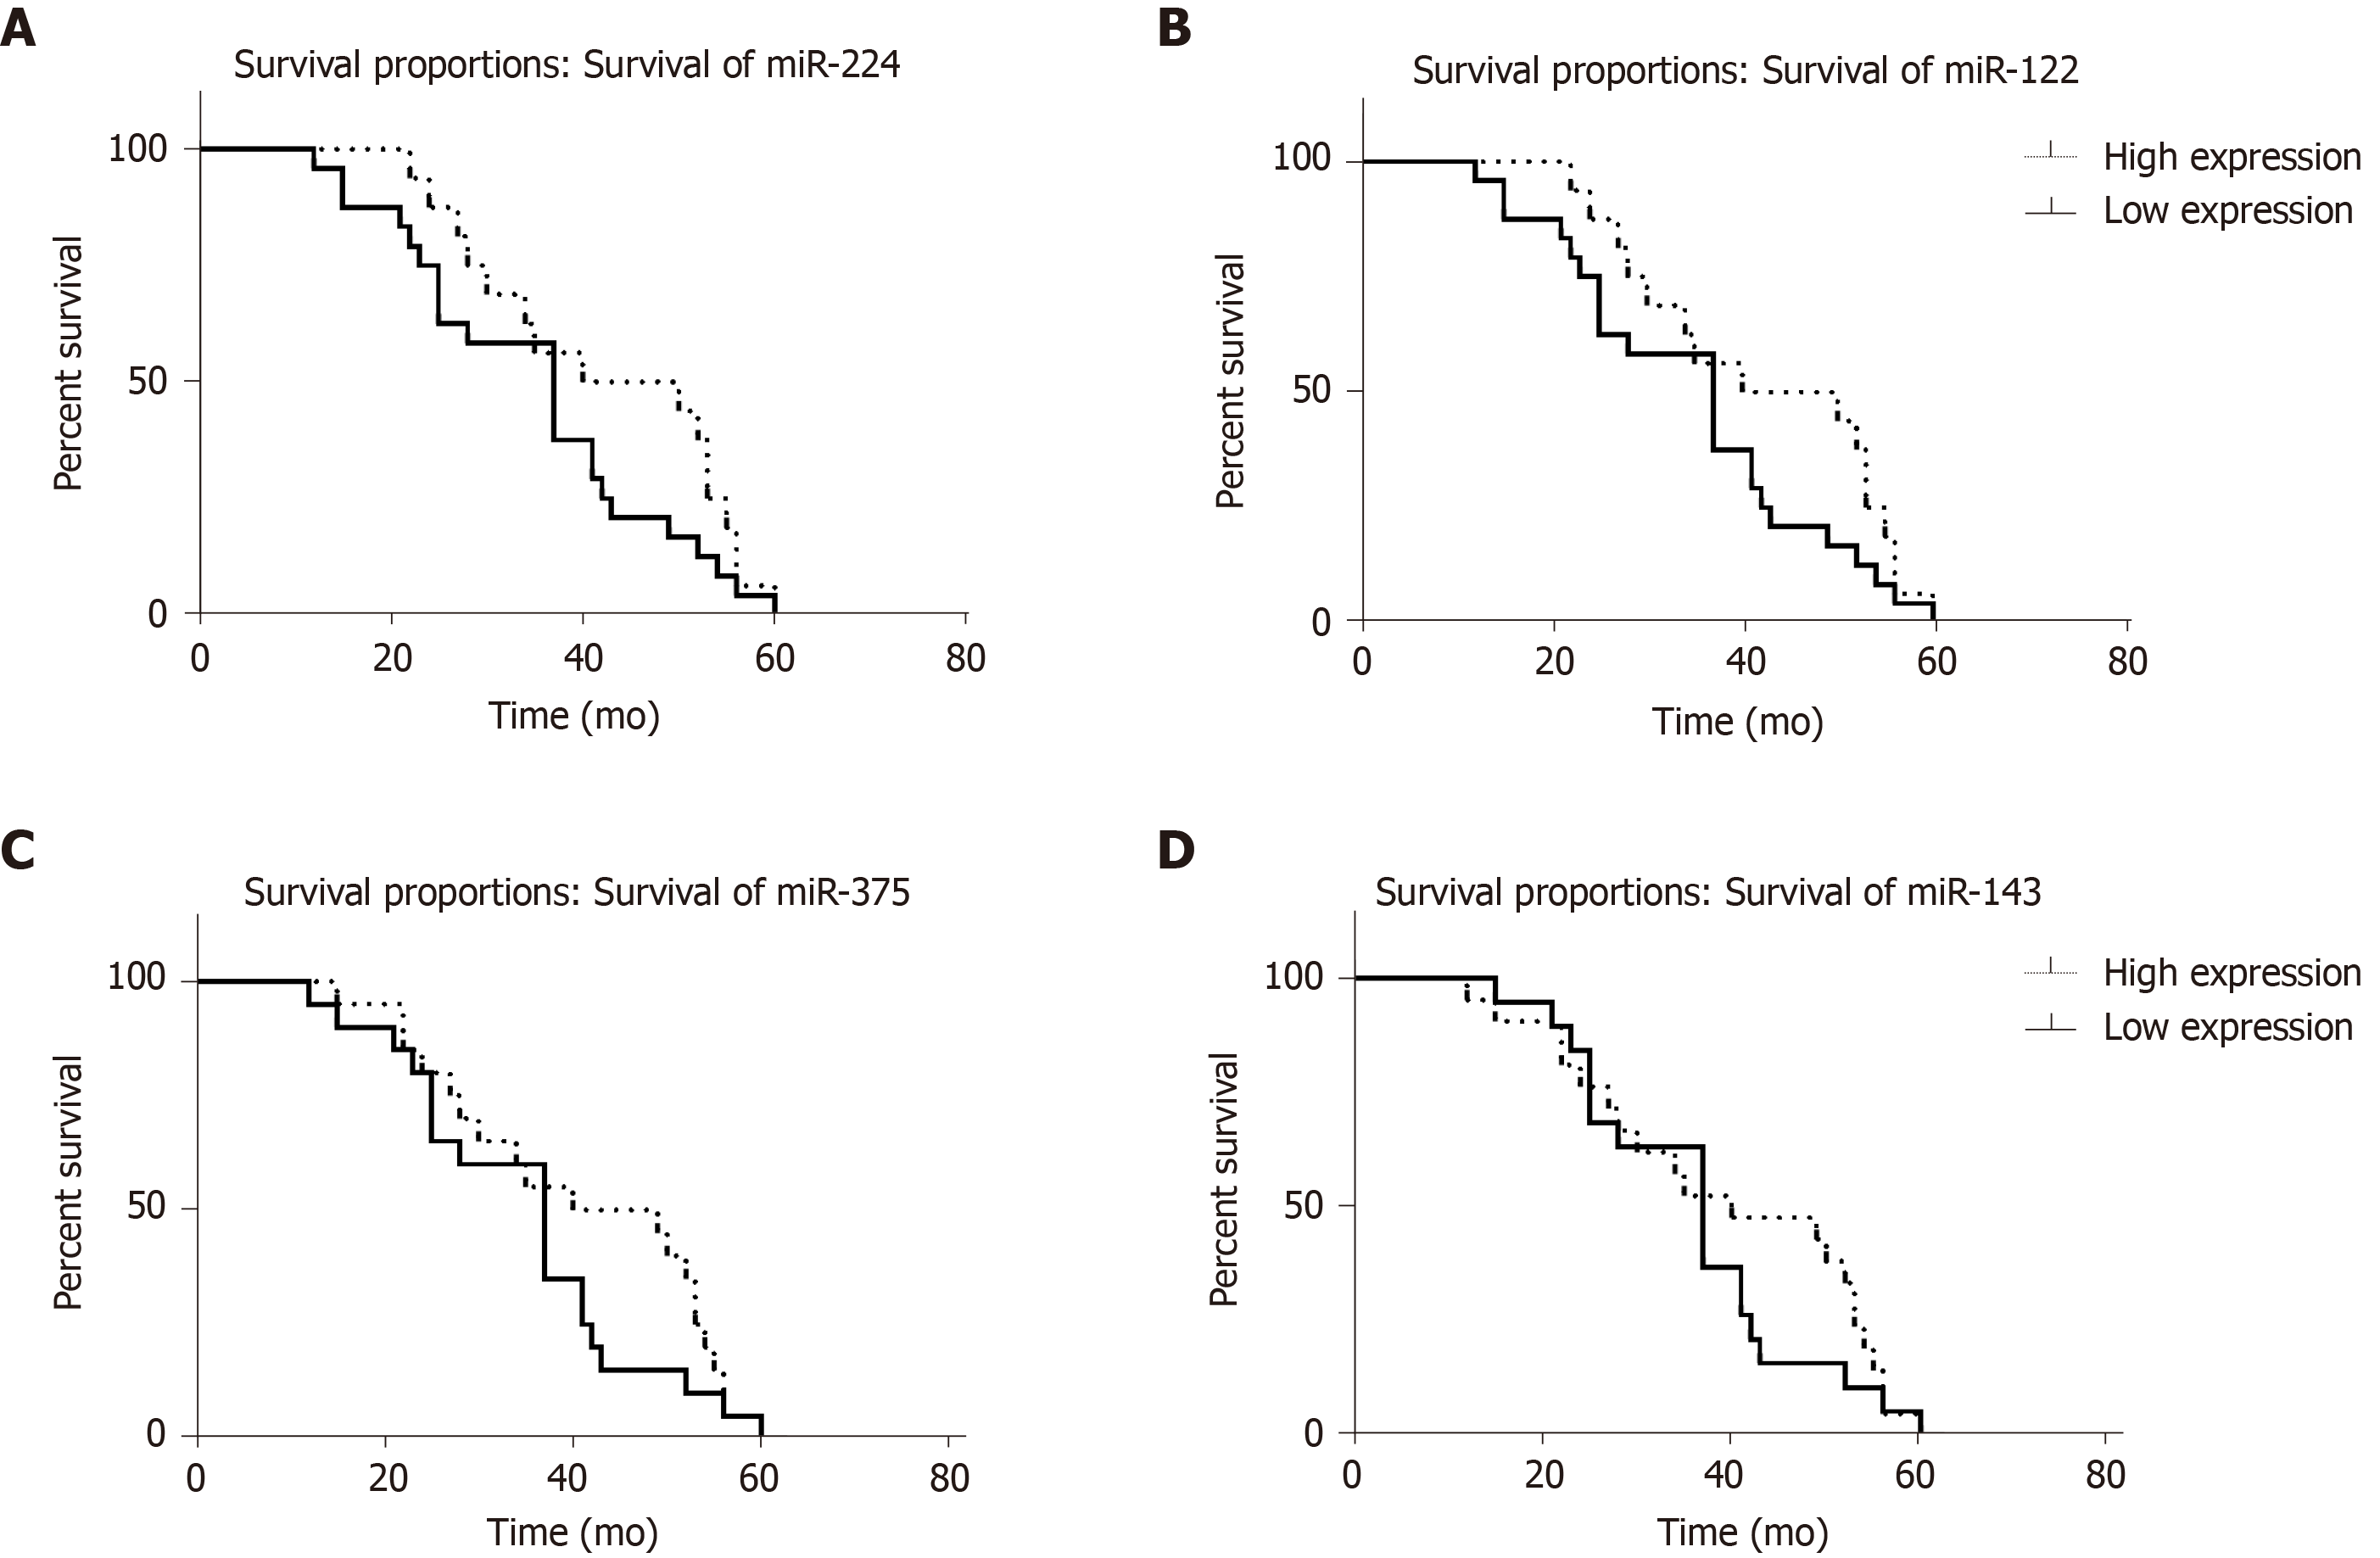
Figure 4 Kaplan-Meier curve of relationship between the expression of 4 miRNAs and overall survival of hepatitis B virus cirrhosis.
A: Survival of miR-224; B: Survival of miR-122; C: Survival of miR-375; D: Survival of miR-143.
- Citation: Zhang Q, Xu HF, Song WY, Zhang PJ, Song YB. Potential microRNA panel for the diagnosis and prediction of overall survival of hepatocellular carcinoma with hepatitis B virus infection. World J Gastrointest Oncol 2020; 12(4): 383-393
- URL: https://www.wjgnet.com/1948-5204/full/v12/i4/383.htm
- DOI: https://dx.doi.org/10.4251/wjgo.v12.i4.383


