Copyright
©The Author(s) 2019.
World J Gastrointest Oncol. May 15, 2019; 11(5): 367-376
Published online May 15, 2019. doi: 10.4251/wjgo.v11.i5.367
Published online May 15, 2019. doi: 10.4251/wjgo.v11.i5.367
Figure 1 Hepatocellular carcinoma in segment VIII at diagnosis.
A: Contrast-enhanced computed tomography (CT) arterial phase; B: Contrast-enhanced CT venous phase; C: Magnetic resonance imaging with liver-specific contrast agent.
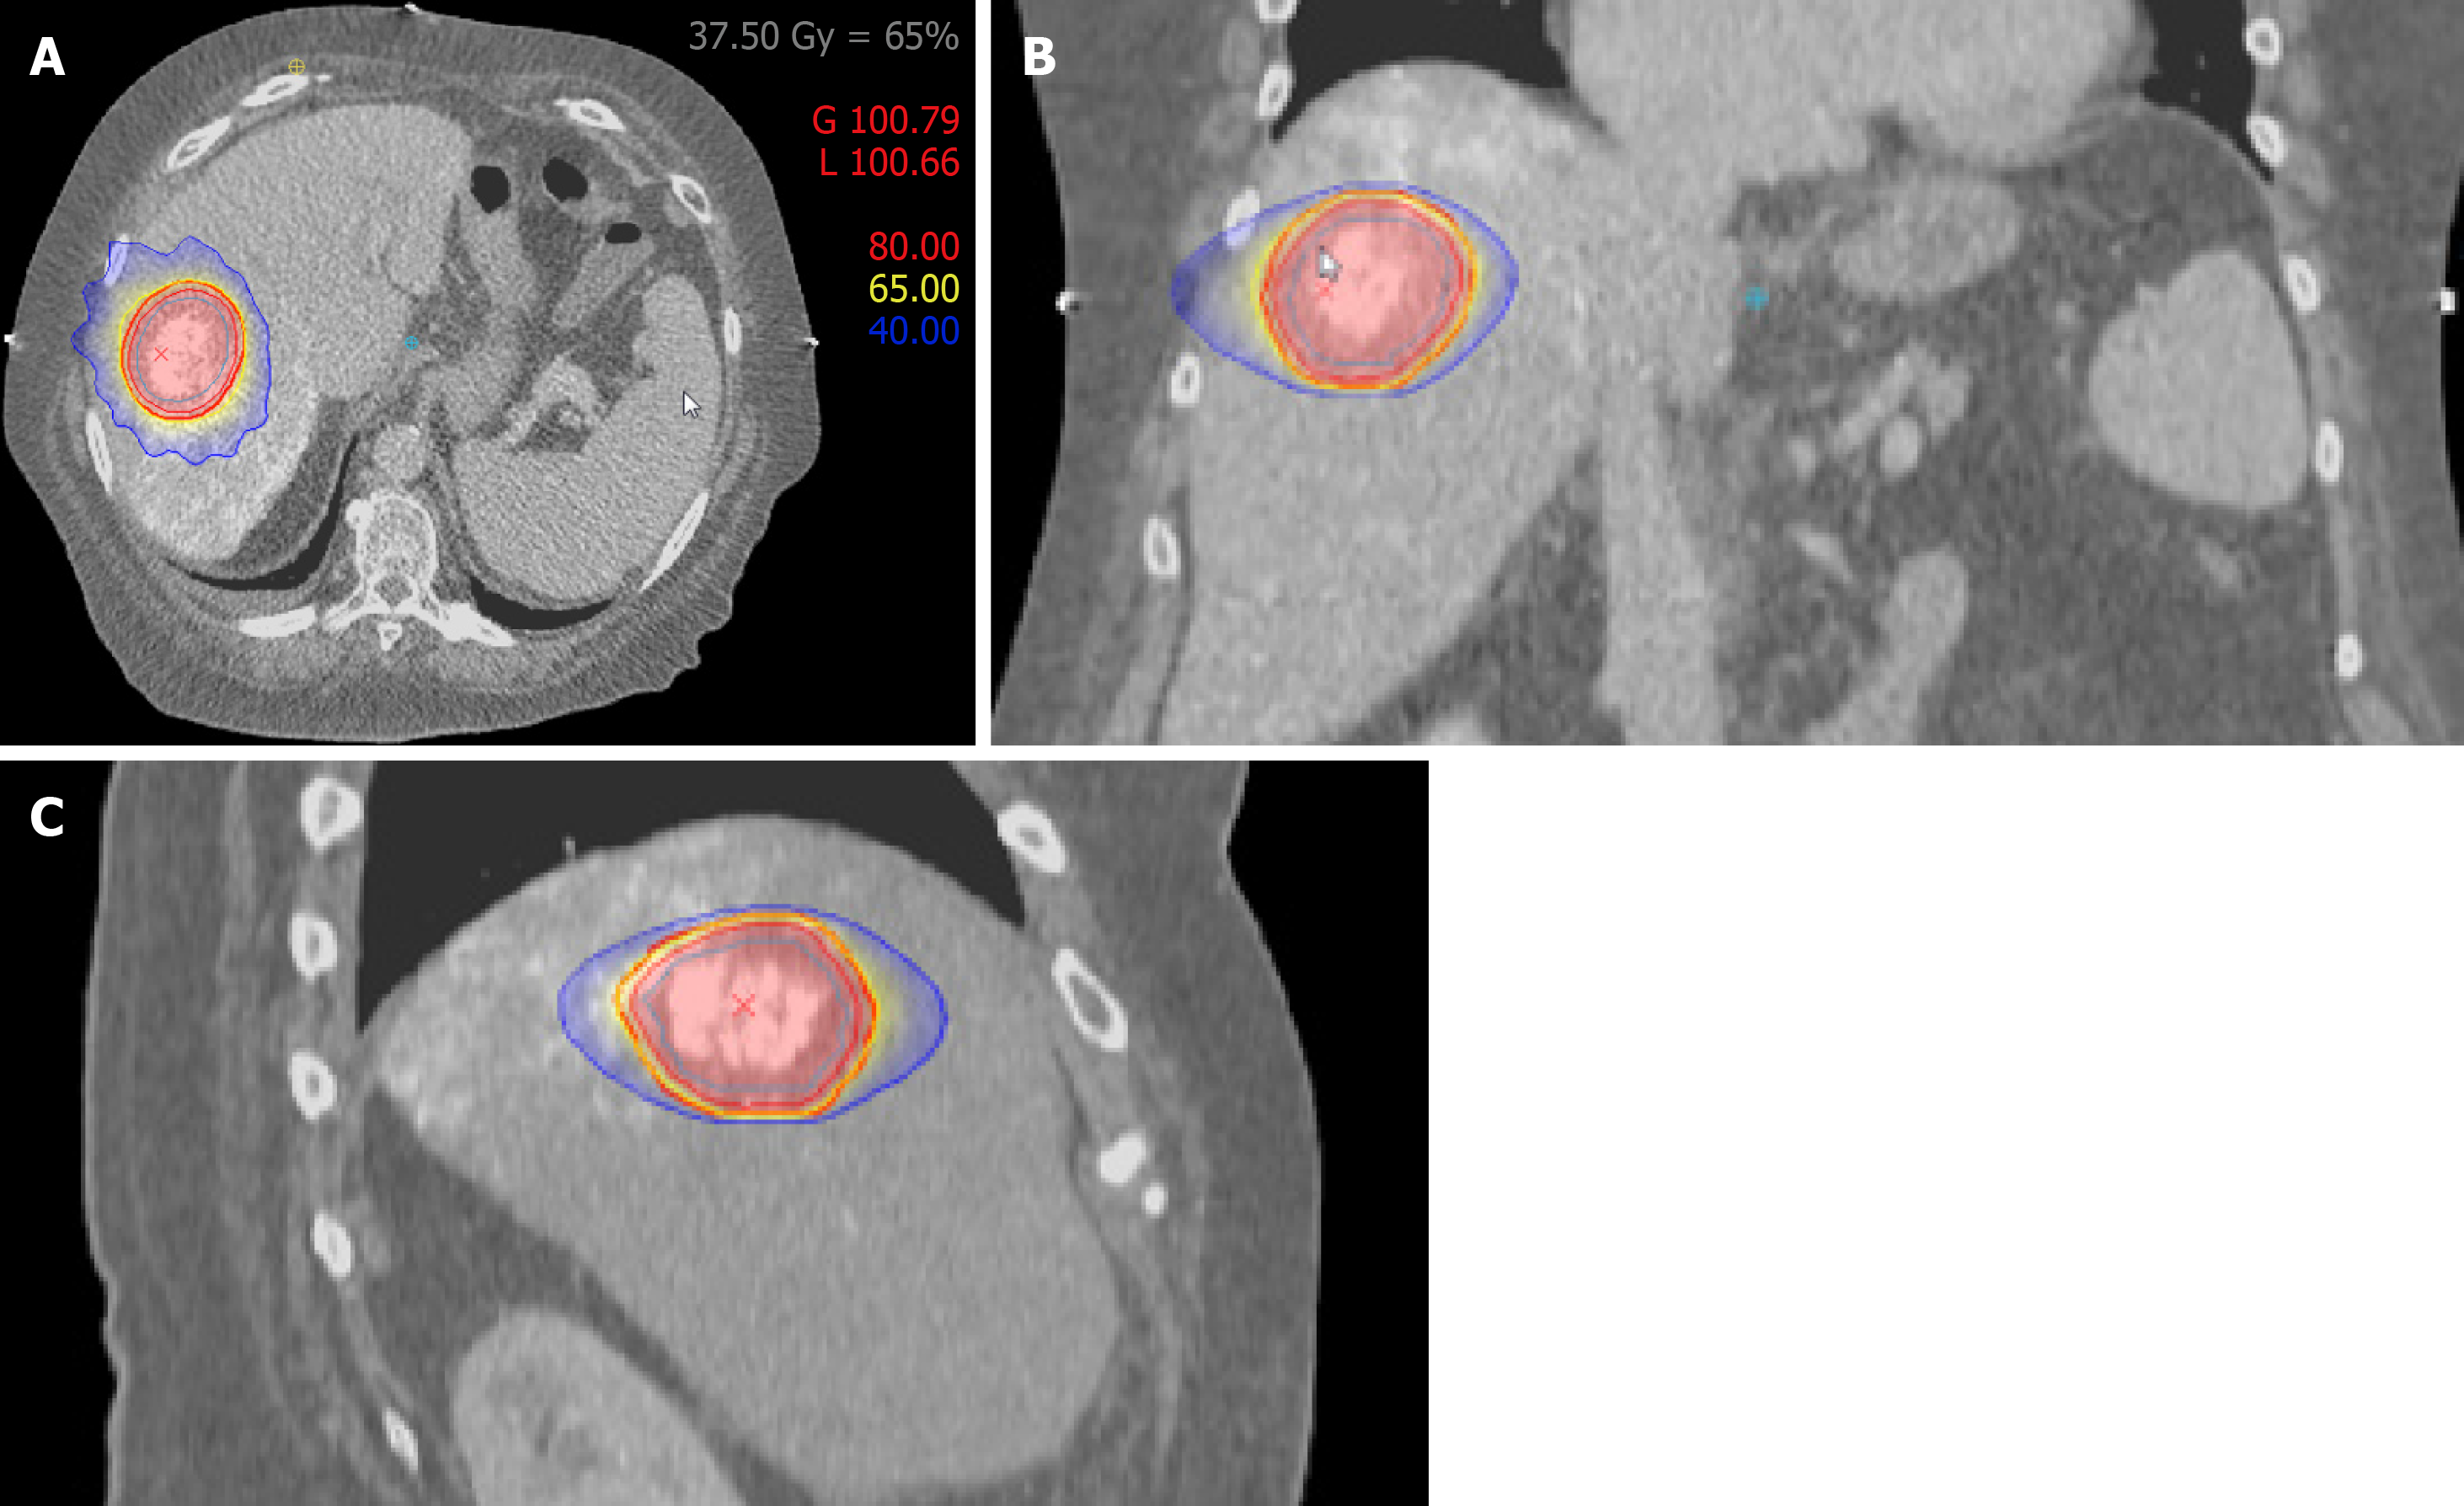
Figure 2 Treatment plan (prescription dose 3 × 12.
5 Gy to 65% surrounding isodose). A: Isodose plan in axial view; B: Frontal view; C: Sagittal view, broad red line: Planning target volume (PTV), yellow line: PTV-surrounding 65% isodose = 37.5 Gy, light blue line: Internal target volume (ITV), narrow red line: ITV-surrounding 80% isodose = 46.2 Gy, dark blue line: 40% isodose = 23.1 Gy.
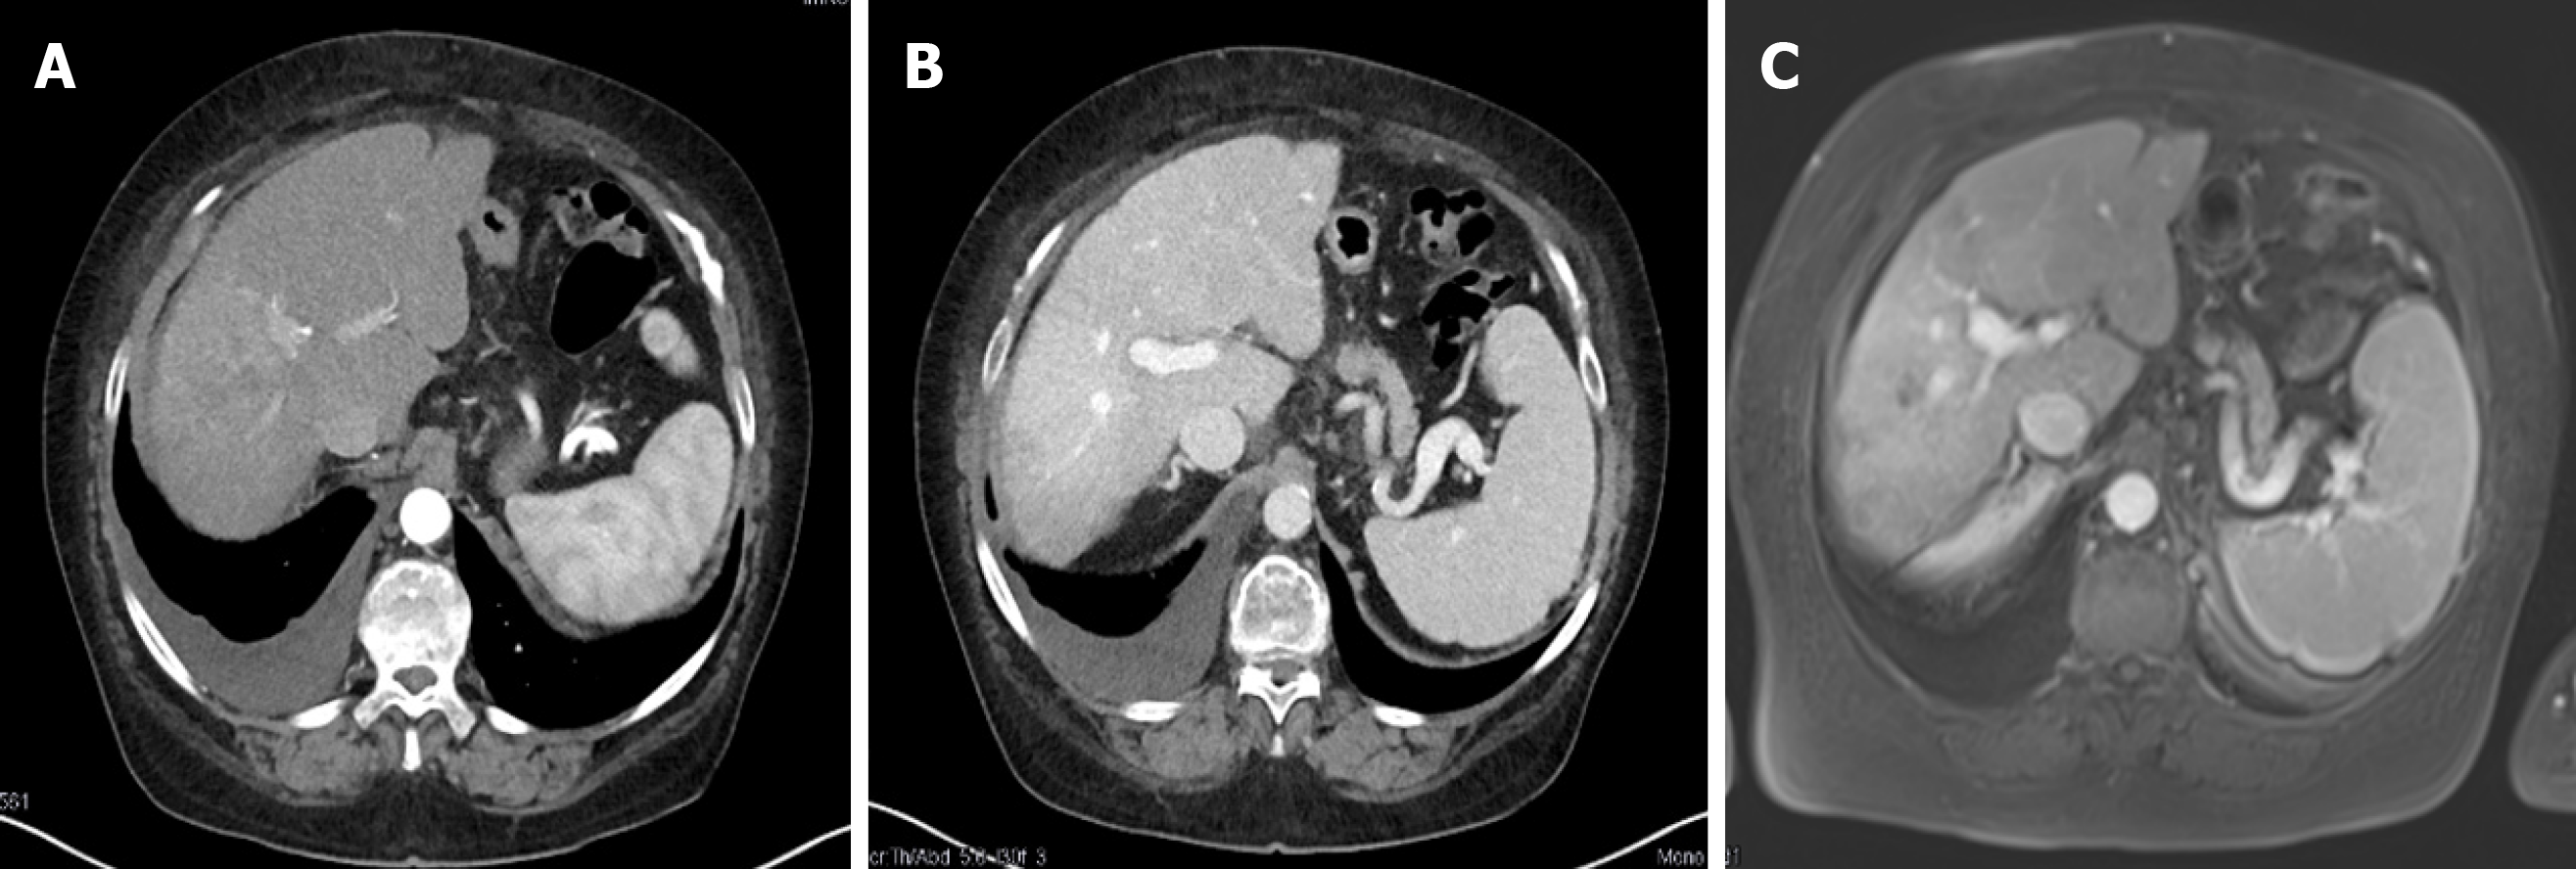
Figure 3 Complete response 9 months after transarterial chemoembolization and stereotactic body radiation therapy.
A: Contrast-enhanced computed tomography (CT) arterial phase; B: Contrast-enhanced CT venous phase; C: Magnetic resonance imaging with liver-specific contrast agent.
- Citation: Gerum S, Jensen AD, Roeder F. Stereotactic body radiation therapy in patients with hepatocellular carcinoma: A mini-review. World J Gastrointest Oncol 2019; 11(5): 367-376
- URL: https://www.wjgnet.com/1948-5204/full/v11/i5/367.htm
- DOI: https://dx.doi.org/10.4251/wjgo.v11.i5.367


