Copyright
©The Author(s) 2019.
World J Gastrointest Oncol. Nov 15, 2019; 11(11): 971-982
Published online Nov 15, 2019. doi: 10.4251/wjgo.v11.i11.971
Published online Nov 15, 2019. doi: 10.4251/wjgo.v11.i11.971
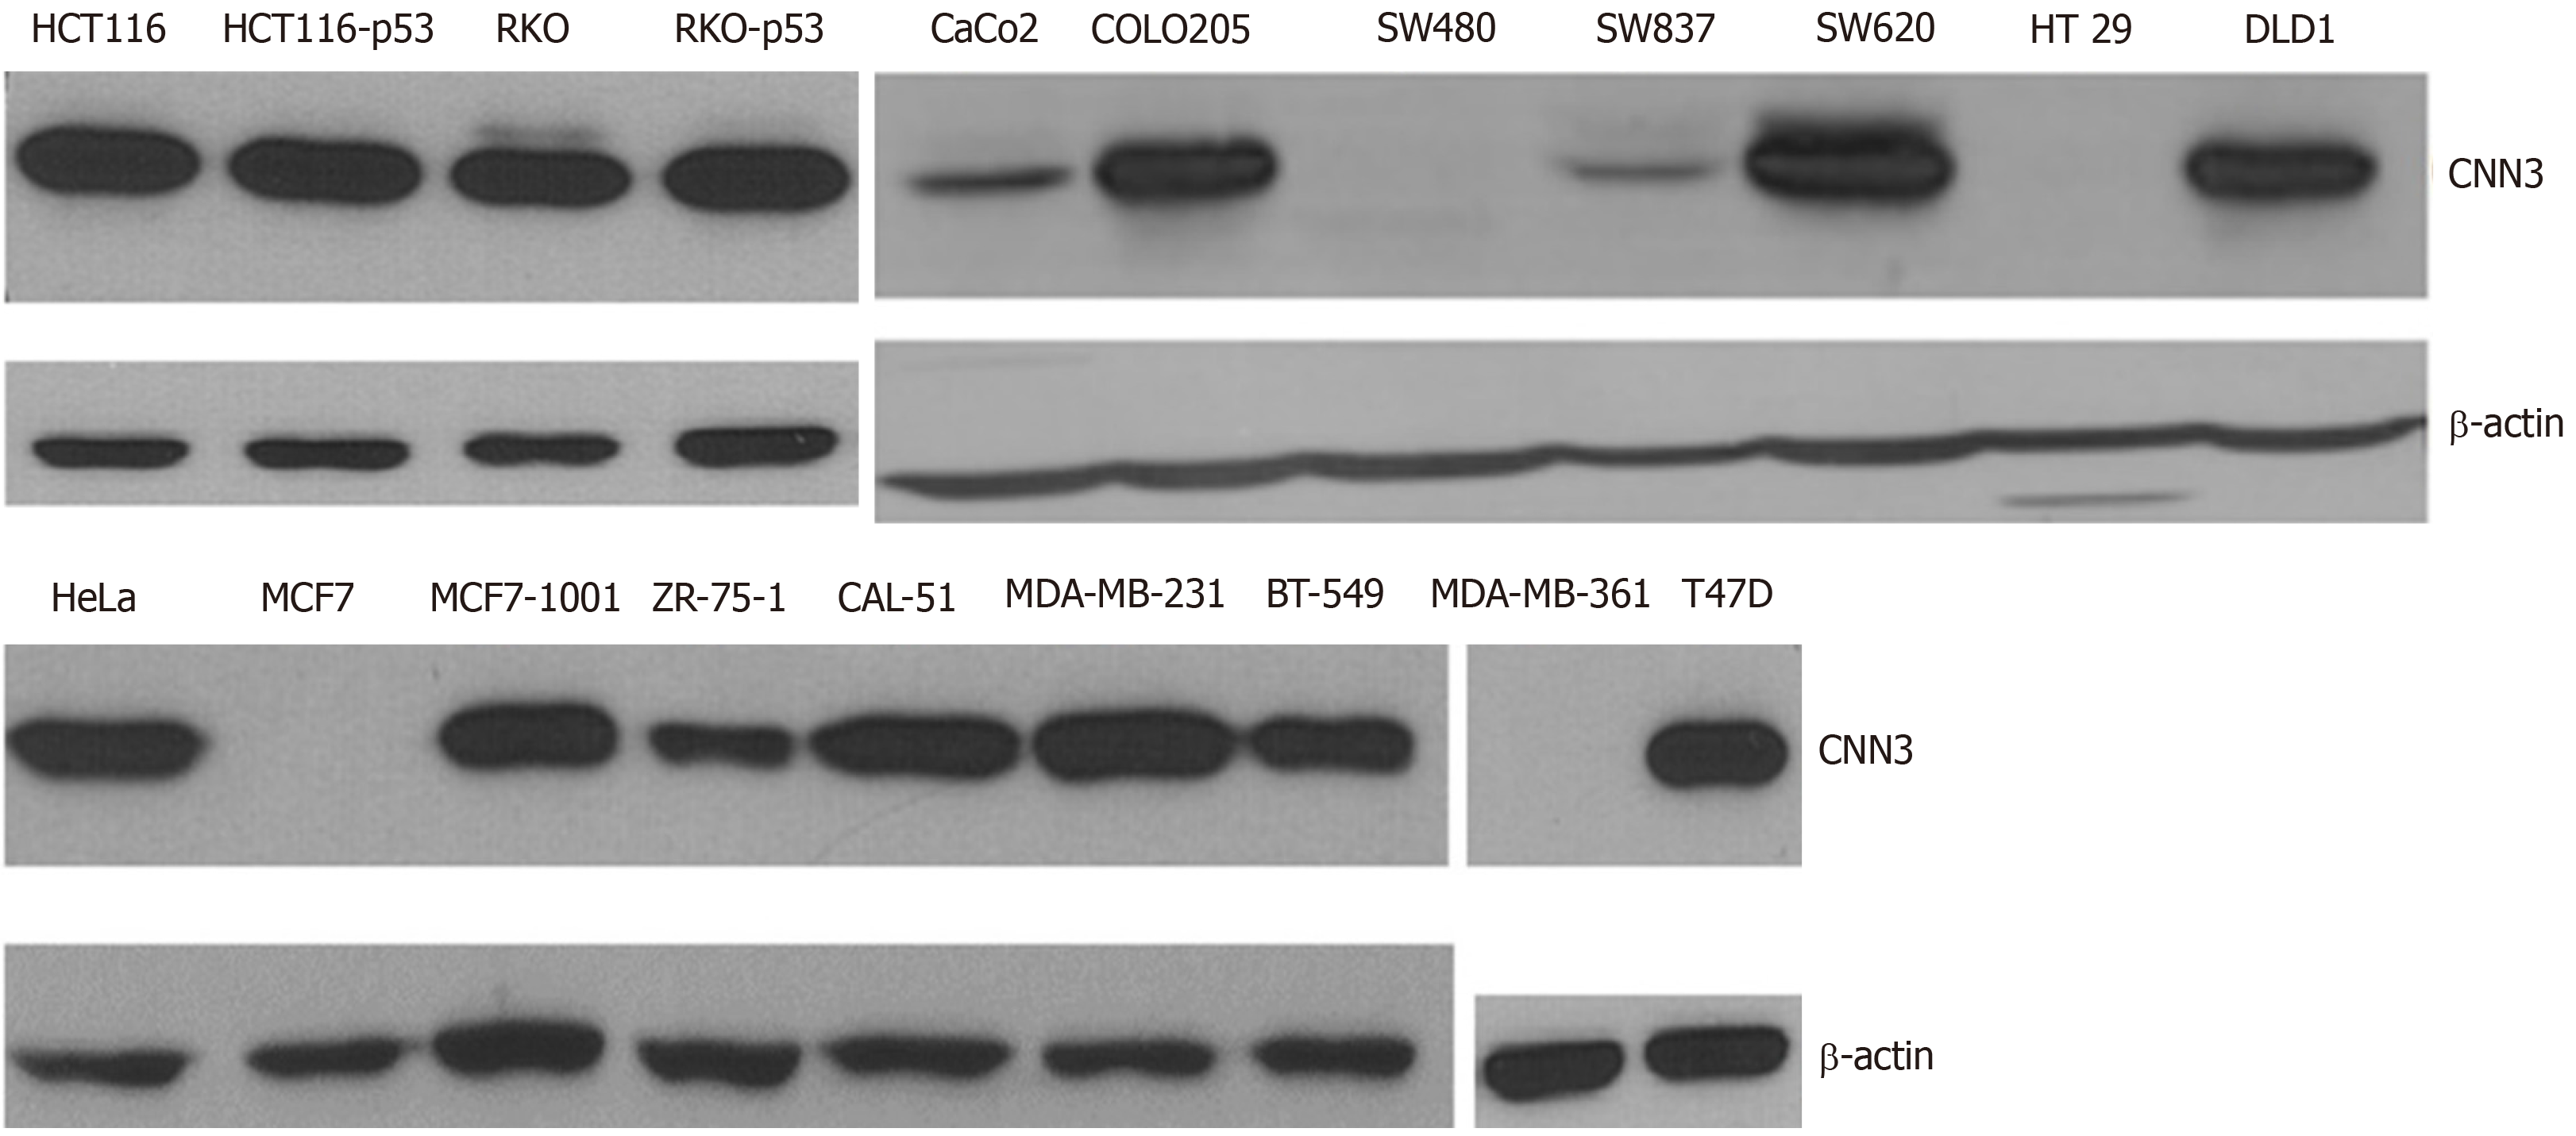
Figure 1 Western blot analysis of CNN3 expression in colon cancer cells (upper panel) and breast cancer cells (lower panel).
HeLa cervical cancer cell line was used as the epithelial to mesenchymal transition control. CNN3: Calponin 3.
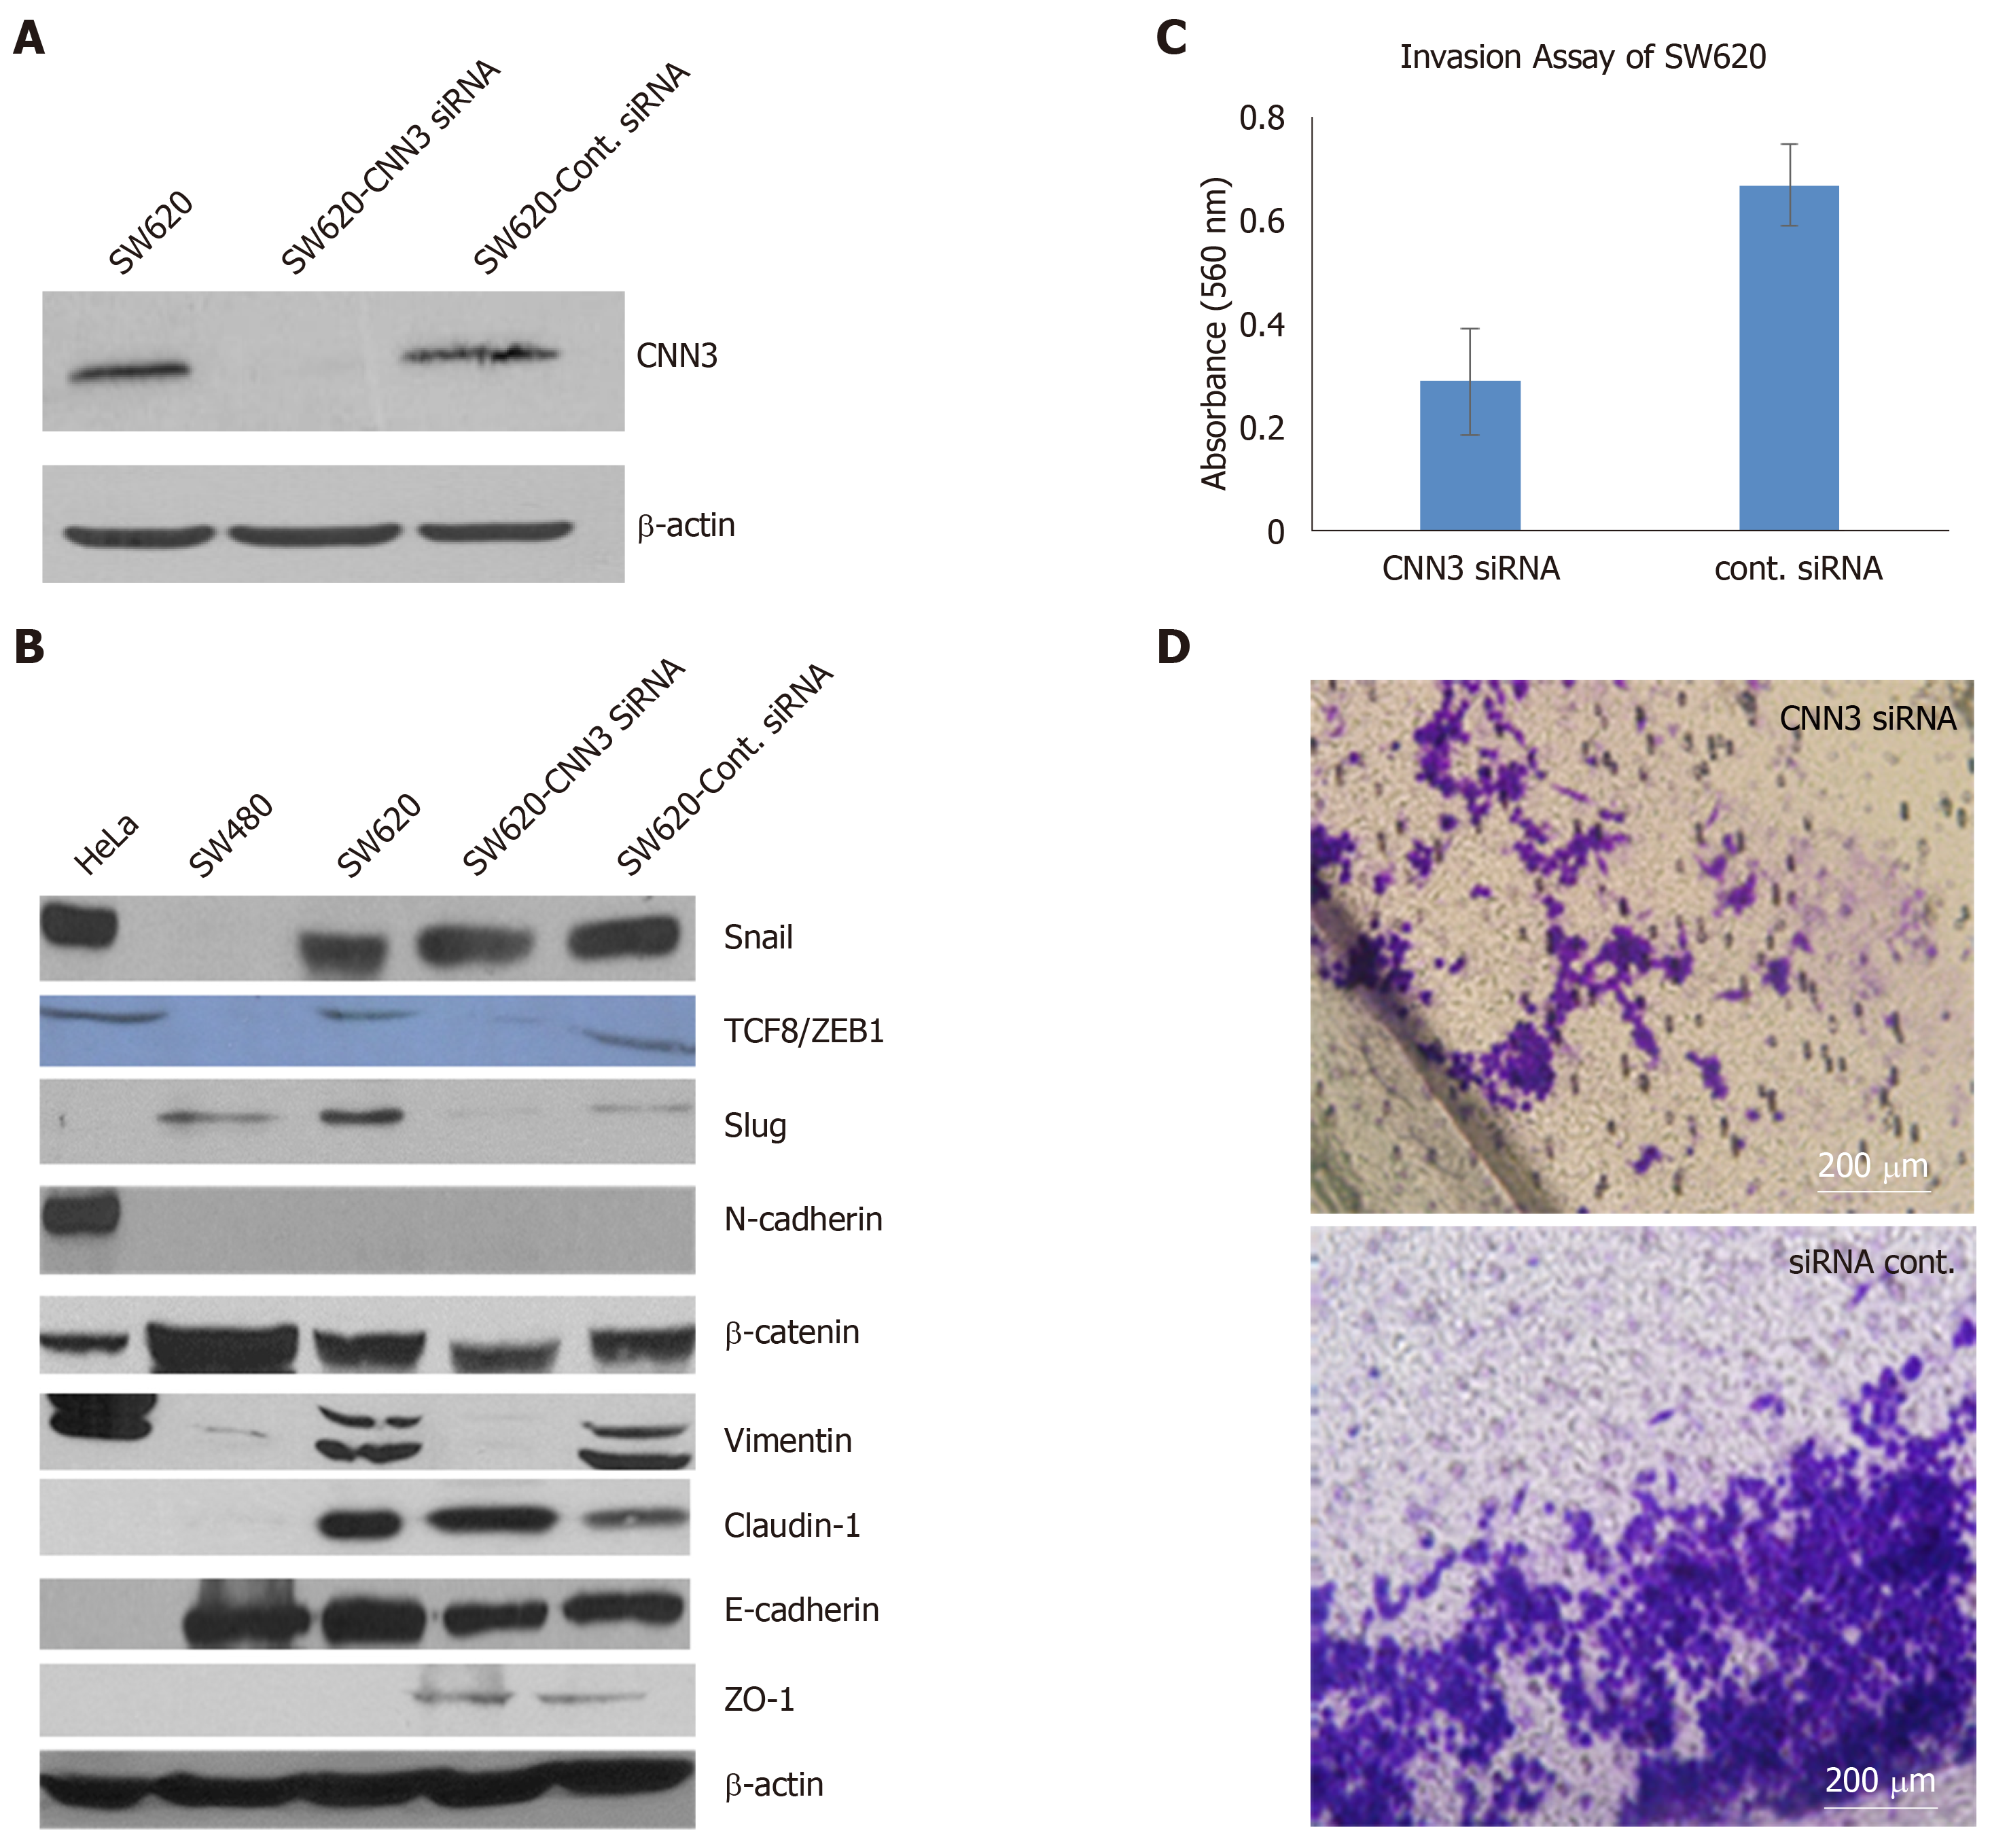
Figure 2 Functional consequences of CNN3 silencing in the SW620 metastatic colon cancer cell line.
A: High silencing efficiency evidenced by barely detectable CNN3 protein band by western blot; B: Effect of CNN3 silencing on expression of epithelial to mesenchymal transition markers; note loss or reduction of mesenchymal markers after silencing; C: Invasion assay results showing reduction in the collagen invasion after silencing as detected by decreased dye elution; D: Decreased number of invaded cells on microscopic examination (Magnification 100×). CNN3: Calponin 3.
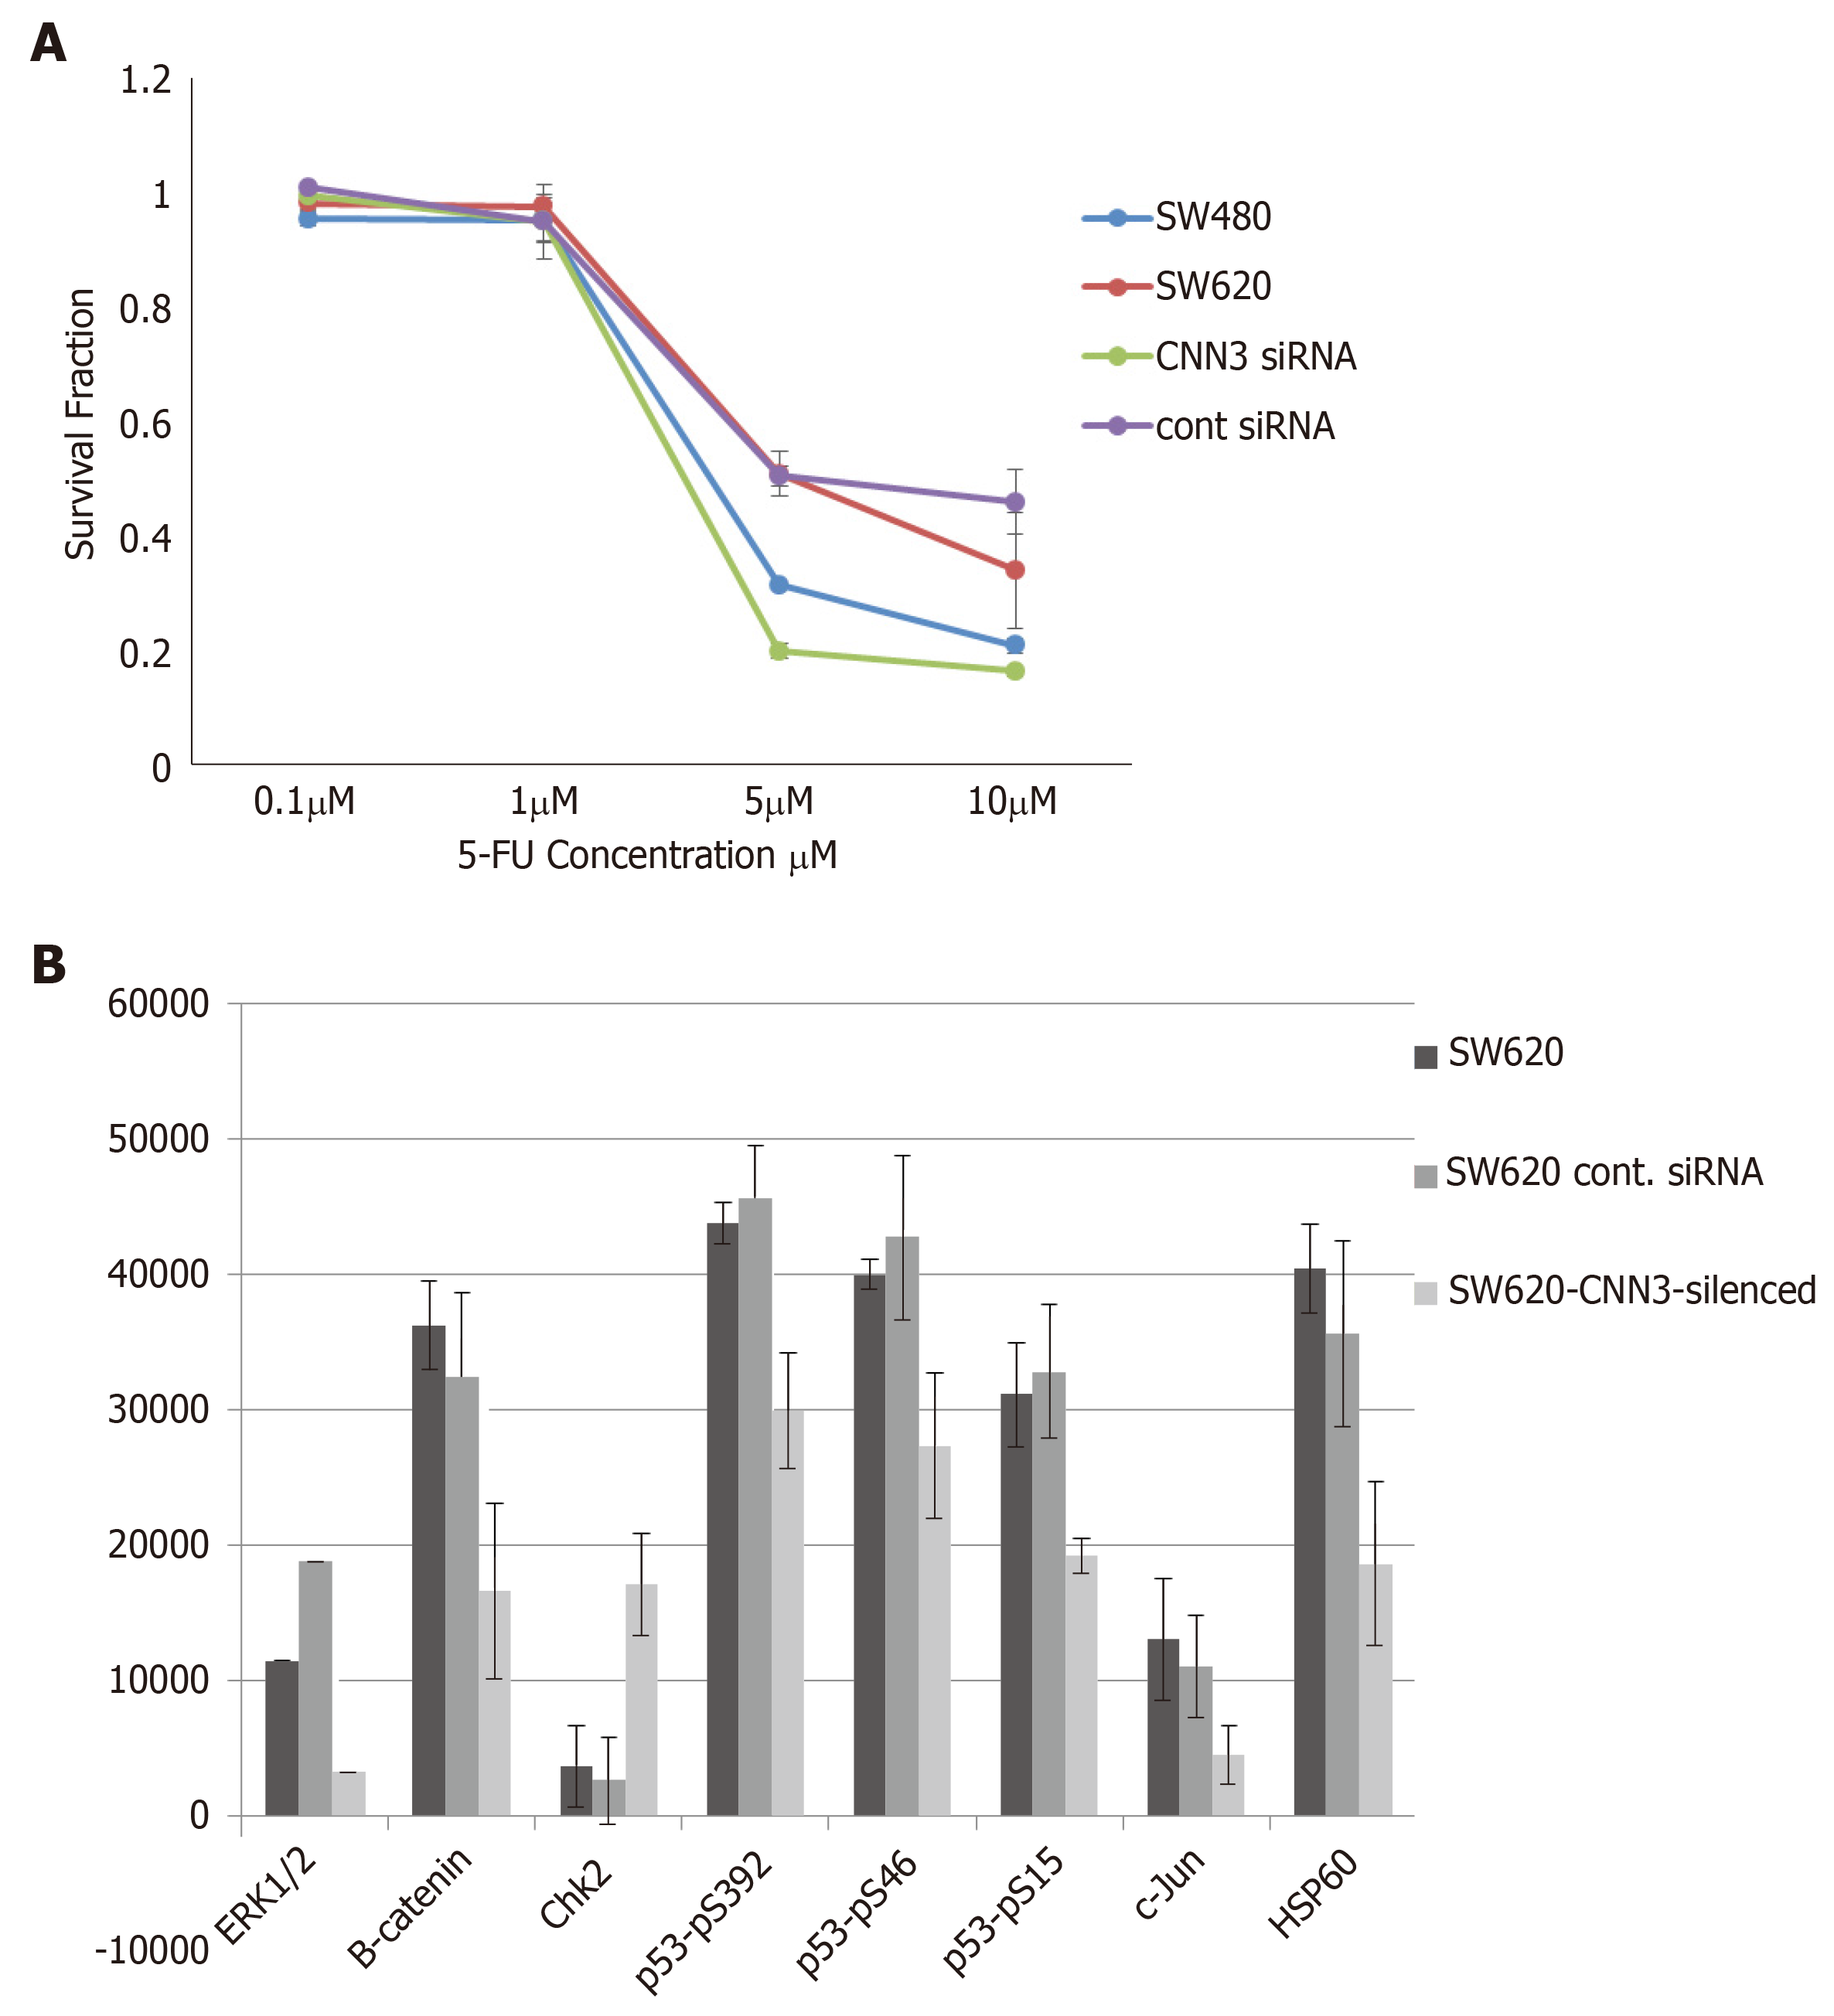
Figure 3 Effects of CNN3 silencing in the SW620 metastatic colon line in response to standard chemotherapeutic 5-fluorouracil and on the proteome profiles of 45 proteins.
A: Response to standard chemotherapeutic 5-fluorouracil; B: Proteome profile changes. Only the consistent/significant changes observed in two repetitions are included in the graph. CNN3: Calponin 3.
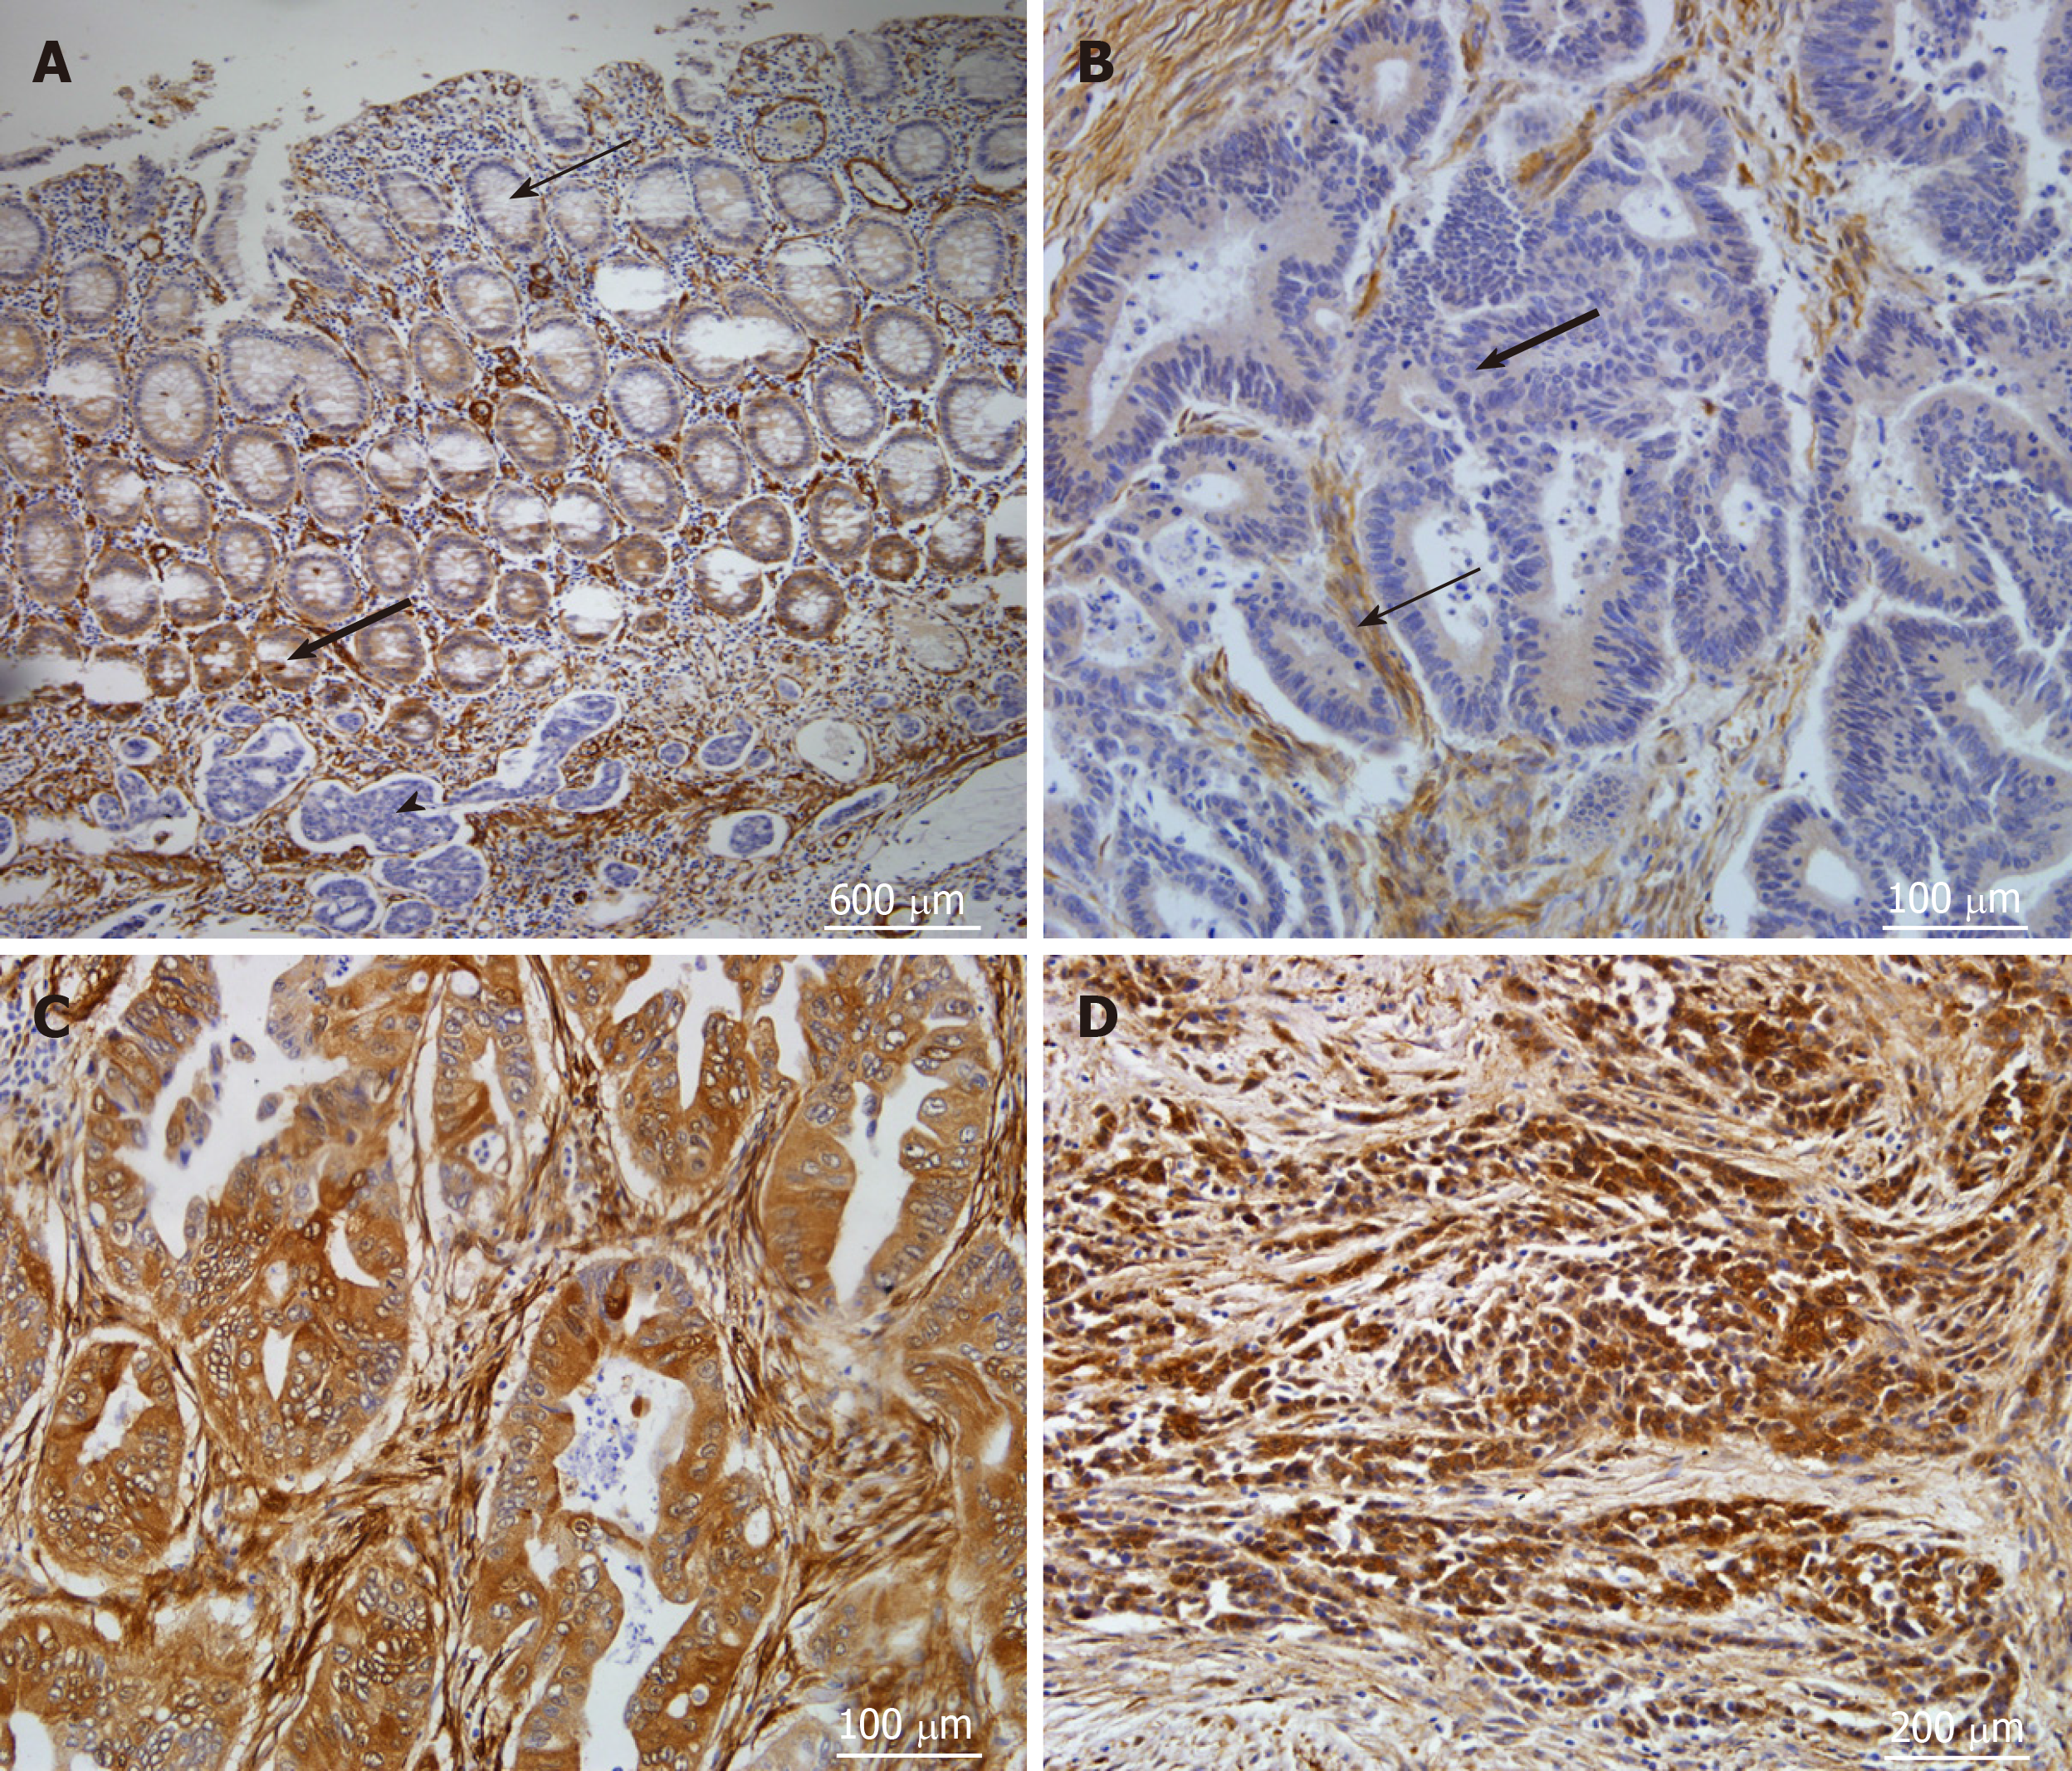
Figure 4 CNN3 expression in formalin-fixed, paraffin-embedded tissues from resected colorectal cancers.
A: The normal mucosa showed positive expression at the crypt bases (thick arrow) and faint to negative expression superficially (thin arrow, Magnification 40×). Note the negative tumor islets below the mucosa (arrow head); B: Well differentiated colon adenocarcinoma showing negative expression of CNN3 (thick arrow) while the stroma showed positive expression (thin arrow) serving as internal positive control (Magnification 200×); C: Well differentiated colon adenocarcinoma showing positive CNN3 expression (Magnification 200×); D: Poorly differentiated rectal adenocarcinoma showing intense positive expression (Magnification 100×). Chromogen, DAB marks the positive expression with brown color; counterstain, Mayer’s hematoxylin. CNN3: Calponin 3.
- Citation: Nair VA, Al-khayyal NA, Sivaperumal S, Abdel-Rahman WM. Calponin 3 promotes invasion and drug resistance of colon cancer cells. World J Gastrointest Oncol 2019; 11(11): 971-982
- URL: https://www.wjgnet.com/1948-5204/full/v11/i11/971.htm
- DOI: https://dx.doi.org/10.4251/wjgo.v11.i11.971


