Copyright
©The Author(s) 2019.
World J Gastrointest Oncol. Jan 15, 2019; 11(1): 48-58
Published online Jan 15, 2019. doi: 10.4251/wjgo.v11.i1.48
Published online Jan 15, 2019. doi: 10.4251/wjgo.v11.i1.48
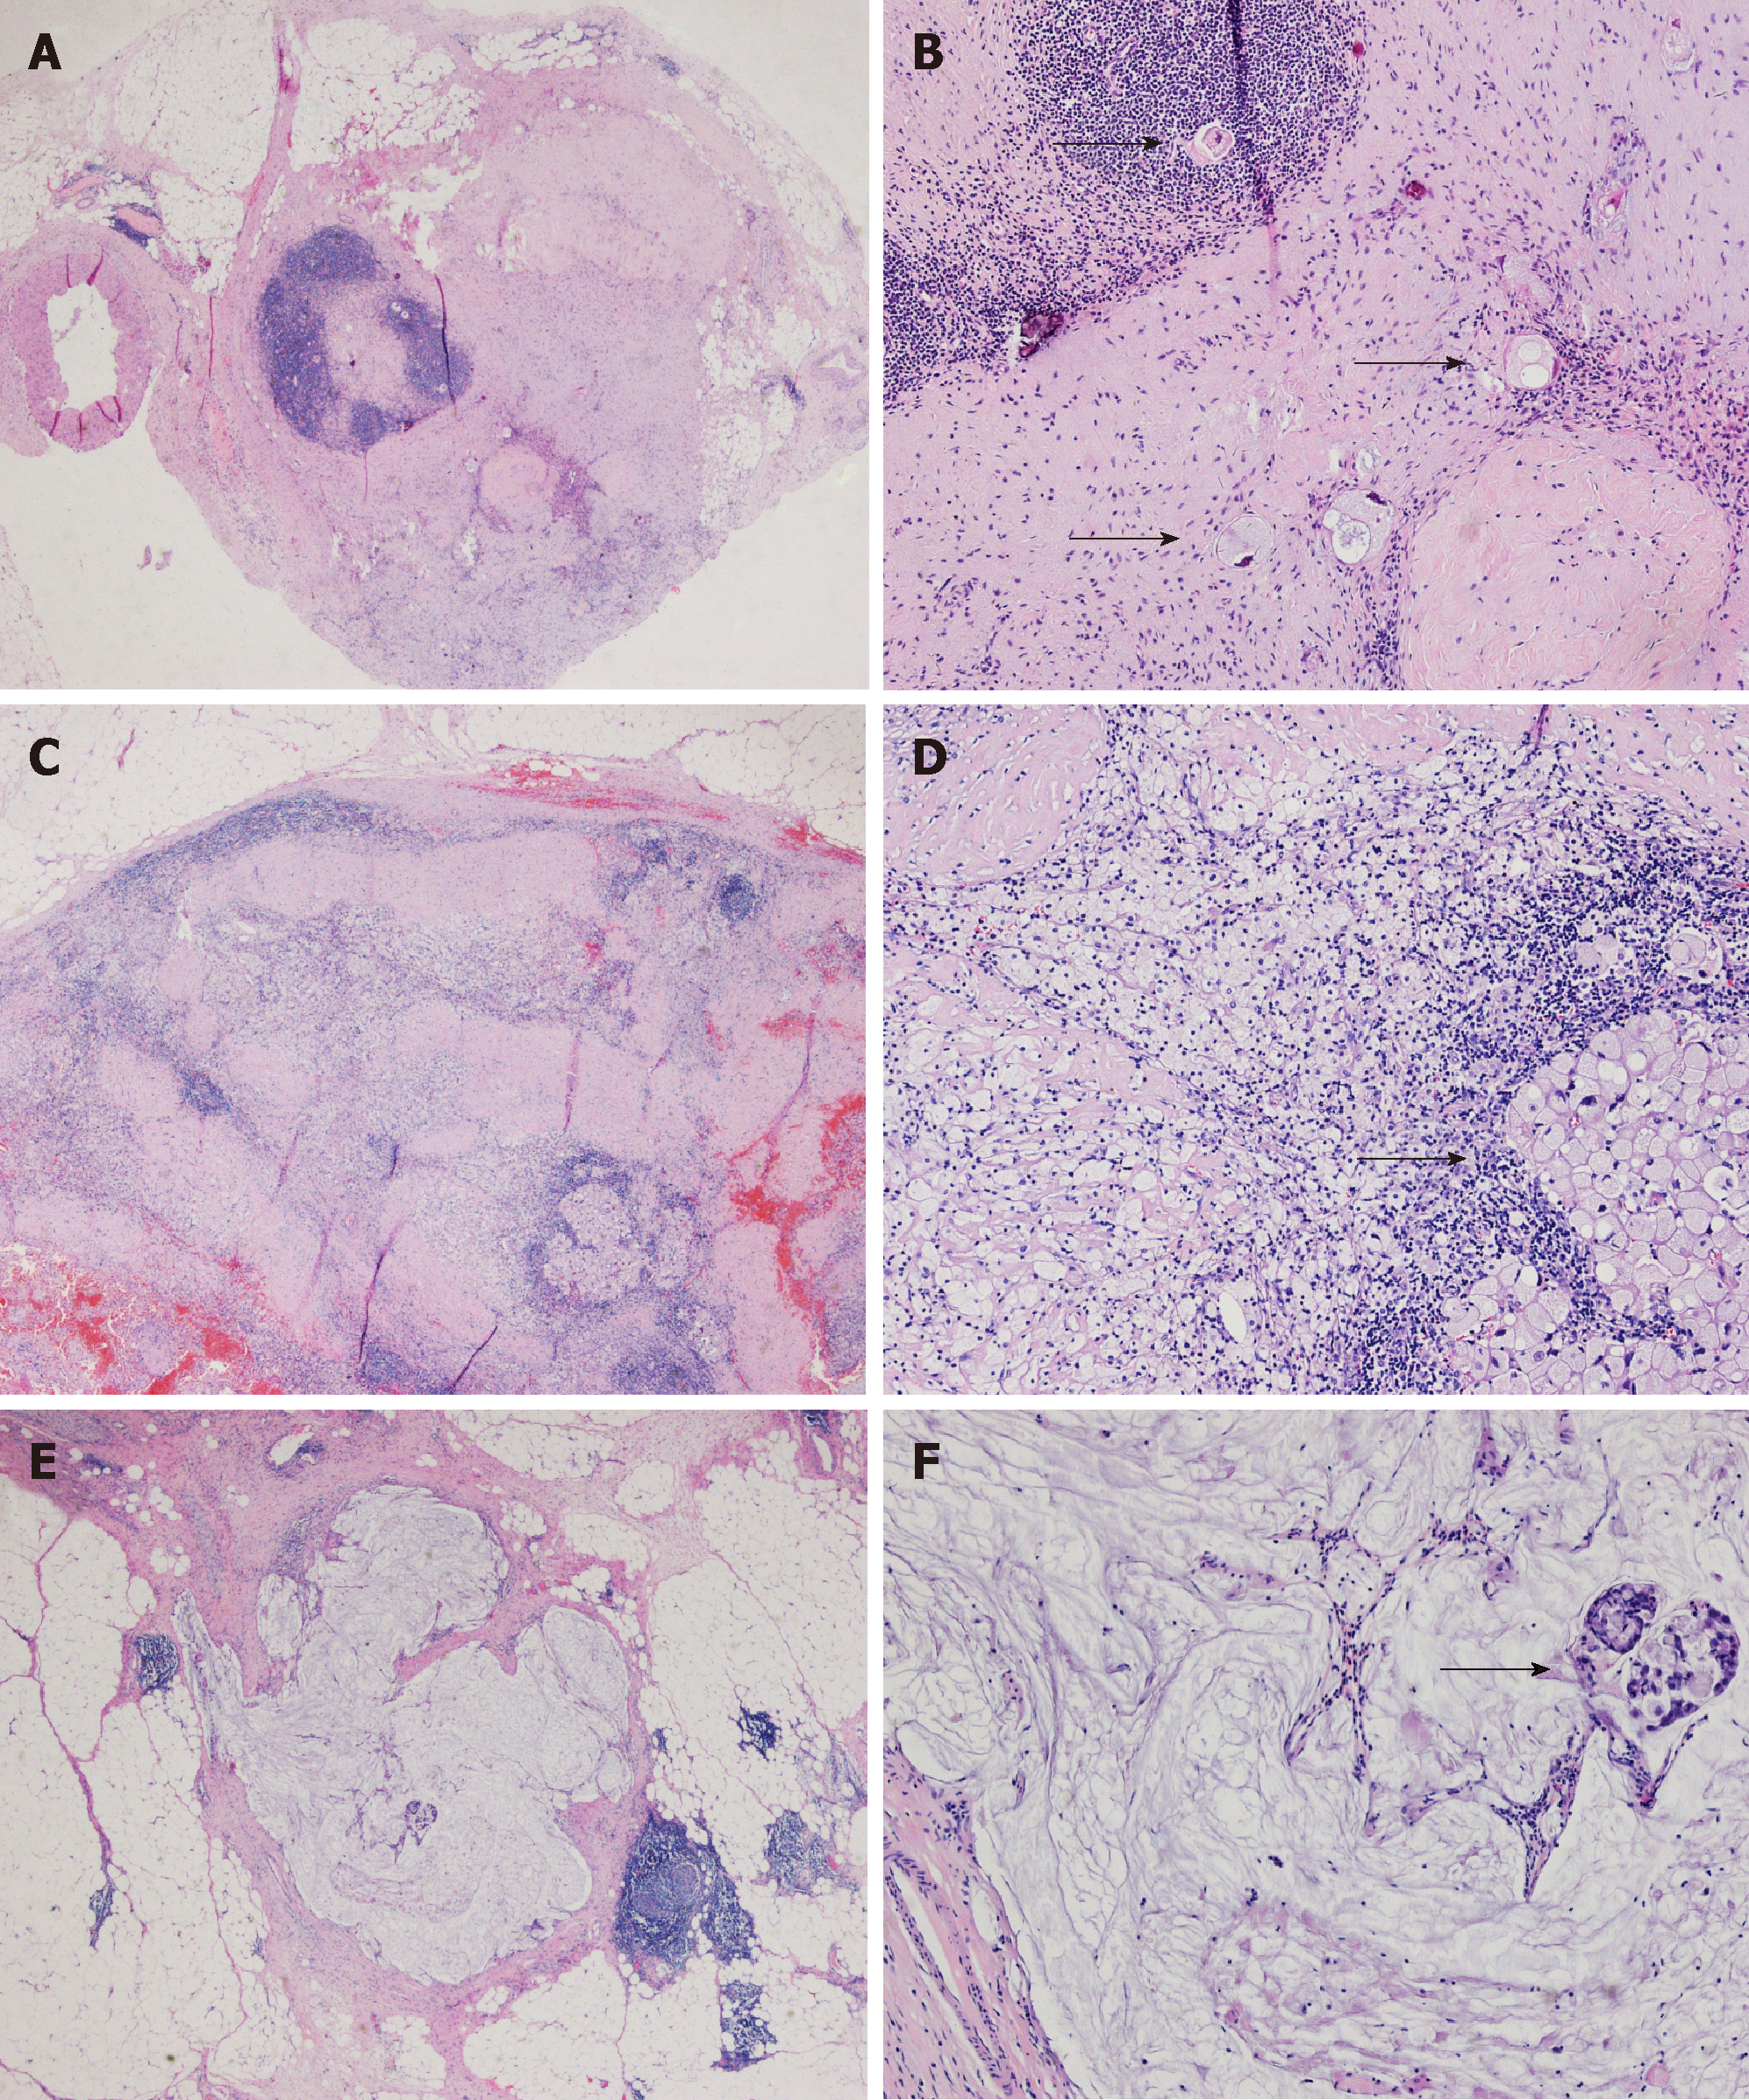
Figure 1 Histological manifestations of LN regression change.
A, B: Fibrosis in LN; C, D: Aggregation of foamy histocytes in LN; E, F: Accumulation of mucin pools in LN (original magnification, 20 × for A, C, E and 100 × for B, D, F). Arrows show residual tumor cells. LN: Lymph node.
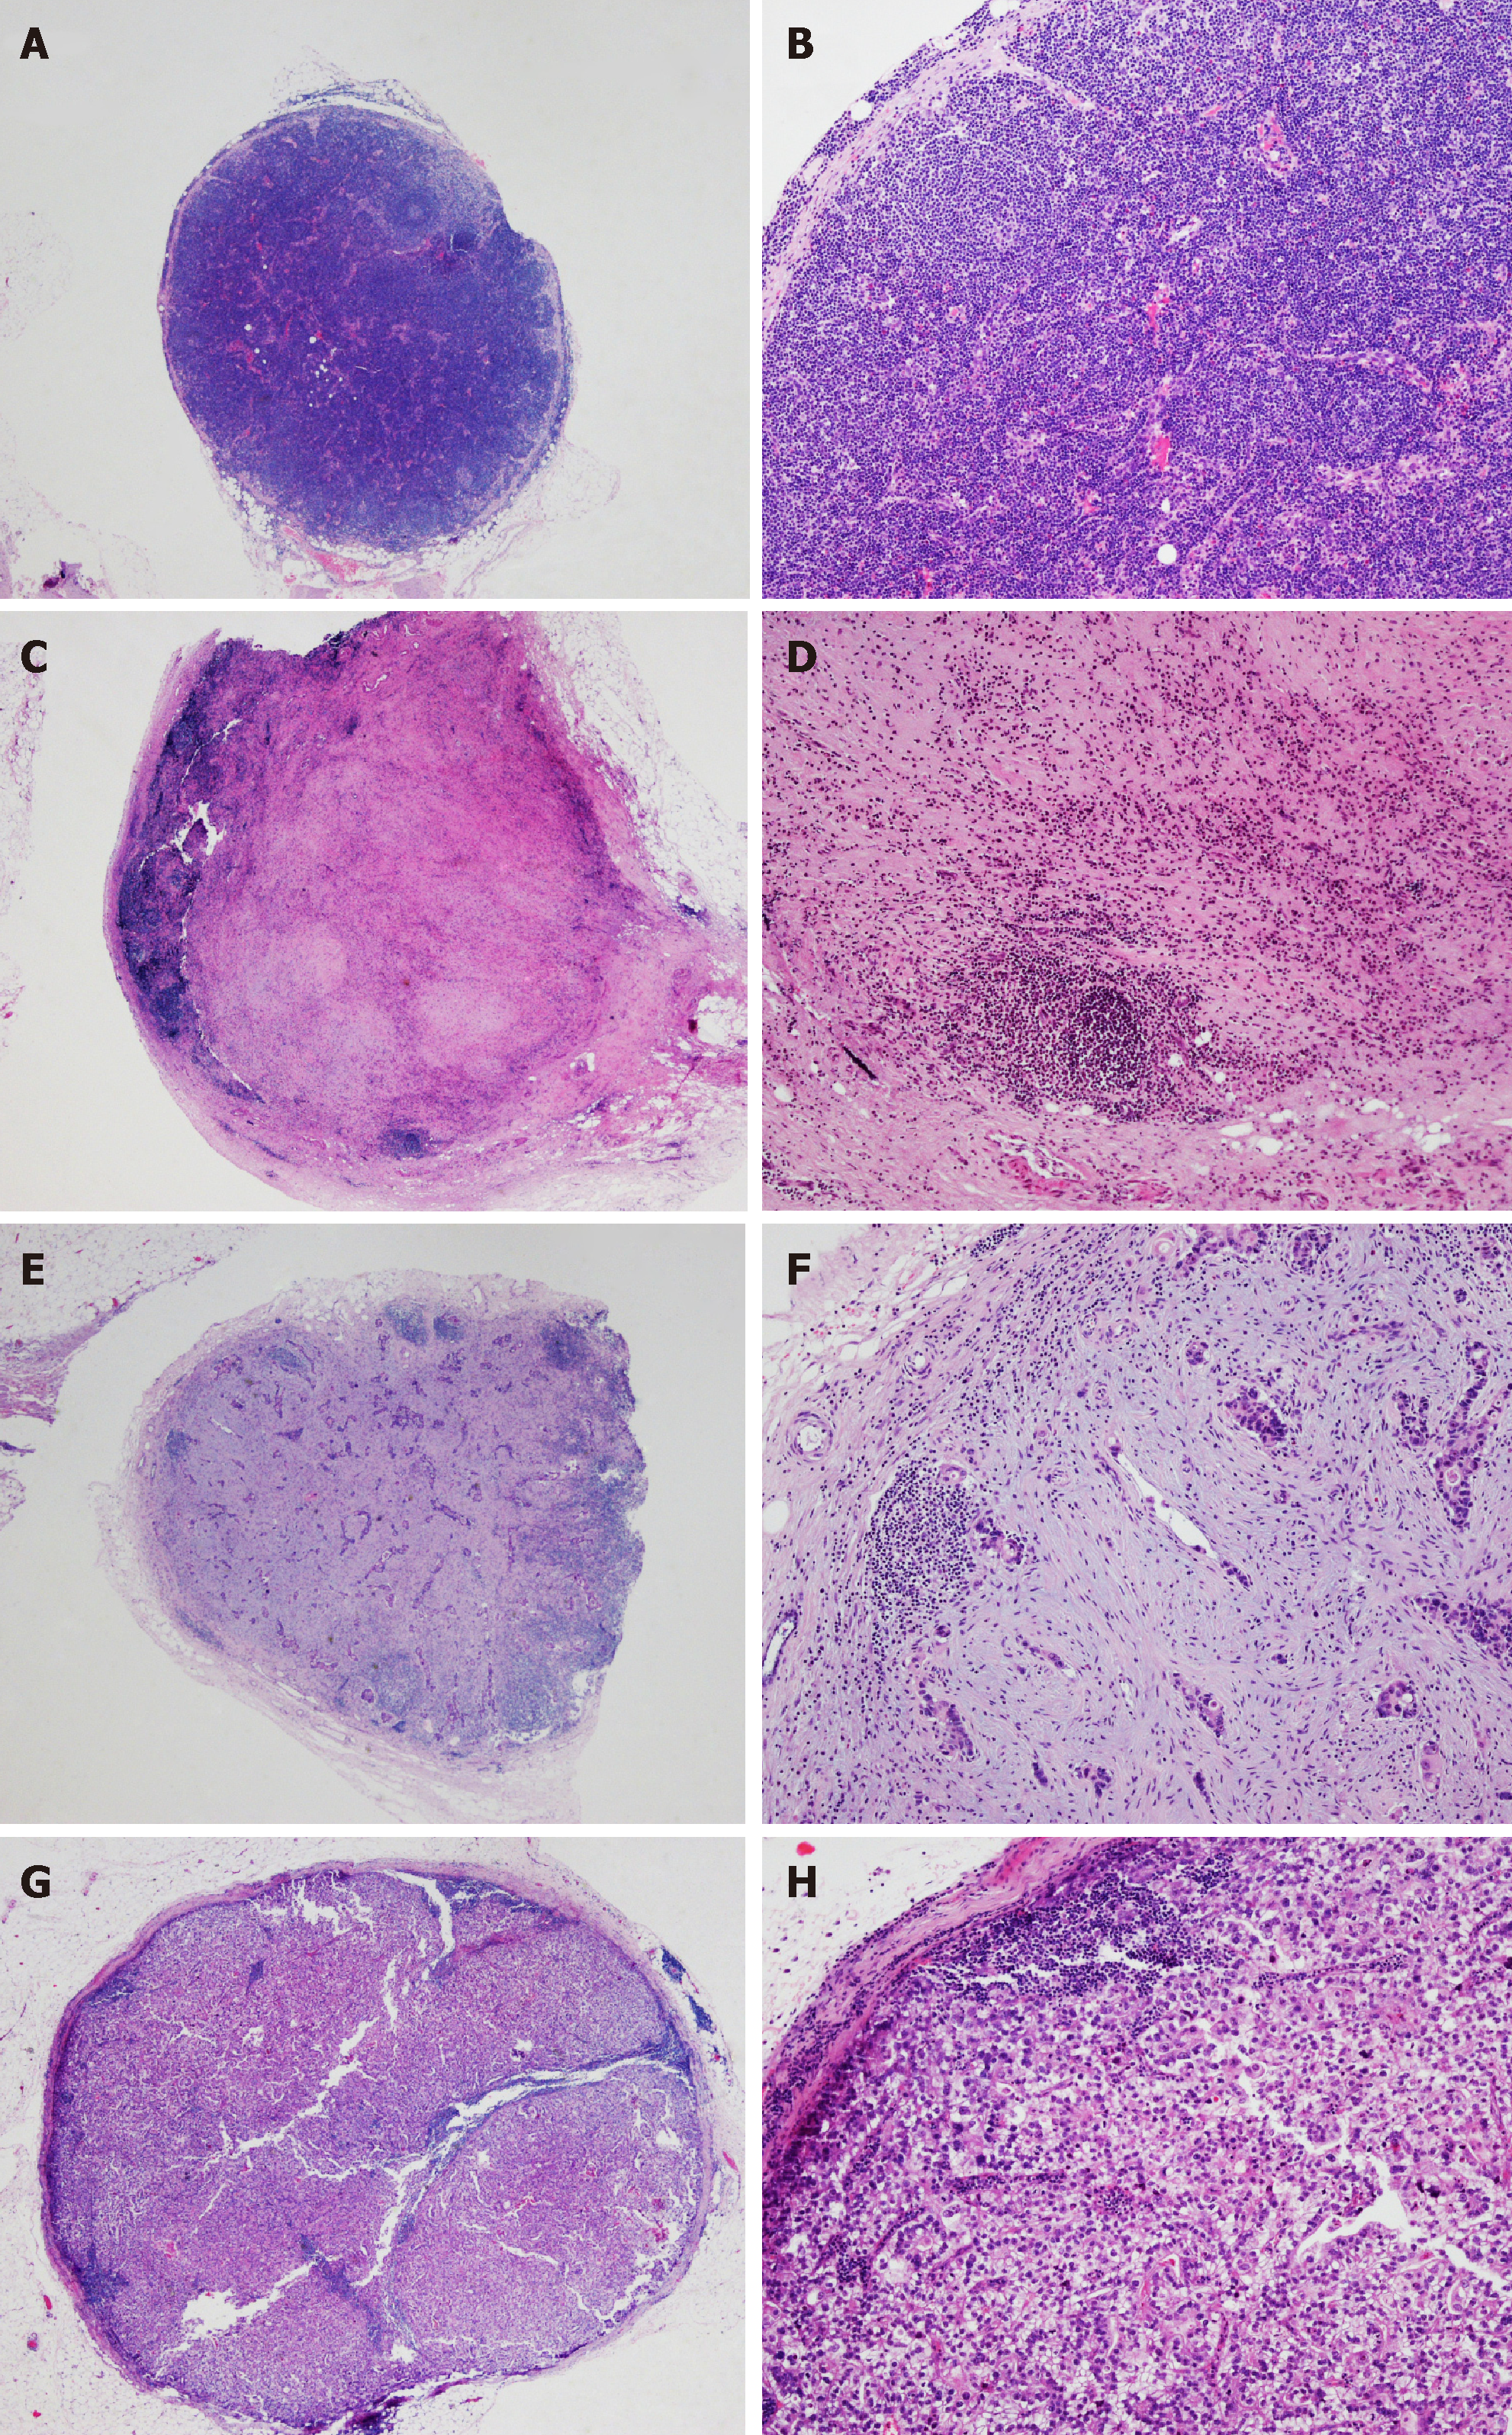
Figure 2 Histological manifestations of four LN regression groups.
A, B: Group A, true negative LNs with no evidence of a preoperative therapy effect; C, D: Group B, no residual metastasis but presence of regression change in LNs; E, F: Group C, residual metastasis with regression change in LNs; G, H: Group D, metastasis with minimal or no regression change in LNs (original magnification, 20 × for A, C, E, G and 100 × for B, D, F, H). LNs: Lymph nodes.
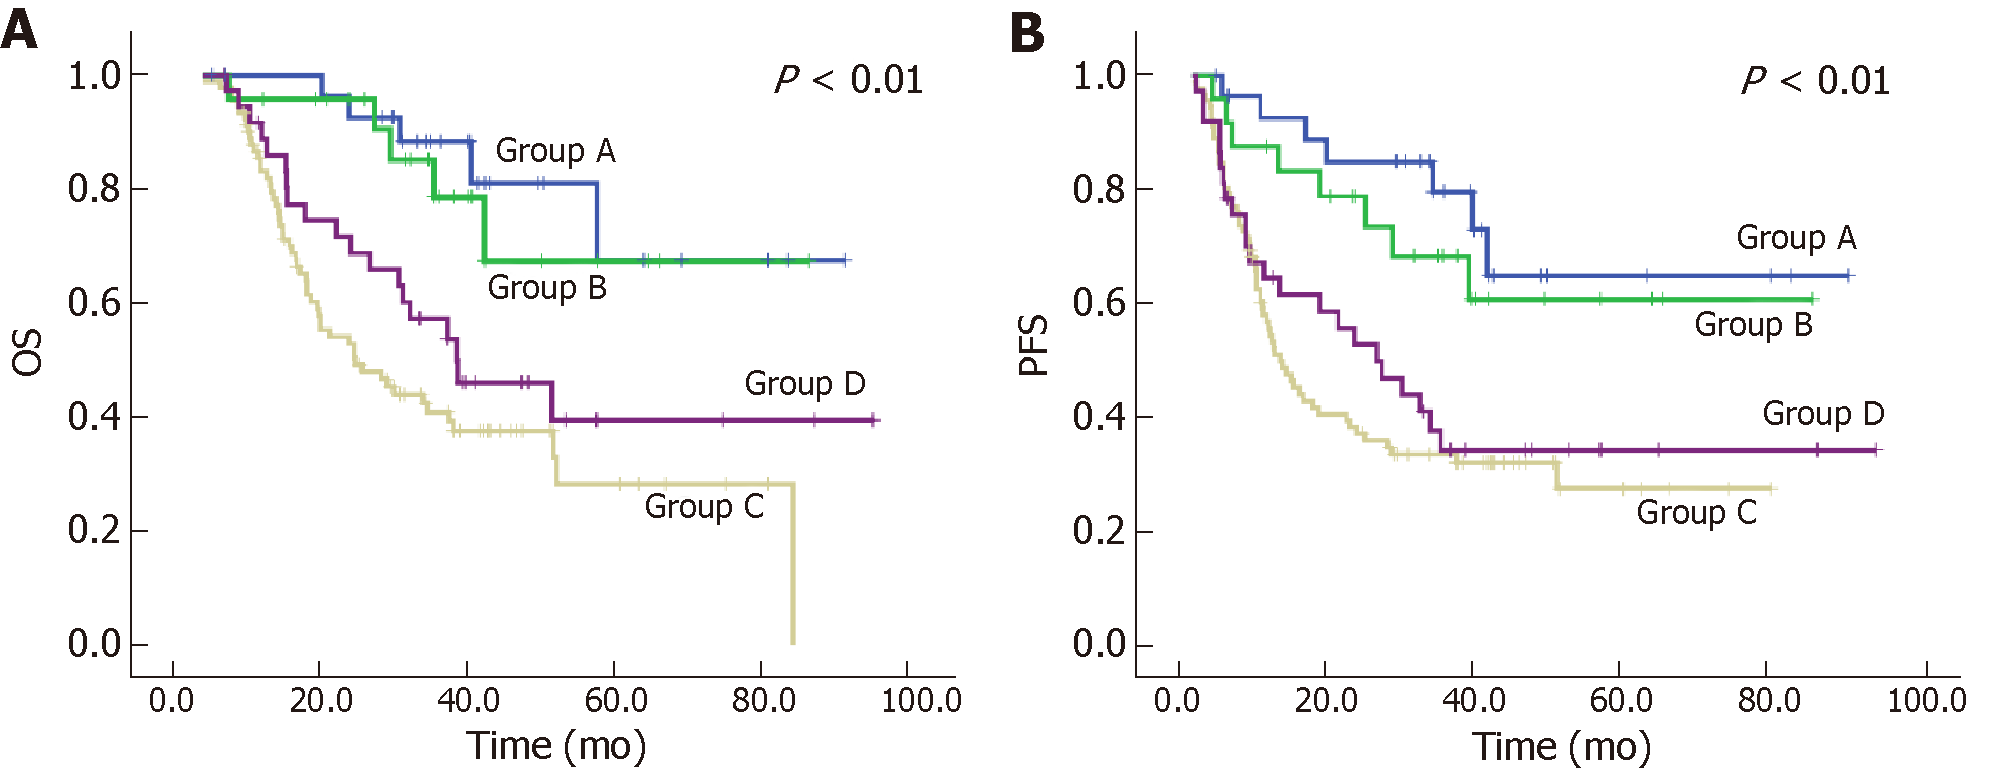
Figure 3 Kaplan-Meier survival analyses.
A: OS curves of patients in Groups A-D; B: PFS curves of patients in Groups A-D. OS: Overall survival; PFS: Progression-free survival.
- Citation: Zhu YL, Sun YK, Xue XM, Yue JY, Yang L, Xue LY. Unnecessity of lymph node regression evaluation for predicting gastric adenocarcinoma outcome after neoadjuvant chemotherapy. World J Gastrointest Oncol 2019; 11(1): 48-58
- URL: https://www.wjgnet.com/1948-5204/full/v11/i1/48.htm
- DOI: https://dx.doi.org/10.4251/wjgo.v11.i1.48


