Copyright
©The Author(s) 2019.
World J Gastrointest Oncol. Jan 15, 2019; 11(1): 1-8
Published online Jan 15, 2019. doi: 10.4251/wjgo.v11.i1.1
Published online Jan 15, 2019. doi: 10.4251/wjgo.v11.i1.1
Figure 1 Plain and enhanced computed tomography.
A: Plain computed tomography indicated low density of VX2 tumor lesion (arrow); B: Enhanced computed tomography indicated significant enhancement of VX2 tumor lesion (arrow).
Figure 2 Comparisons of the spectra of the normal and tumor tissues of the rabbit livers (left) and digital image of a rabbit liver with tumor tissues.
There were 15 spectral lines each for normal and tumor issues. In general, the spectral profiles for the two cases were different at the wavelength of 600-900 nm, but were similar at 1000-1800 nm.
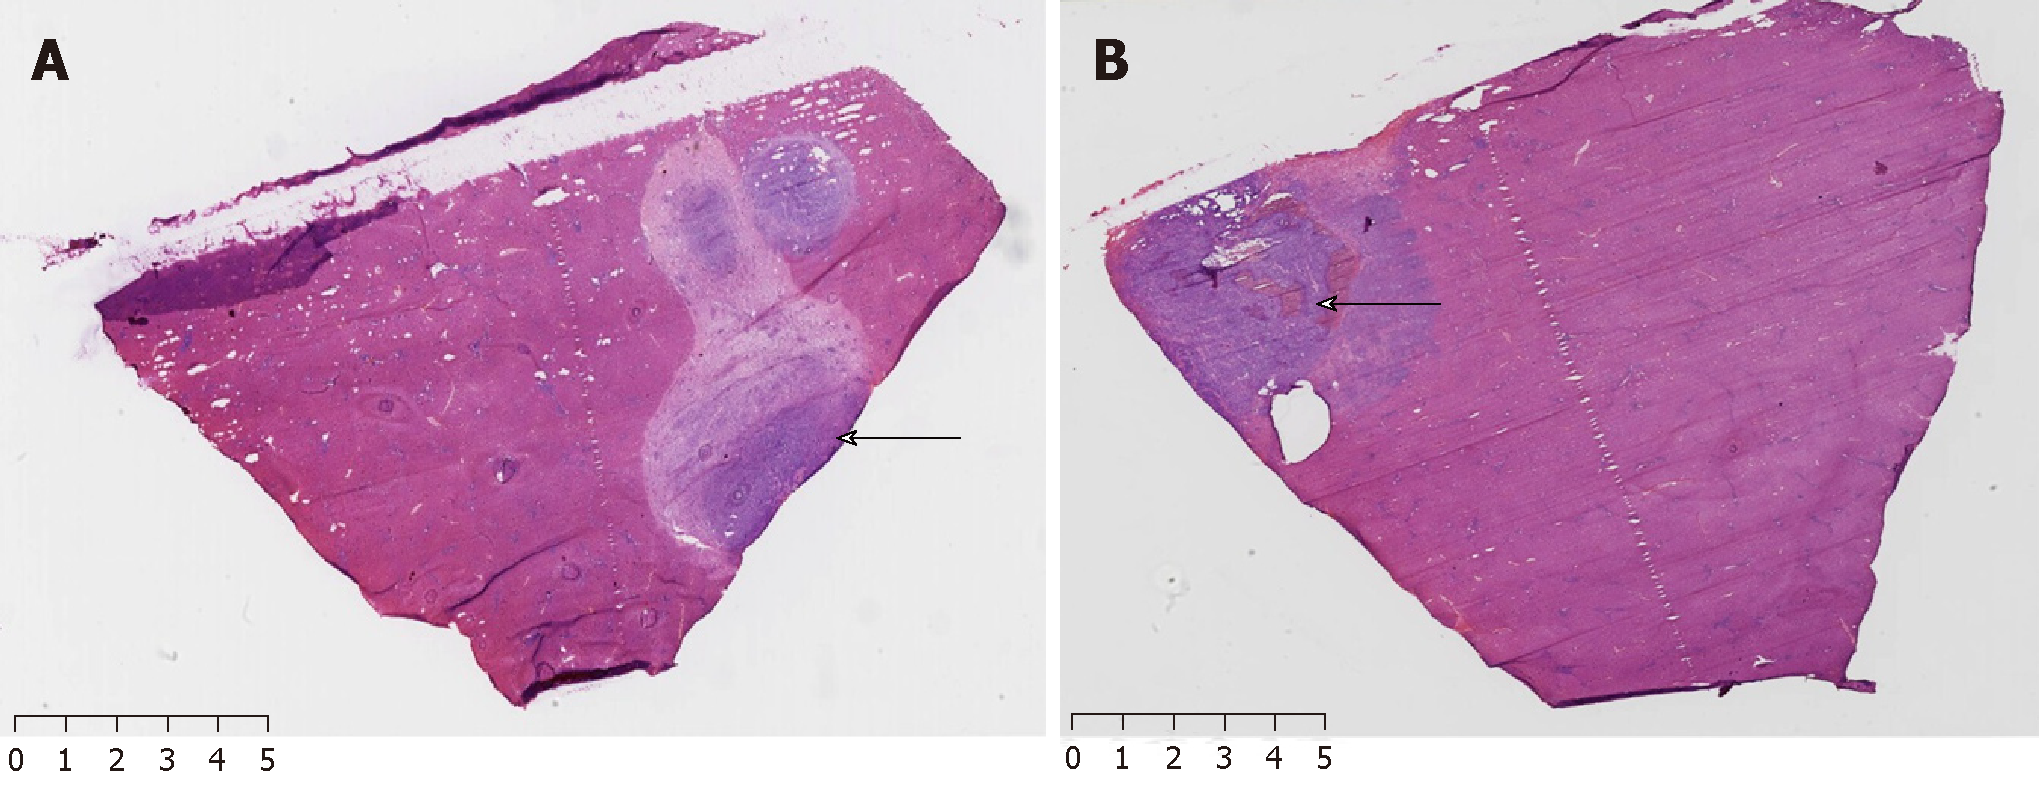
Figure 3 Rabbits were sacrificed following hyperspectral analysis, and VX2 liver tumors were harvest.
A and B: Hematoxylin and eosin staining shows the VX2 tumor lesion in blue (arrows) and normal liver tissue in red.
Figure 4 The reflective spectra of normal and tumor tissues of rabbit liver at waveband of 600-900 nm.
Two absorption peaks at the wavelength of 600-900 nm in normal tissue disappeared but a new reflection peak appeared in the tumor tissue, which is the difference between normal tissue and tumor tissue.
- Citation: Duan F, Yuan J, Liu X, Cui L, Bai YH, Li XH, Xu HR, Liu CY, Yu WX. Feasibility of hyperspectral analysis for discrimination of rabbit liver VX2 tumor. World J Gastrointest Oncol 2019; 11(1): 1-8
- URL: https://www.wjgnet.com/1948-5204/full/v11/i1/1.htm
- DOI: https://dx.doi.org/10.4251/wjgo.v11.i1.1


