Copyright
©The Author(s) 2018.
World J Gastrointest Oncol. Nov 15, 2018; 10(11): 439-448
Published online Nov 15, 2018. doi: 10.4251/wjgo.v10.i11.439
Published online Nov 15, 2018. doi: 10.4251/wjgo.v10.i11.439
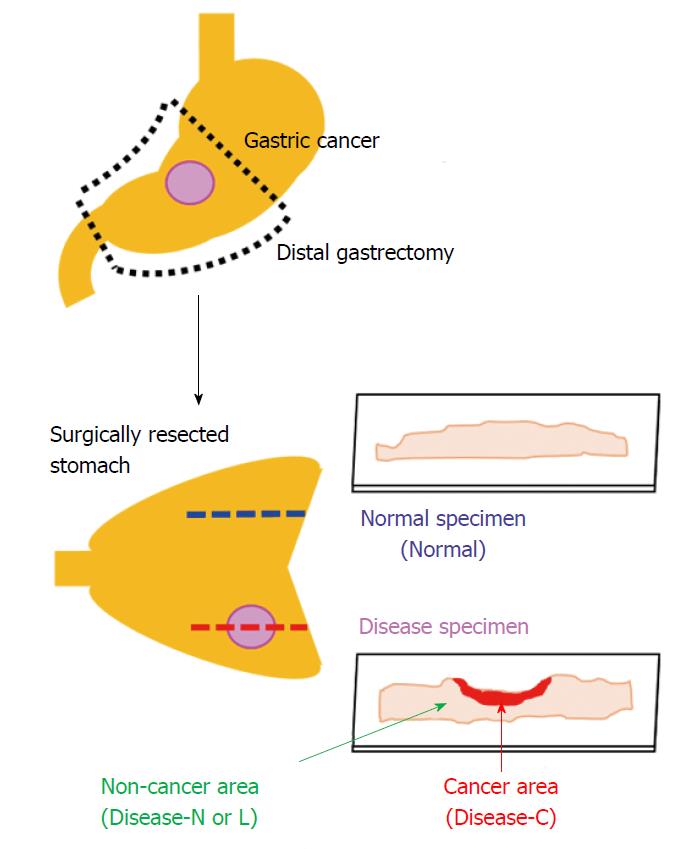
Figure 1 Two consecutive tissue specimens from areas with and without stomach cancer lesions.
Each tissue specimen was sliced to a 3-μm thickness with a microtome and attached to a 1-mm-thick low-autofluorescence slide (SUPER FROST, Matsunami Glass Ind., Ltd, Tokyo, Japan). A thin cover glass (NEO microscope cover glass, Matsunami Glass Ind., Ltd., Tokyo, Japan) was placed on the tissue. Sections were deparaffinized by sequential immersion in xylene, ethanol, and water. One of the two tissue specimens was stained with hematoxylin and eosin and used as a reference for laser irradiation positioning by the spectroscopic method. Another tissue specimen was left unstained and used for analysis by Raman spectroscopy. We acquired the Raman spectrum of the cancer area (Disease-C), non-cancerous lymphocytes infiltration area (Disease-L), non-cancerous normal area (Disease-N) in the stomach cancer specimen, and normal stomach tissue specimen (Normal).
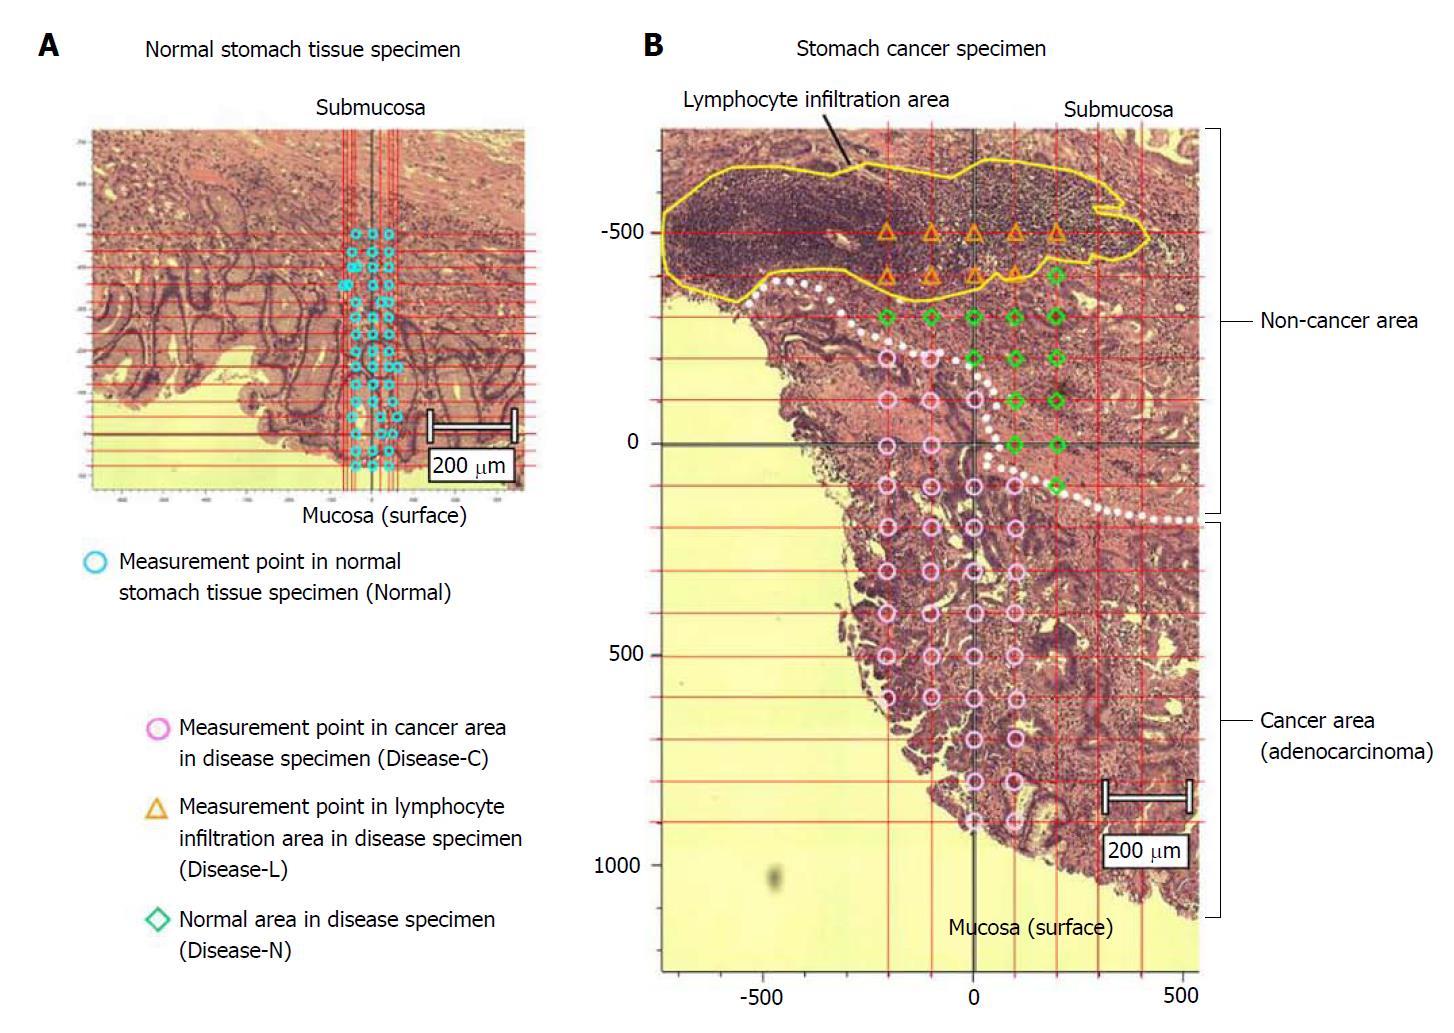
Figure 2 Measured points in the stomach cancer and normal tissue specimens.
A: Normal stomach tissue specimen; B: Stomach cancer specimen. We established the conditions for laser output and laser irradiation time on a marginal part of an unstained tissue specimen that included both gastric cancer lesion and non-lesion areas. To prevent tissue degeneration, we reduced the laser power as much as possible, while maintaining detection of the Raman spectrum. Optimal measurement conditions were established as a laser output of 1.7 mW and an irradiation time of 10 s. We measured the tissue specimens at regular intervals from the mucous membrane to the submucosal layer.
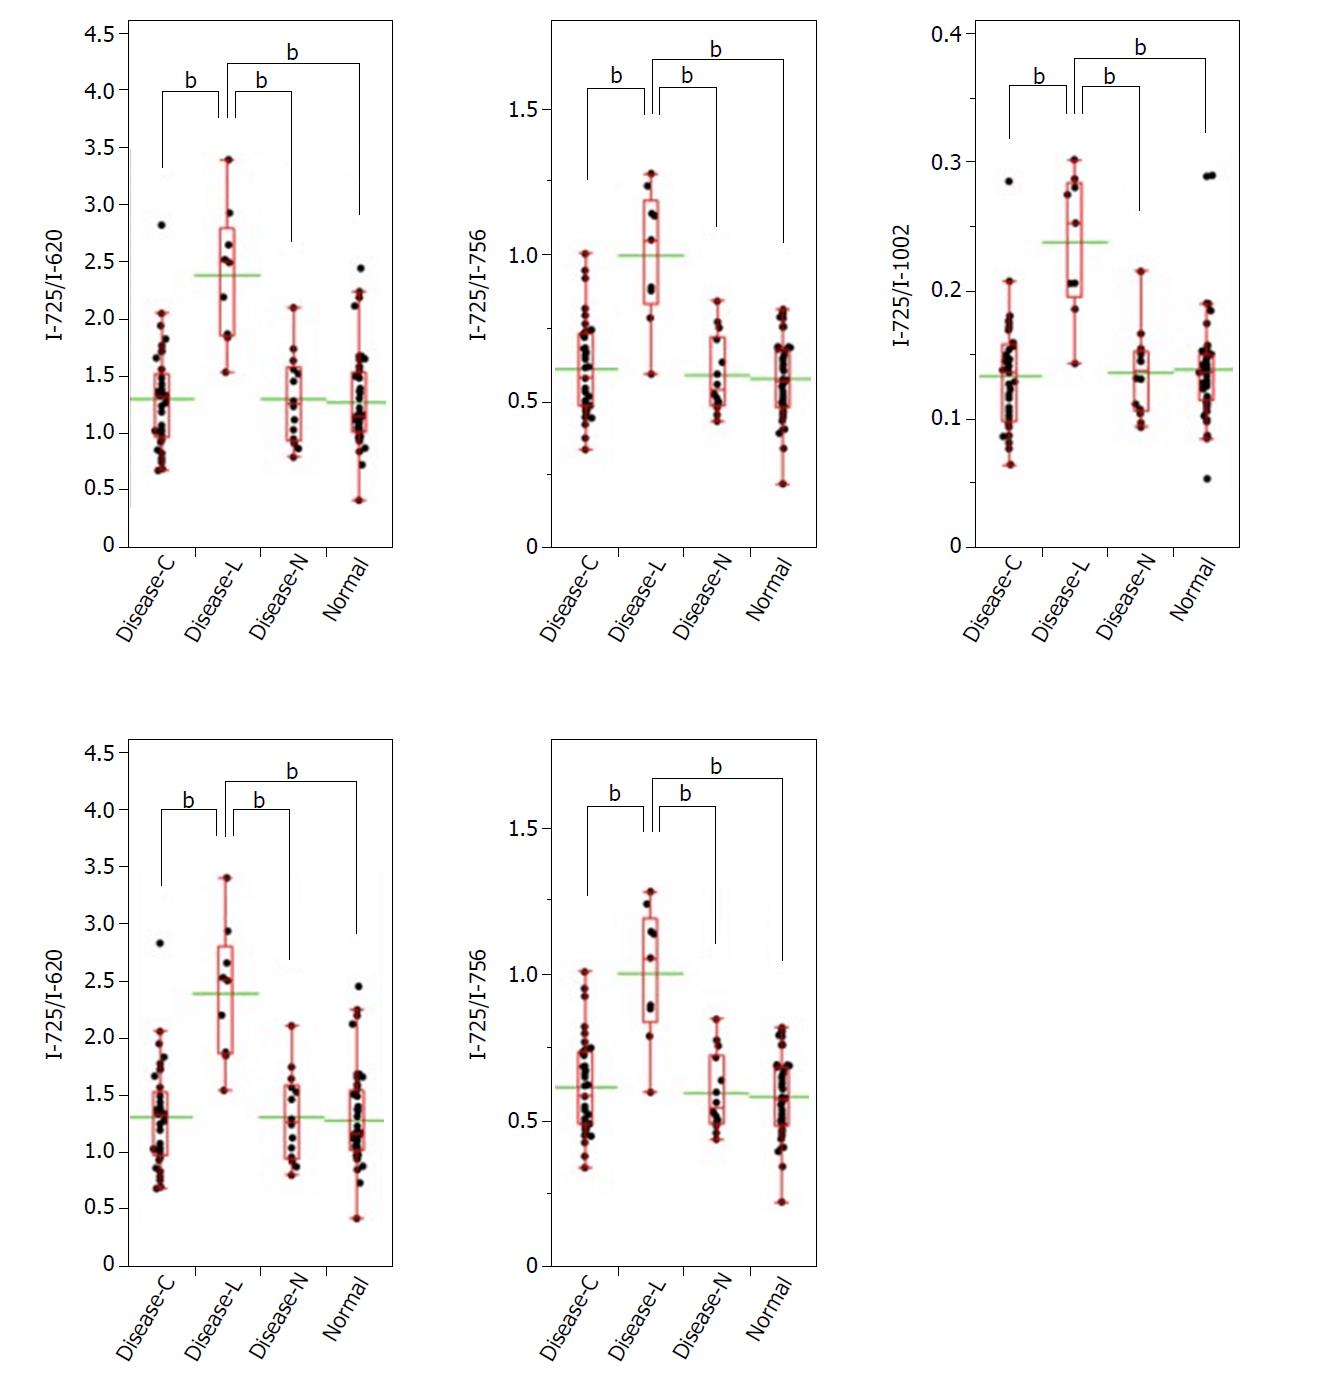
Figure 3 Raman scattering intensity ratio with intensity of wavenumber 725 cm-1 as the denominator.
Dots indicate the ratio of Raman scattering intensity in each tissue specimen of the patient. The bottom and top of the red box represent the lower and upper quartiles, and the band across the box shows the median. The lower and upper bars at the ends of the whiskers show the lowest data point within the 1.5 interquartile range of the lower quartile, and the highest data point within the 1.5 interquartile range of the upper quartile, respectively. The green bar shows the average. aP < 0.05, bP < 0.01.
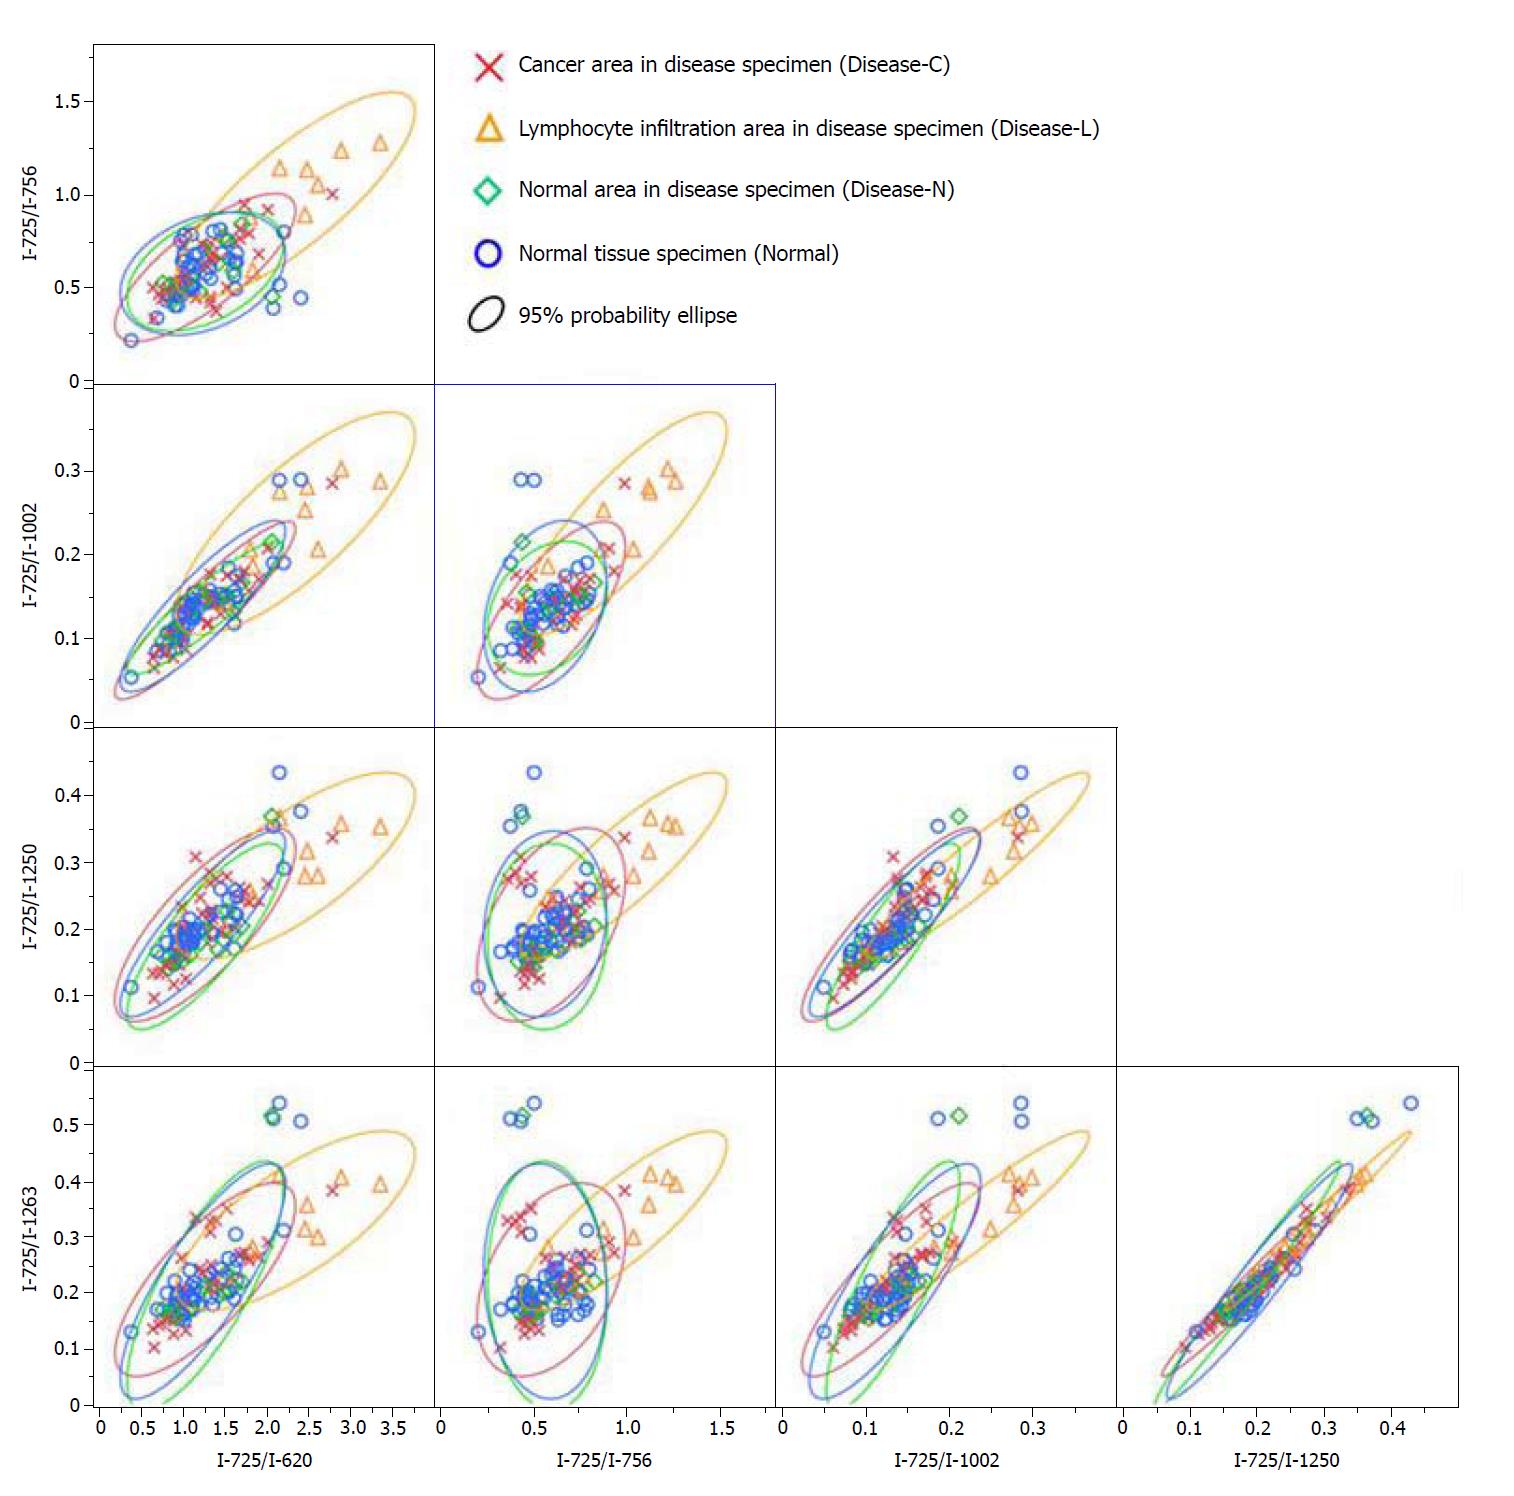
Figure 4 Biaxial distribution of the Raman scattering intensity ratio with the intensity of wavenumber 725 cm-1 as the denominator.
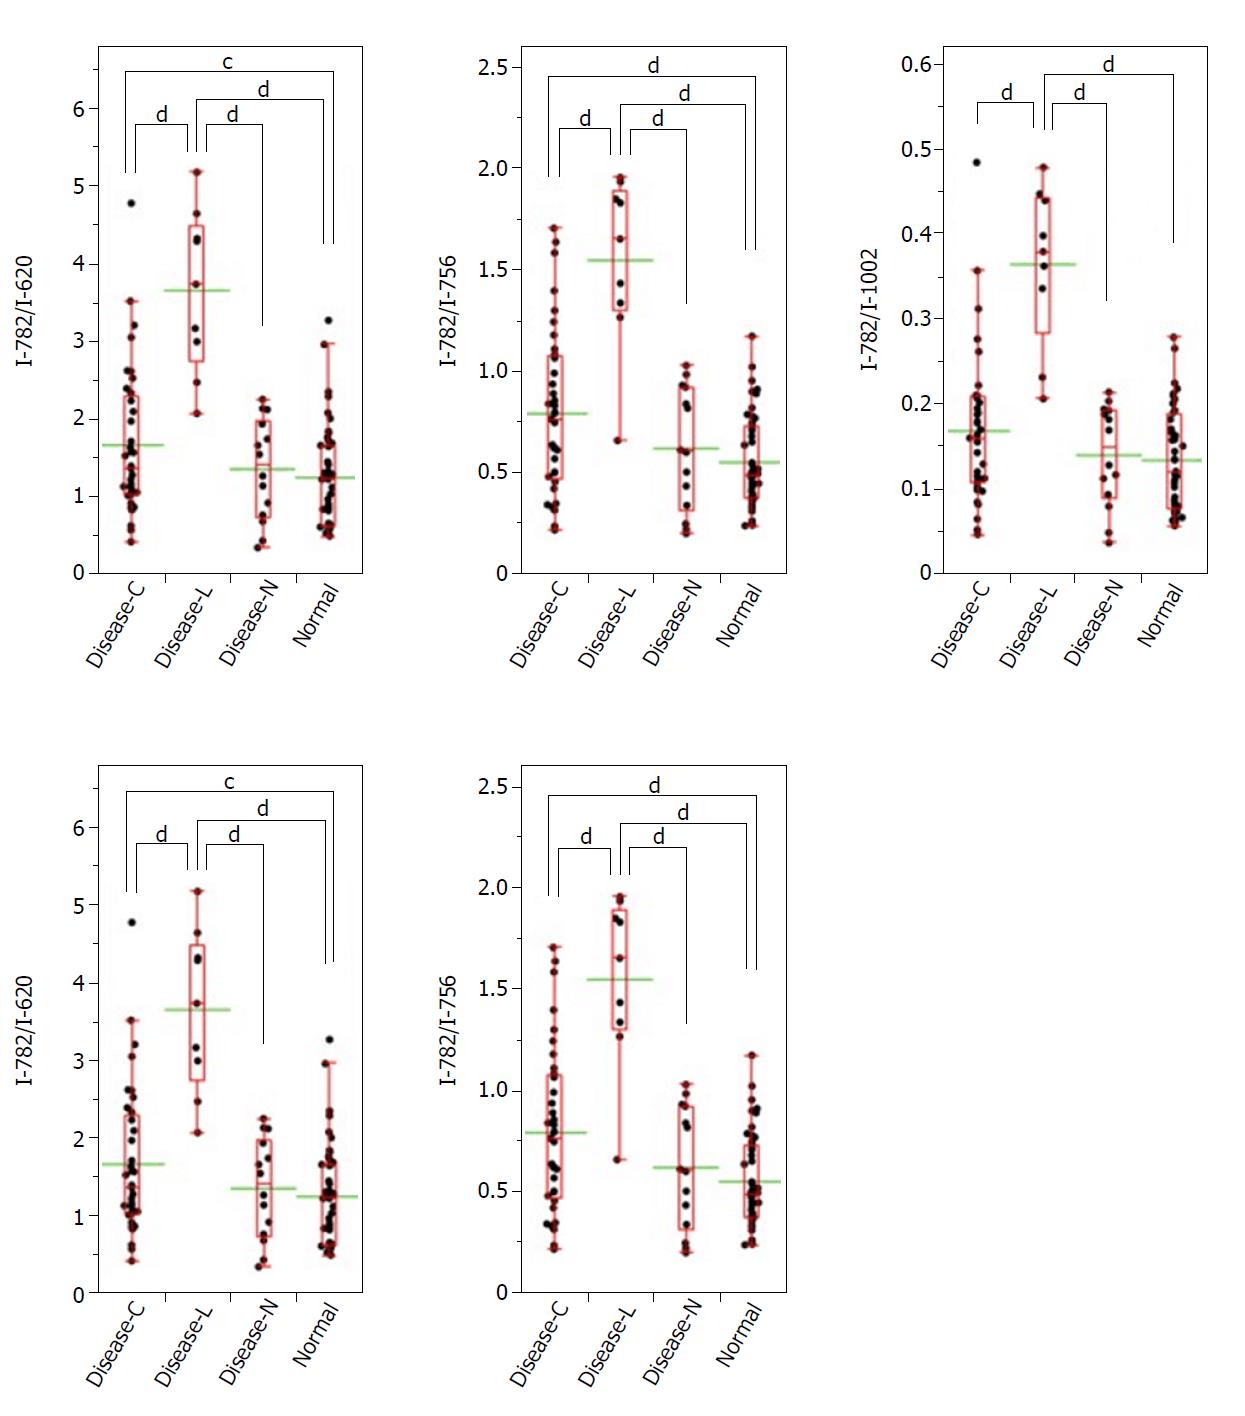
Figure 5 Raman scattering intensity ratio with the intensity of wavenumber 782 cm-1 as the denominator.
Dots indicate the ratio of the Raman scattering intensity in each tissue specimen of the patient. The bottom and top of the red box represent the lower and upper quartiles, and the band across the box shows the median. The lower and upper bars at the ends of the whiskers show the lowest data point within the 1.5 interquartile range of the lower quartile, and the highest data point within the 1.5 interquartile range of the upper quartile, respectively. The green bar shows the average. cP < 0.05, dP < 0.01.
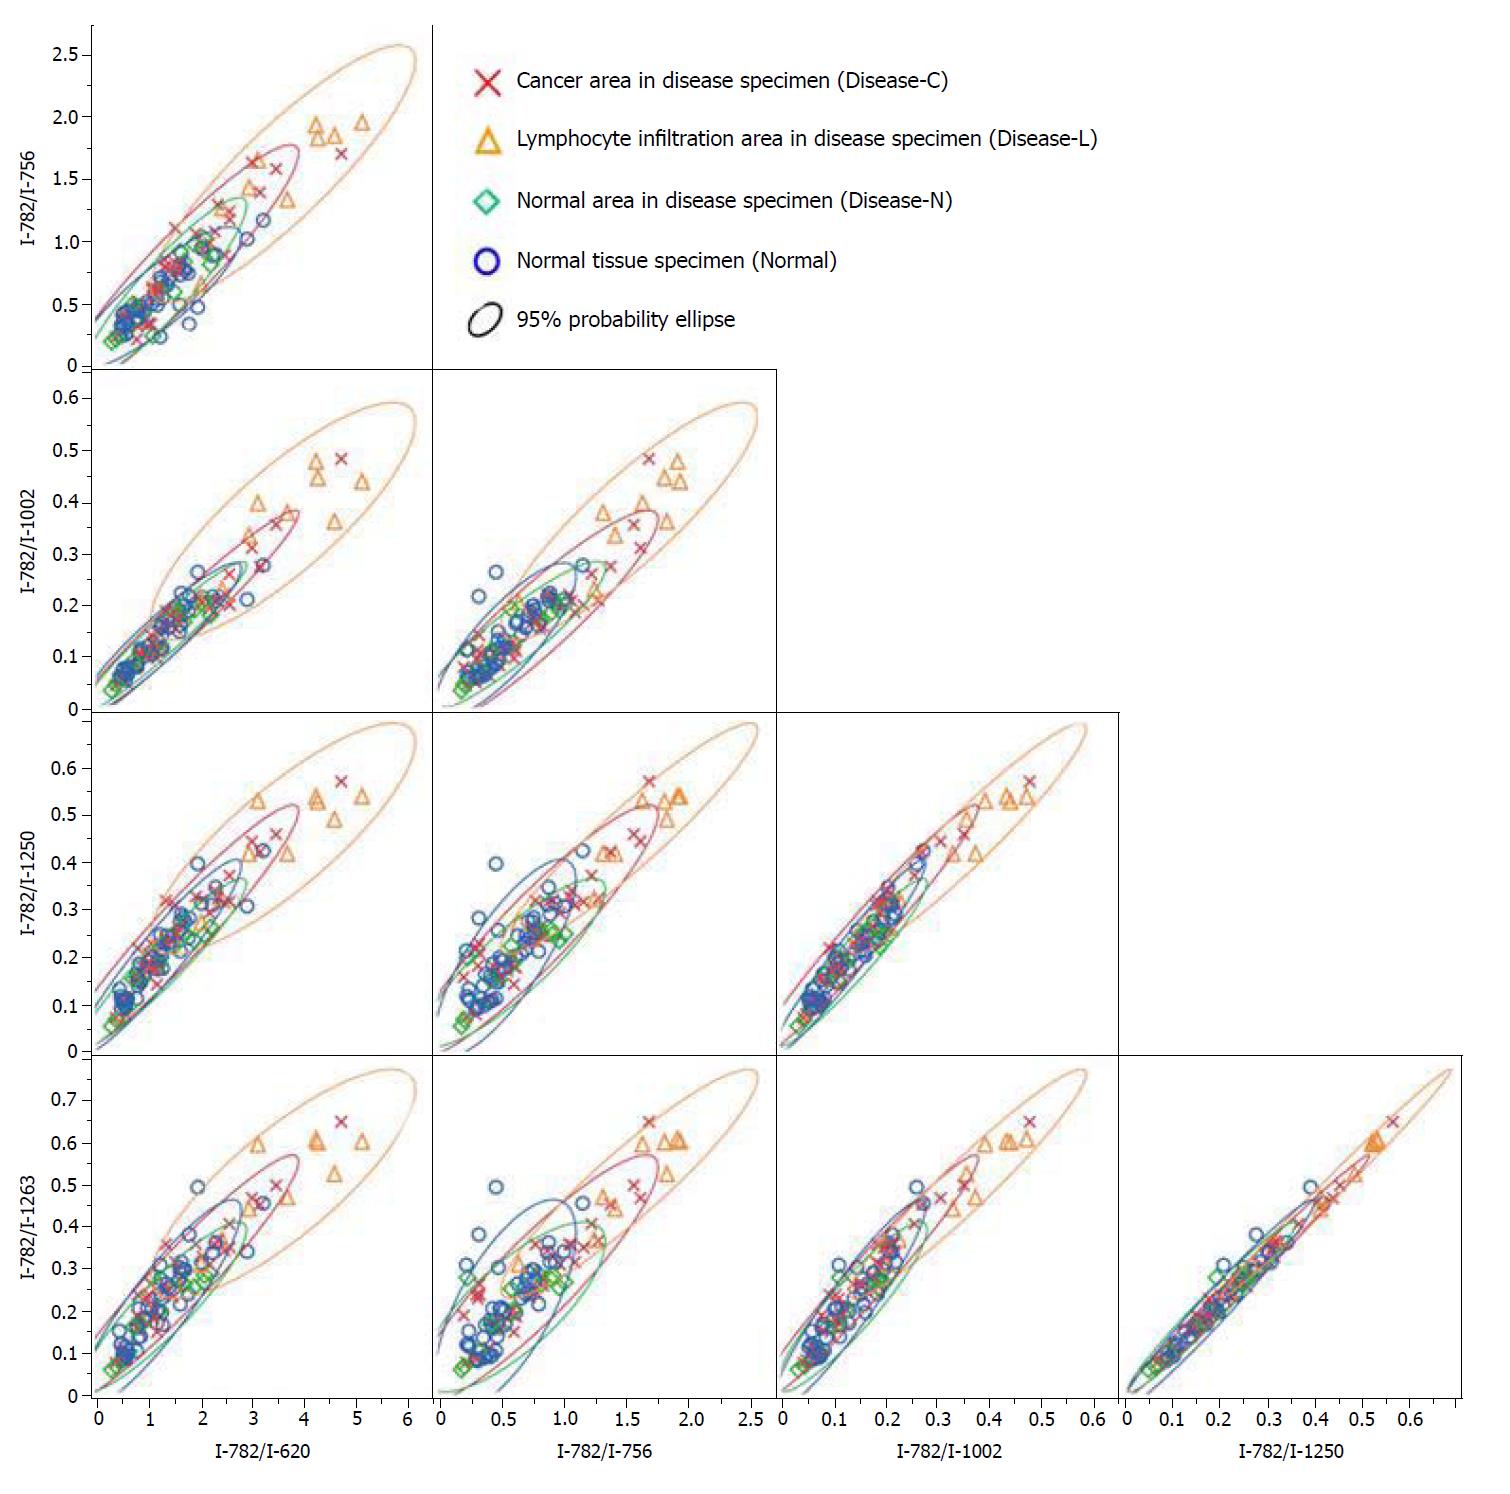
Figure 6 Biaxial distribution of the Raman scattering intensity ratio with intensity of wavenumber 782 cm-1 as the denominator.
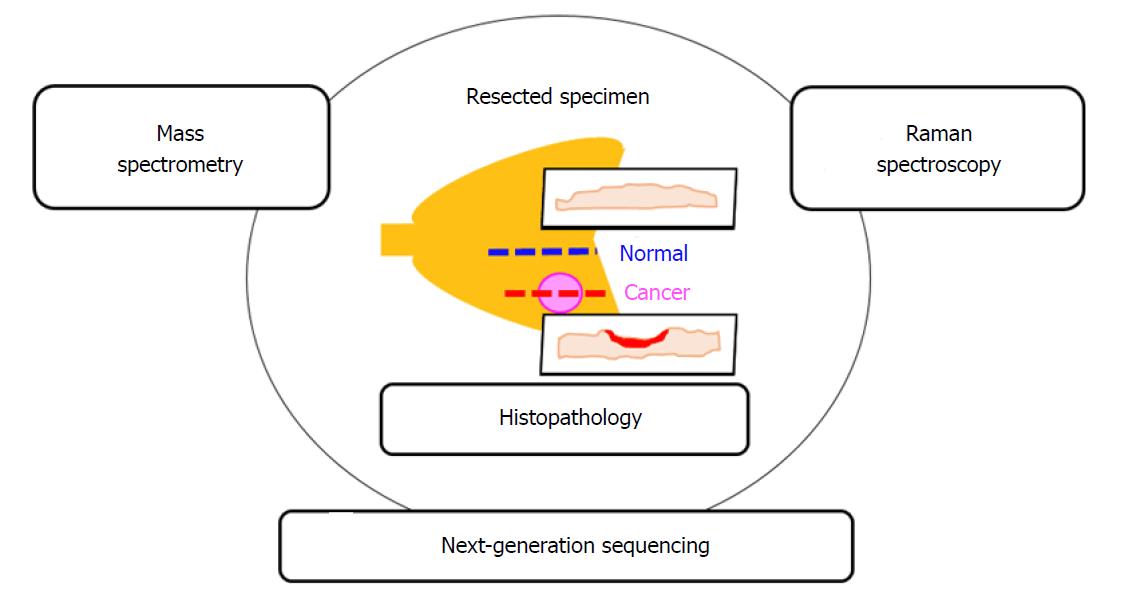
Figure 7 Schematic representation of potential histopathological diagnosis using Raman scattering spectroscopy, next-generation sequencing, and mass spectrometry for realizing a more accurate cancer diagnosis.
- Citation: Ikeda H, Ito H, Hikita M, Yamaguchi N, Uragami N, Yokoyama N, Hirota Y, Kushima M, Ajioka Y, Inoue H. Raman spectroscopy for the diagnosis of unlabeled and unstained histopathological tissue specimens. World J Gastrointest Oncol 2018; 10(11): 439-448
- URL: https://www.wjgnet.com/1948-5204/full/v10/i11/439.htm
- DOI: https://dx.doi.org/10.4251/wjgo.v10.i11.439


