Copyright
©The Author(s) 2024.
World J Hepatol. Jun 27, 2024; 16(6): 920-931
Published online Jun 27, 2024. doi: 10.4254/wjh.v16.i6.920
Published online Jun 27, 2024. doi: 10.4254/wjh.v16.i6.920
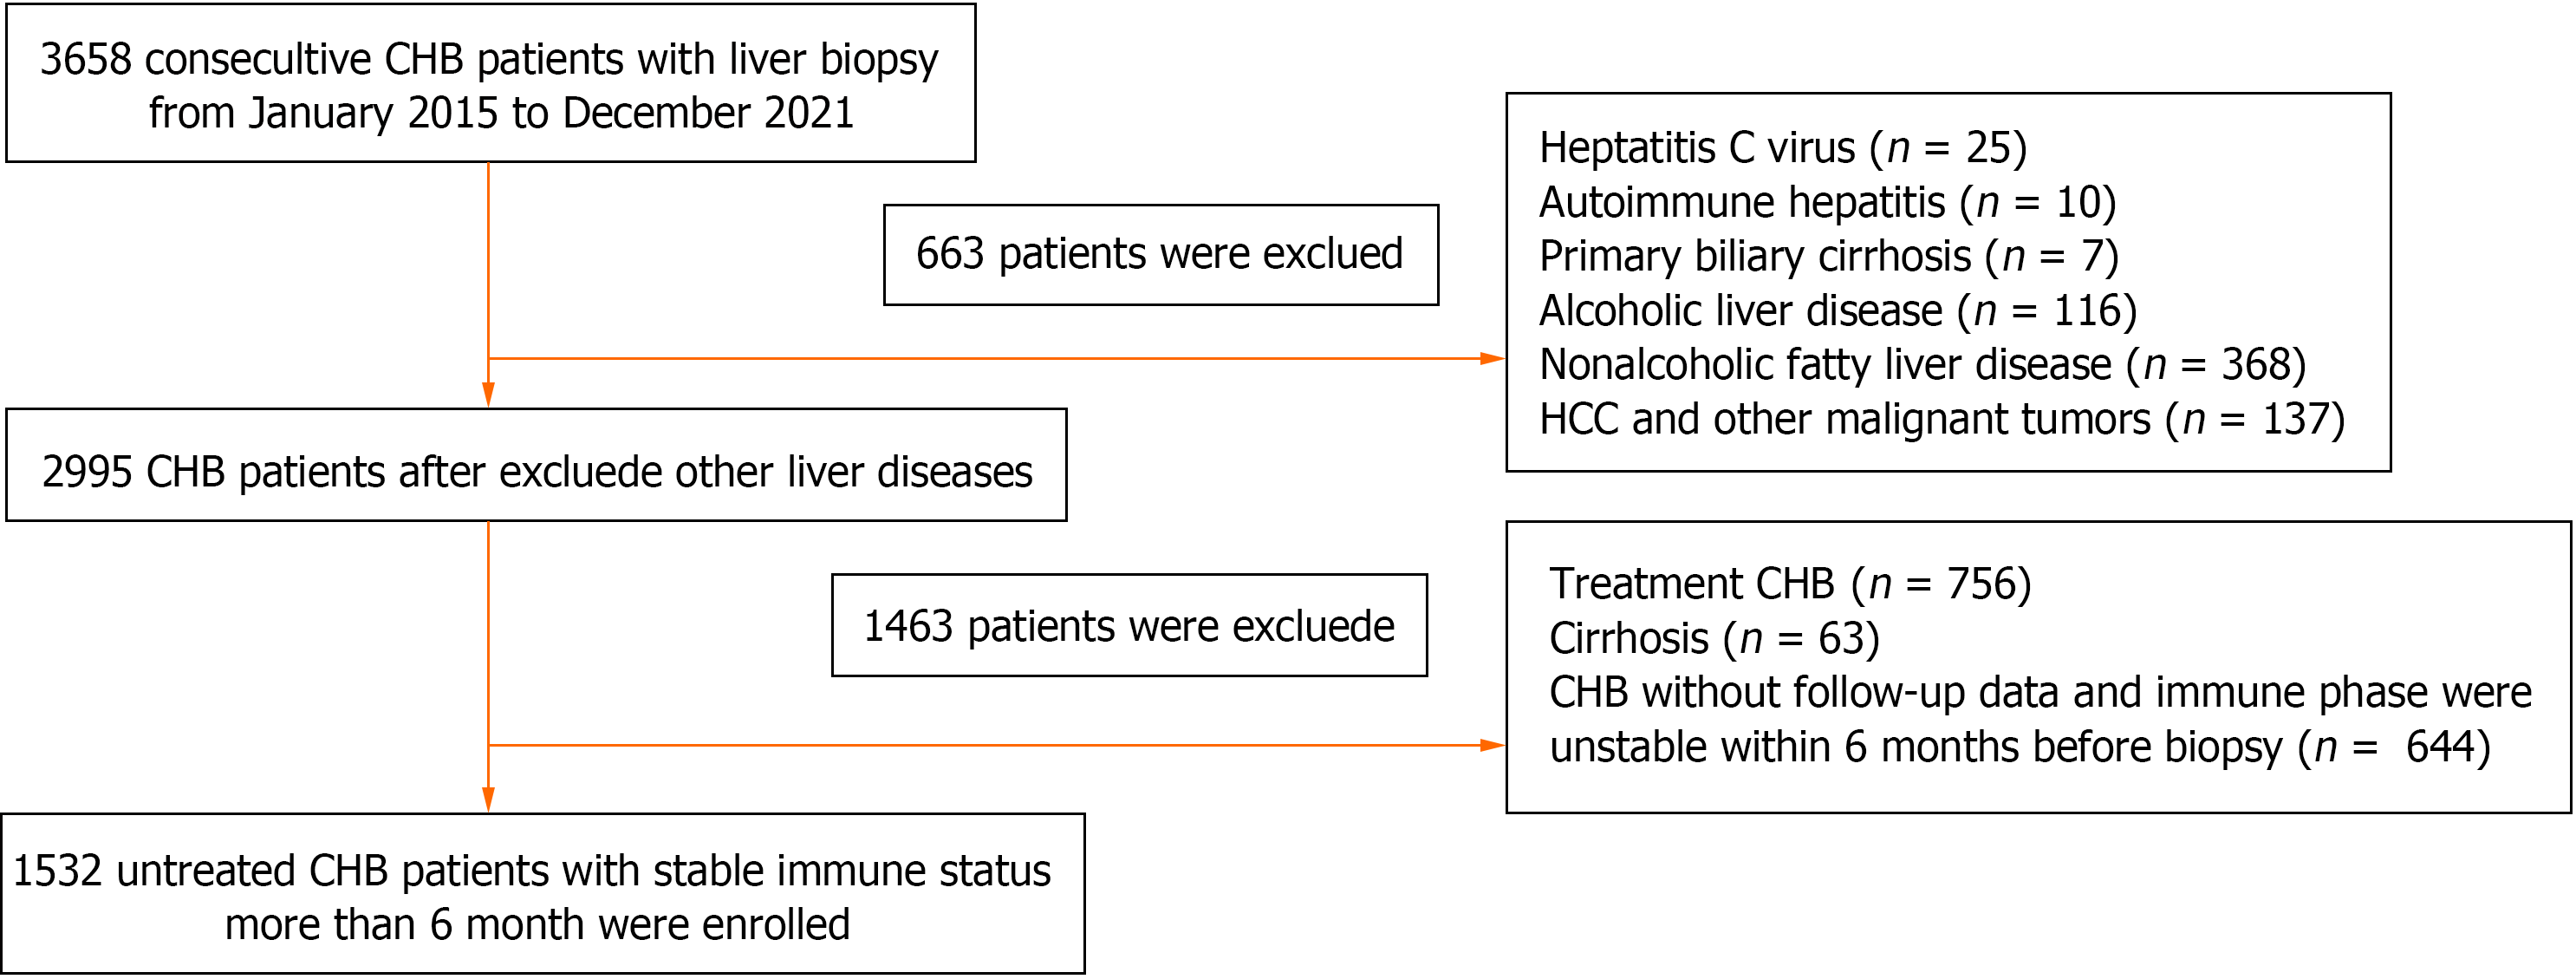
Figure 1 Flow diagram of patient selection.
CHB: Chronic hepatitis B; HCC: Hepatocellular carcinoma.
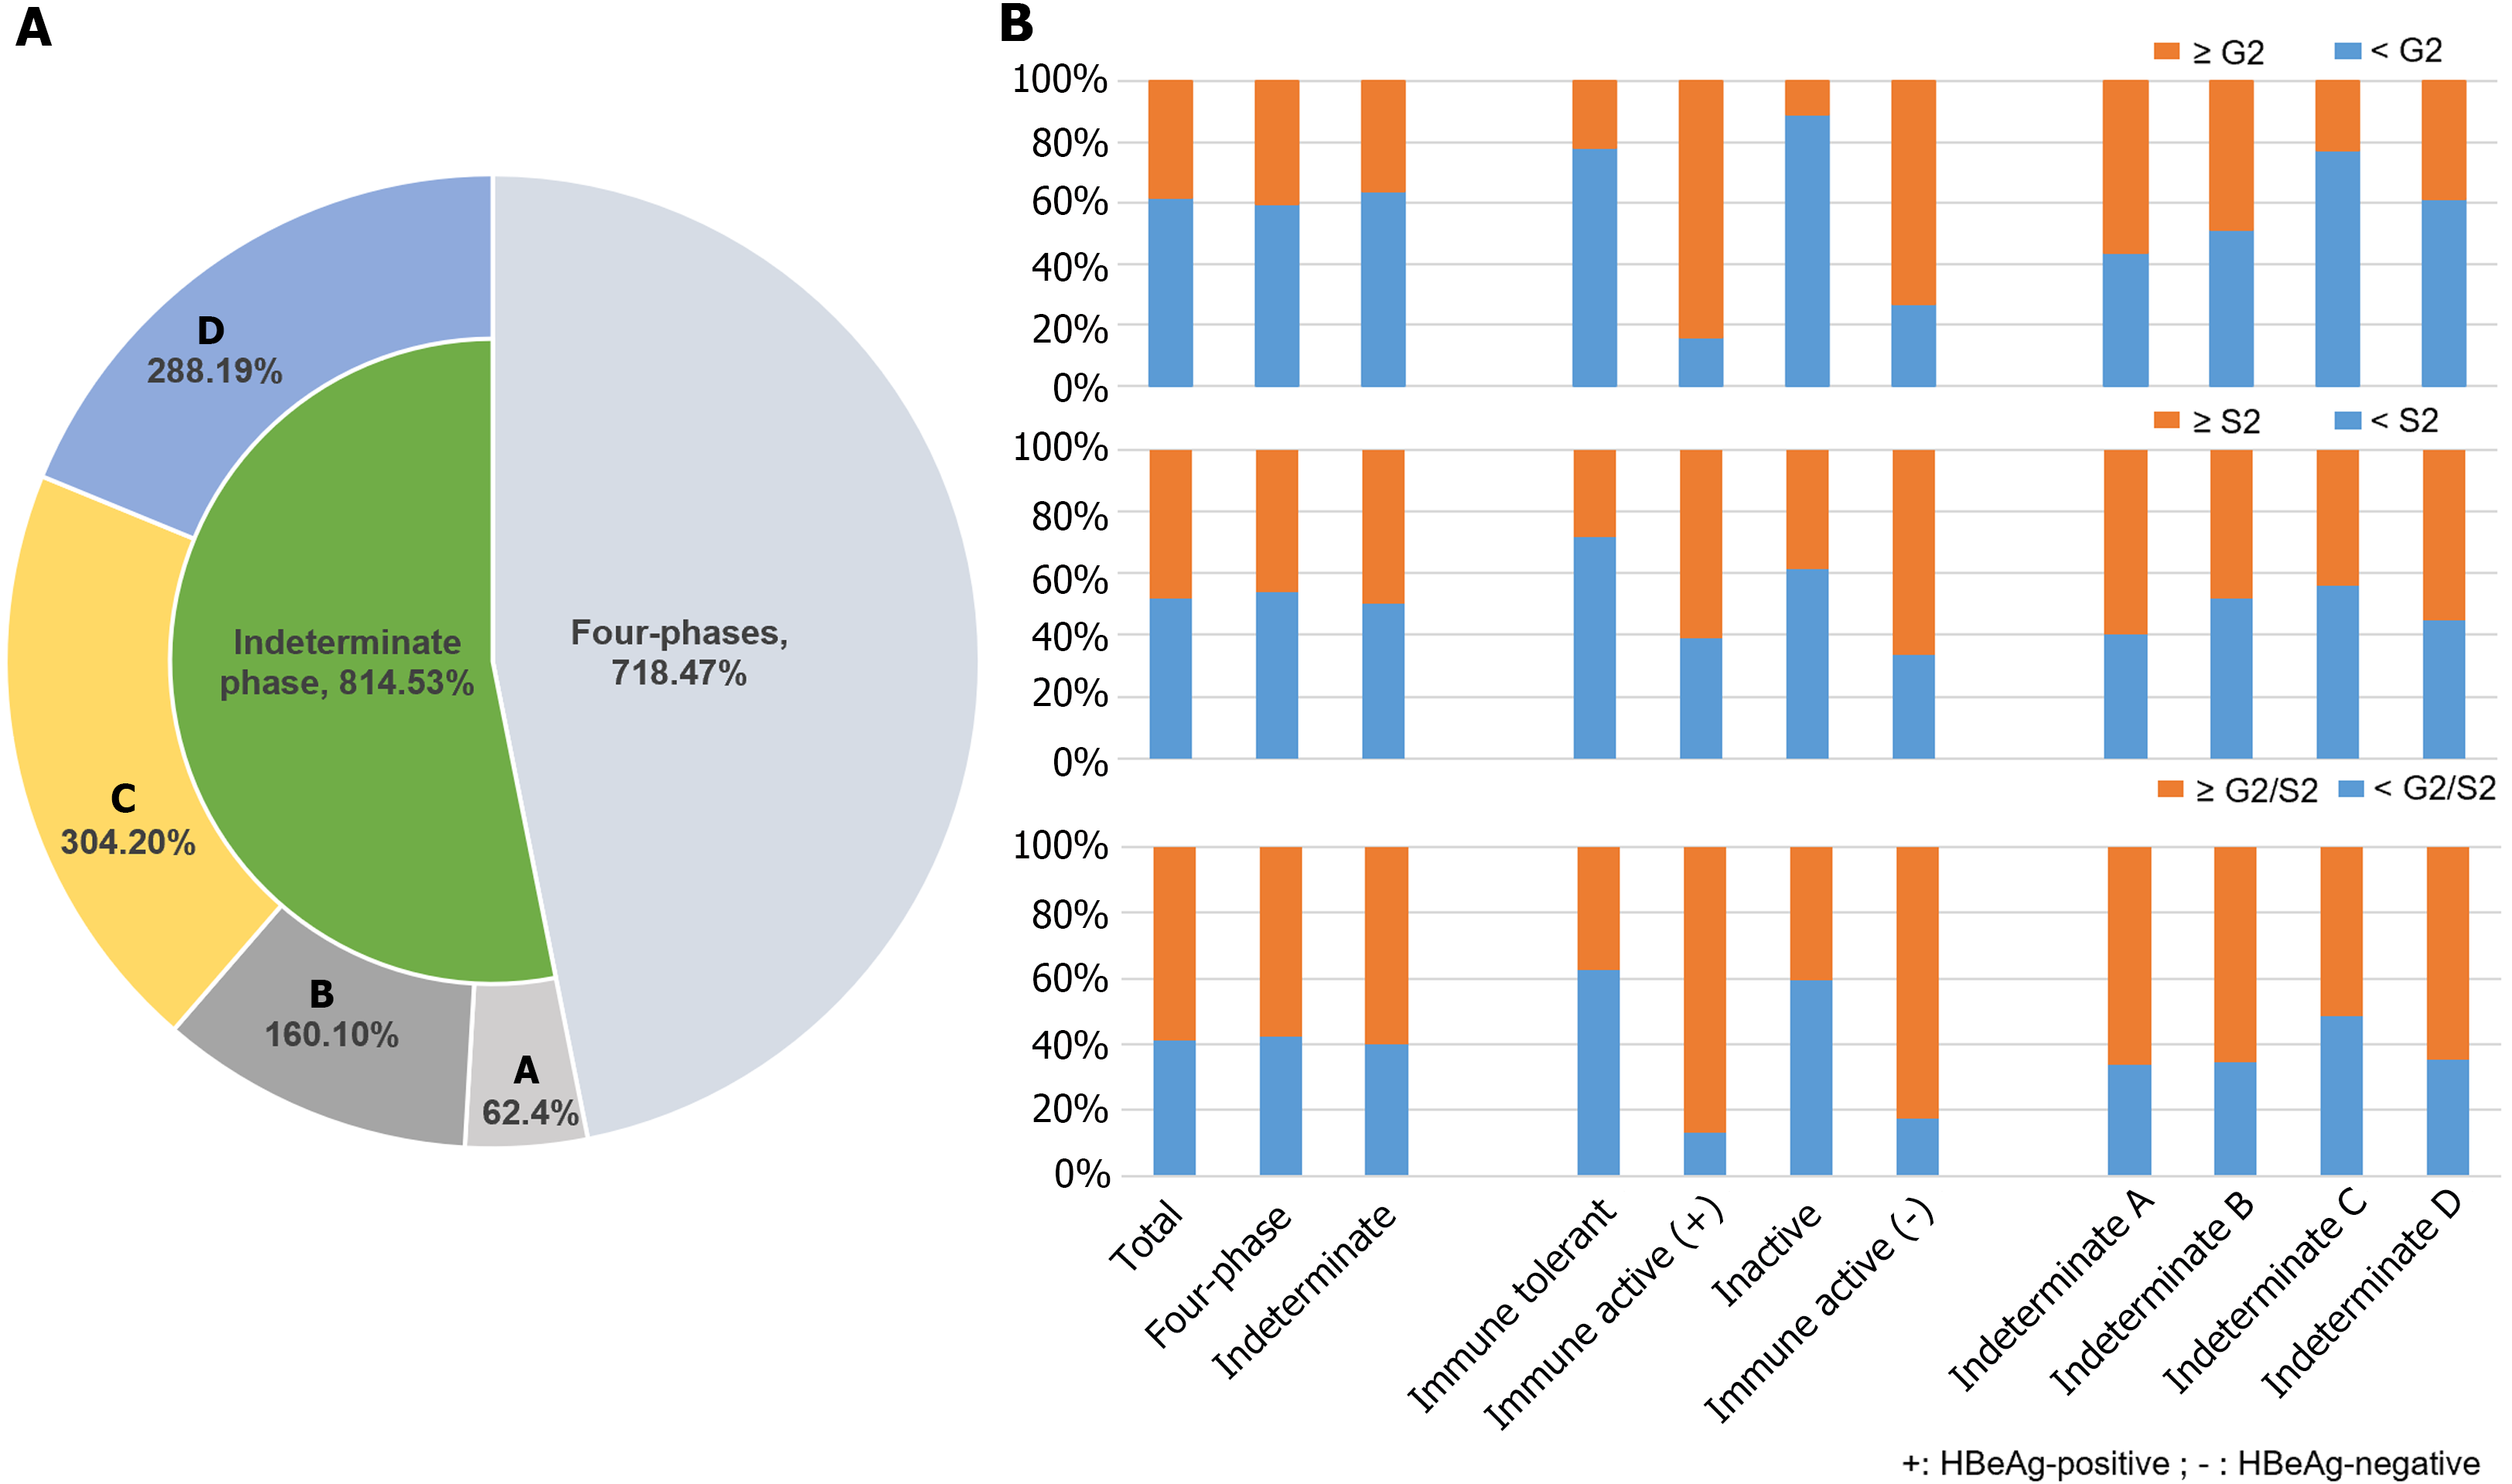
Figure 2 Liver histological changes in different clinical phases.
A: Proportions of chronic hepatitis B patients in different clinical phases; B: The liver histological changes in different clinical phases using liver biopsy. Four phase including including immune tolerant phase, HBeAg-positive immune active phase, inactive phase, and HBeAg-negative immune active phase. ≥ G2 was defined by significant necroinflammation, ≥ S2 defined by significant fibrosis, and ≥ G2/S2 defined by significant histopathological changes.
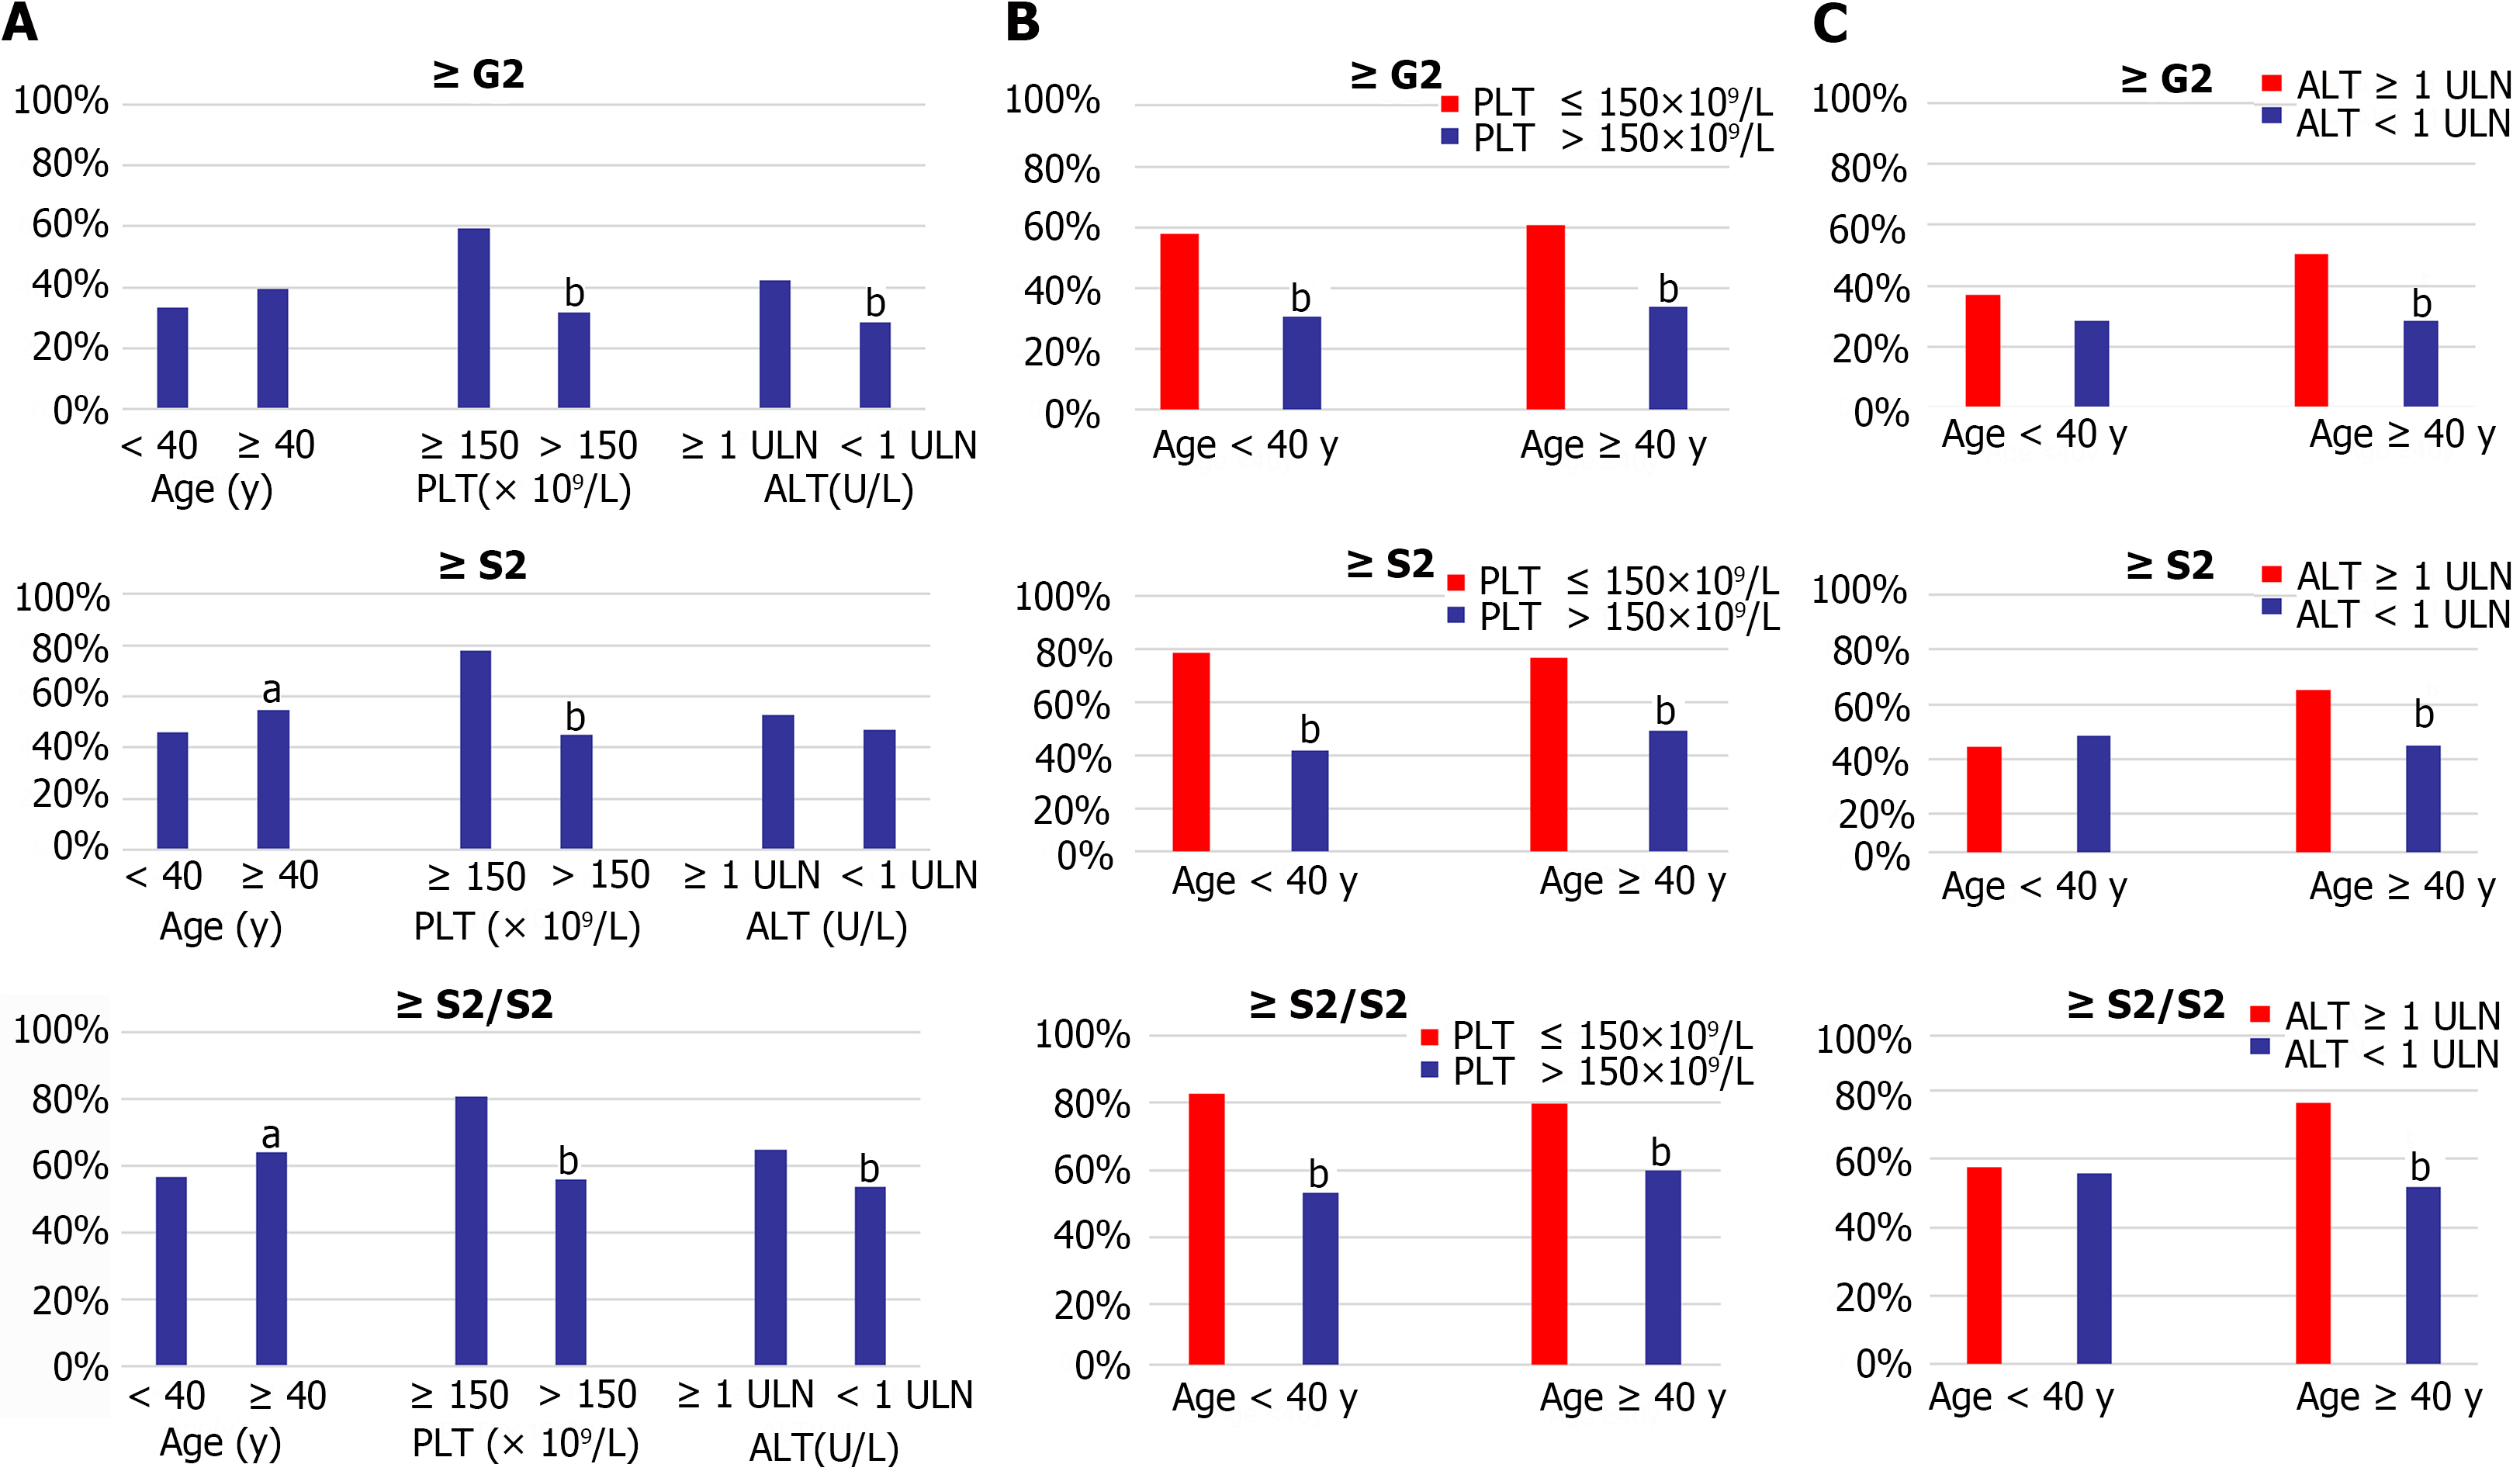
Figure 3 Age, platelet count, and alanine aminotransferase subgroup liver histopathology comparison in indeterminate patient.
A: Distribution of significant liver inflammation (≥ G2), fibrosis (≥ S2), and histological changes (≥ G2/S2) in subgroup of indeterminate patient according to different age, platelet count (PLT), and alanine aminotransferase (ALT) levels; B: Distribution of ≥ G2, ≥ S2, ≥ G2/S2 in different age and PLT groups; C: In different age and ALT groups. aP < 0.05, bP < 0.001. ALT: Alanine aminotransferase; PLT: Platelet count; ULN: Upper limits of normal.
- Citation: Huang DL, Cai QX, Zhou GD, Yu H, Zhu ZB, Peng JH, Chen J. Liver histological changes in untreated chronic hepatitis B patients in indeterminate phase. World J Hepatol 2024; 16(6): 920-931
- URL: https://www.wjgnet.com/1948-5182/full/v16/i6/920.htm
- DOI: https://dx.doi.org/10.4254/wjh.v16.i6.920


