Copyright
©The Author(s) 2017.
World J Stem Cells. Jul 26, 2017; 9(7): 98-106
Published online Jul 26, 2017. doi: 10.4252/wjsc.v9.i7.98
Published online Jul 26, 2017. doi: 10.4252/wjsc.v9.i7.98
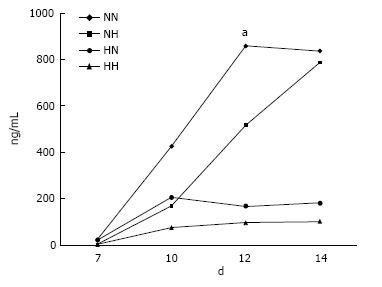
Figure 1 Osteocalcin secretion.
In cells exposed to hypoxia (5% O2) for 7 d followed by normoxia (21% O2) for 7 d (HN), the level of osteocalcin increased rapidly from day 10, peaking at day 12, as compared with cells in the other groups. NN, normoxia for 14 d; NH, normoxia for 7 d followed by hypoxia for 7 d; and HH, hypoxia for 14 d. aP < 0.05.
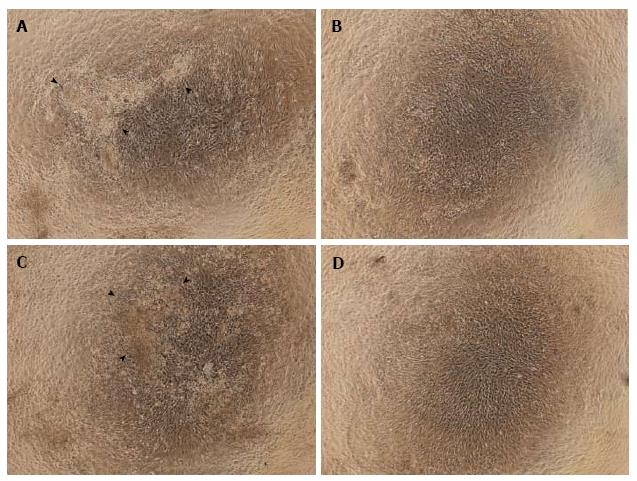
Figure 2 Observations of cell morphology and calcium deposition.
Cells treated with normoxia (21% O2) for 14 d (NN) (A) or hypoxia (5% O2) for 7 d followed by normoxia for 7 d (HN) (C) were differentiated and cuboidal-shaped, and showed cell nodules with calcium deposits. These changes were not present in cells exposed to normoxia for 7 d followed by hypoxia for 7 d (NH) (B) or hypoxia for 14 d (HH) (D). Arrowheads indicate calcium deposition.
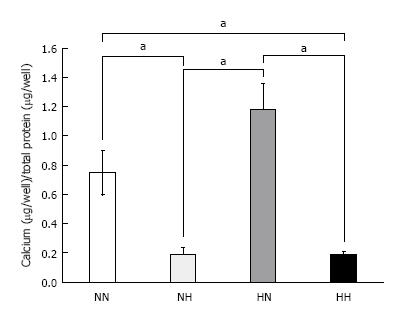
Figure 3 Calcium deposition.
Cells were exposed to normoxia (21% O2) for 14 d (NN), normoxia for 7 d followed by hypoxia (5% O2) for 7 d (NH), hypoxia for 7 d followed by normoxia for 7 d (HN), or hypoxia for 14 d (HH). Calcium deposition was adjusted to total protein content. Cells in the HN group showed the highest amount of calcium deposition among the four groups. aP < 0.05.
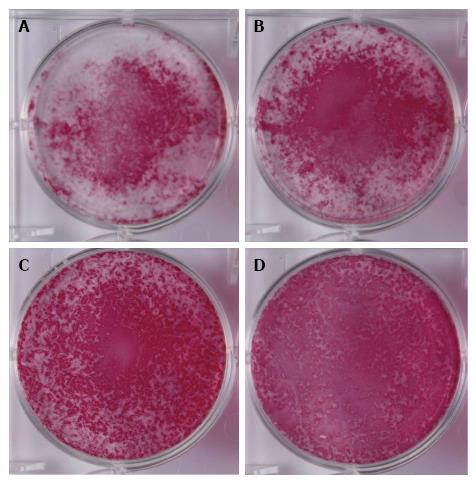
Figure 4 Alkaline phosphatase staining.
Cells were exposed to normoxia (21% O2) for 14 d (NN) (A), normoxia for 7 d followed by hypoxia (5% O2) for 7 d (NH) (B), hypoxia for 7 d followed by normoxia for 7 d (HN) (C), or hypoxia for 14 d (HH) (D) and then stained with alkaline phosphatase staining. The HN group showed the strongest and the broadest alkaline phosphatase staining (C).
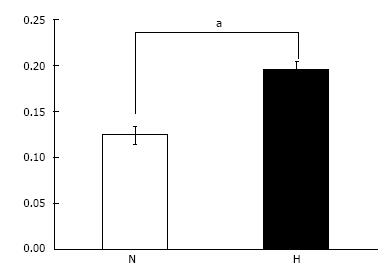
Figure 5 Cell proliferation assay.
Cell proliferation under hypoxic conditions (H: 5% O2) was significantly higher than that under normal oxygen conditions (N: 21% O2). aP < 0.05.
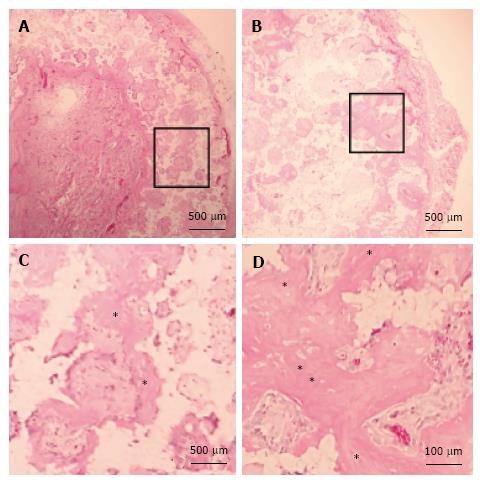
Figure 6 Histology of β-tricalcium phosphate discs wrapped with osteogenic matrix cell sheets.
Cell sheets were exposed to hypoxia (5% O2) for 7 d followed by normoxia (21% O2) for 7 d (B) or normoxia for 14 d (A). Prominent newly formed bone (*) was observed in the HN group. (C) and (D) are higher magnifications of squared areas indicated in (A) and (B), respectively.
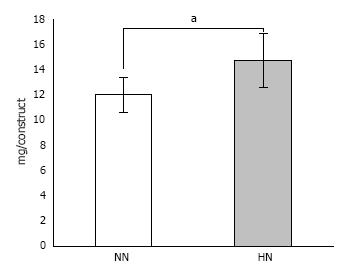
Figure 7 Calcium content in β-tricalcium phosphate discs wrapped with osteogenic matrix cell sheet.
Cell sheets were exposed to hypoxia (5% O2) for 7 d followed by normoxia (21% O2) for 7 d (HN) or normoxia for 14 d (NN). The HN group showed a significantly higher amount of calcium content compared with the NN group. aP < 0.05.
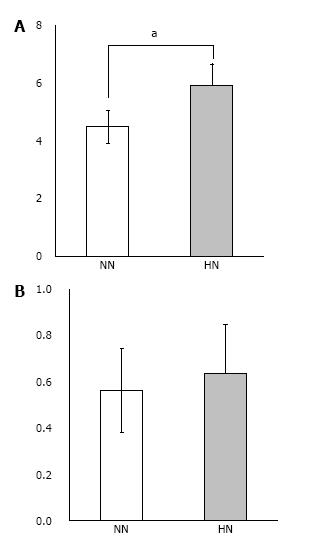
Figure 8 Real-time quantitative PCR of β-tricalcium phosphate discs wrapped with osteogenic matrix cell sheet.
Increased collagen type I mRNA expression was observed in the HN group exposed to hypoxia (5% O2) for 7 d followed by normoxia (21% O2) for 7 d, compared with the NN group exposed to normoxia for 14 d (A). A tendency for higher expression of osteocalcin mRNA was also observed in the HN group (B). aP < 0.05.
- Citation: Inagaki Y, Akahane M, Shimizu T, Inoue K, Egawa T, Kira T, Ogawa M, Kawate K, Tanaka Y. Modifying oxygen tension affects bone marrow stromal cell osteogenesis for regenerative medicine. World J Stem Cells 2017; 9(7): 98-106
- URL: https://www.wjgnet.com/1948-0210/full/v9/i7/98.htm
- DOI: https://dx.doi.org/10.4252/wjsc.v9.i7.98


