Copyright
©The Author(s) 2016.
World J Stem Cells. Nov 26, 2016; 8(11): 384-395
Published online Nov 26, 2016. doi: 10.4252/wjsc.v8.i11.384
Published online Nov 26, 2016. doi: 10.4252/wjsc.v8.i11.384
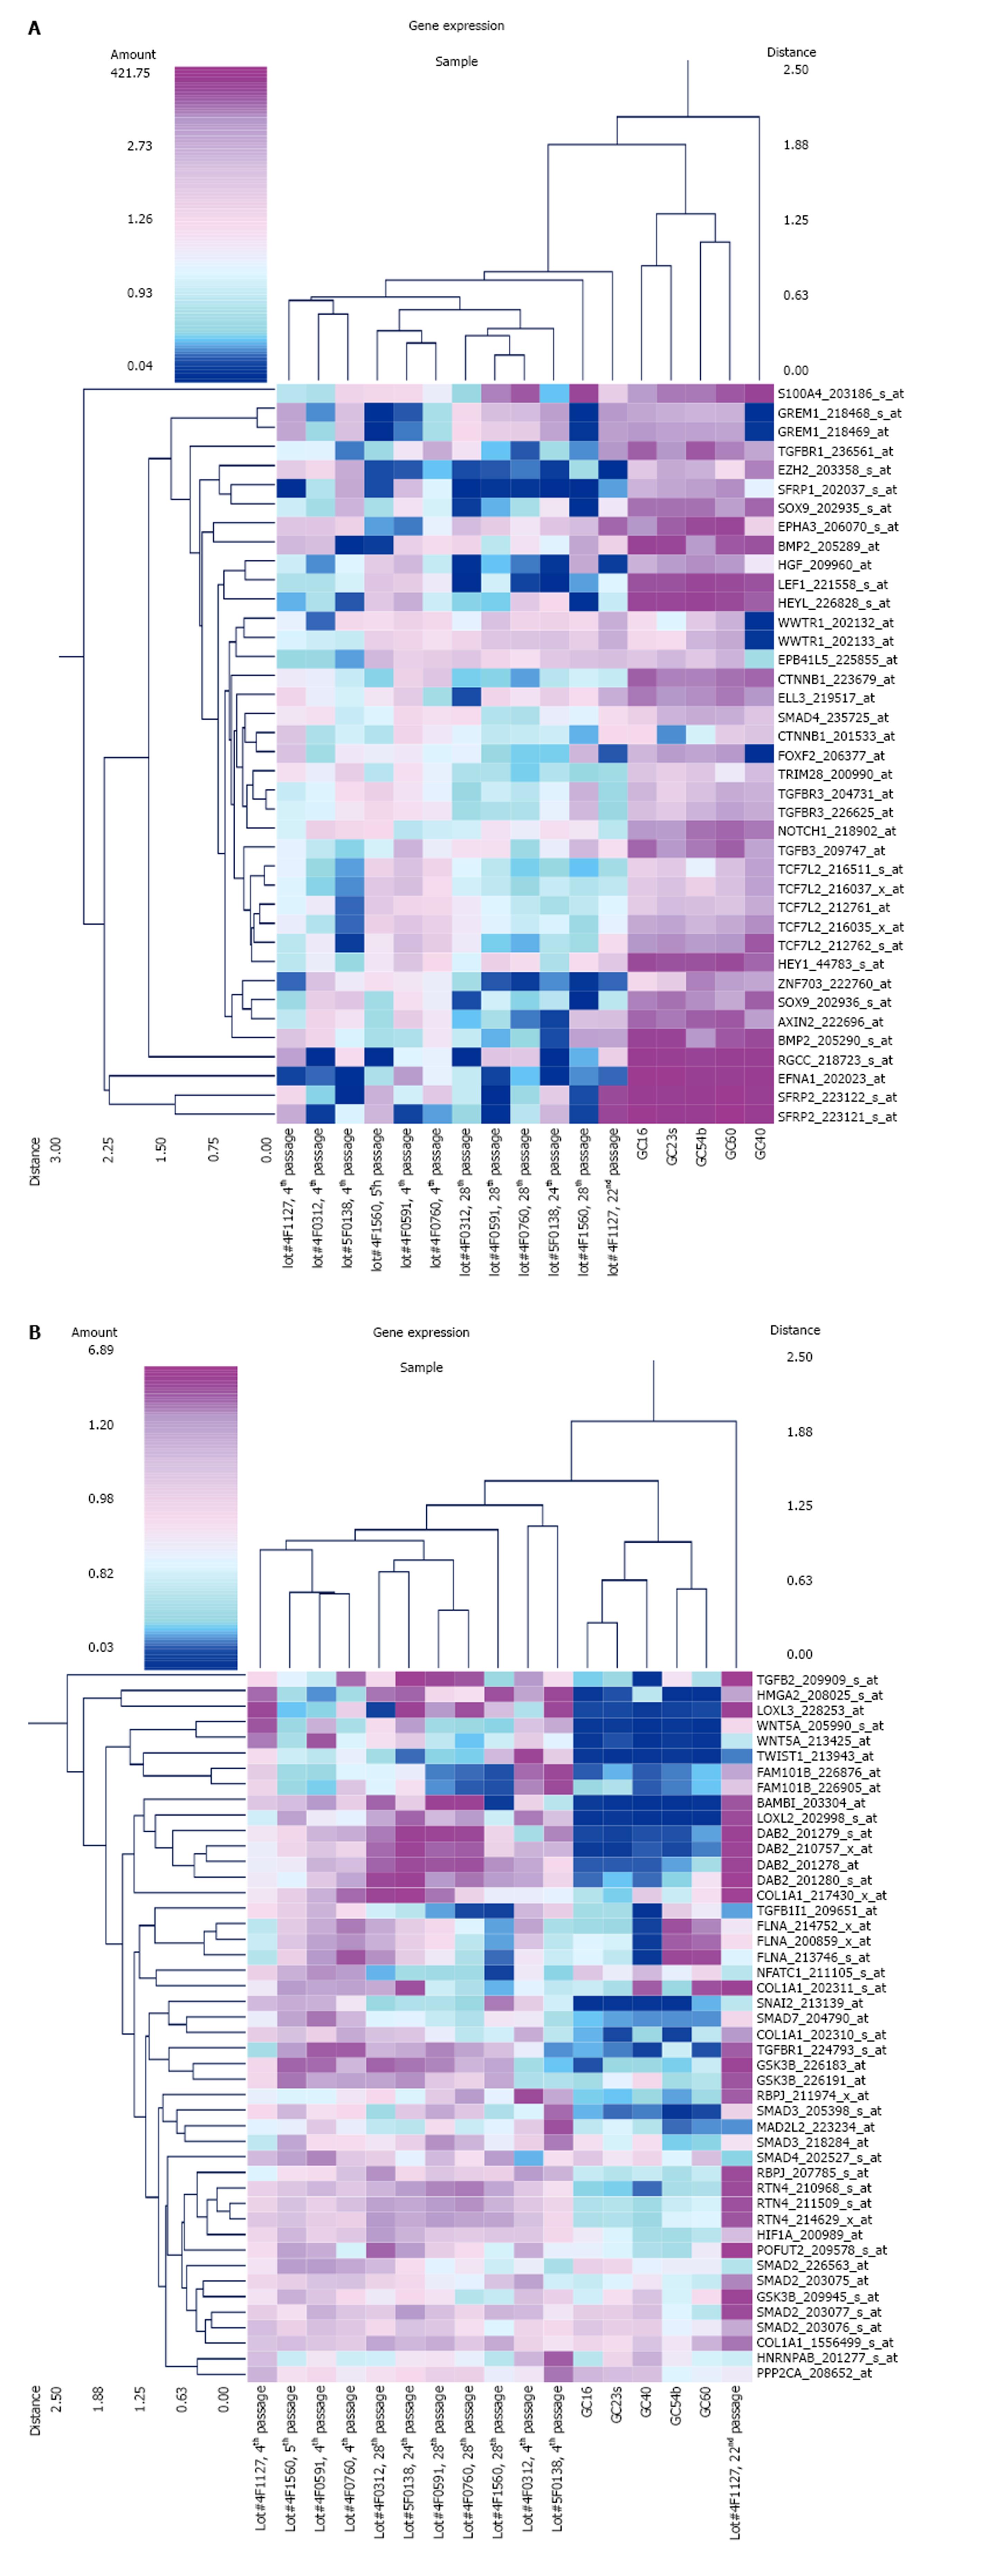
Figure 1 Expression of epithelial-mesenchymal transition-related genes in mesenchymal stem cells and diffuse-type gastric cancer cells.
Cluster analysis of gene expression in mesenchymal stem cells (MSCs) and diffuse-type gastric cancer (GC) cells. A: The result of the cluster analysis of 39 probe sets that were up-regulated in diffuse-type GC cells compared to early-stage MSCs (n = 6 in early-stage MSCs, n = 6 in late-stage MSCs, n = 5 in GC); B: The result of the cluster analysis of 46 probe sets that were down-regulated in diffuse-type GC cells compared to early-stage MSCs (n = 6 in early-stage MSCs, n = 6 in late-stage MSCs, n = 5 in GC). The probe sets with epithelial to mesenchymal transition in the Gene Ontology Biological Process were selected (the average signal intensity in early-stage MSCs, late-stage MSCs, or GC cells is greater than 500).
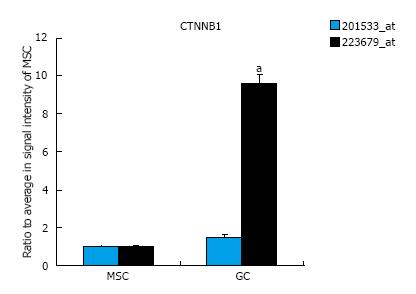
Figure 2 CTNNB1 expression in mesenchymal stem cells and diffuse-type gastric cancer cells.
CTNNB1 gene expression was up-regulated in GC cells compared to MSCs. The signal intensity of probe set ID 223679_at was up-regulated more than 8-fold in GC cells compared to MSCs, whereas the signal intensity in probe set ID 201533_at was unchanged (n = 12 in MSC, n = 5 in GC, aP < 0.01 in t test). GC: Gastric cancer; MSCs: Mesenchymal stem cells.
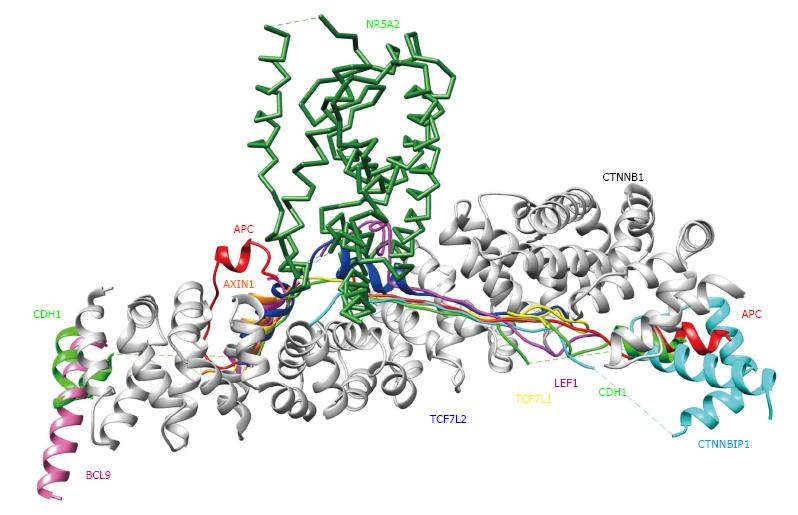
Figure 3 3D structures of β-catenin (CTNNB1) binding proteins.
Each CTNNB1 complex structure was superimposed onto the CTNNB1 structure in a complex with APC (PDB code: 1th1), using the program MATRAS (From Ref. [18]). Colors and PDB codes are summarized as follows: White: CTNNB1 (CTNB1_HUMAN, 1th1); red: APC (APC_HUMAN, 1th1); orange: AXIN1 (AXN_XELNA, 1qz7); hot pink: BCL9 (BCL9_HUMAN, 3sl9); green: CDH1 (CADH1_MOUSE. 1i7w); cyan: CTNNBIP1 (CNBP1_HUMAN, 1m1e); magenta: LEF1 (LEF1_MOUSE, 3oux); forest green: NR5A2 (NR5A2_HUMAN, 3tx7); yellow: TCF7L1 (T7L1A_XENLA, 1g3j); blue: TCF7L2 (TF7L2_HUMAN, 1jdh).
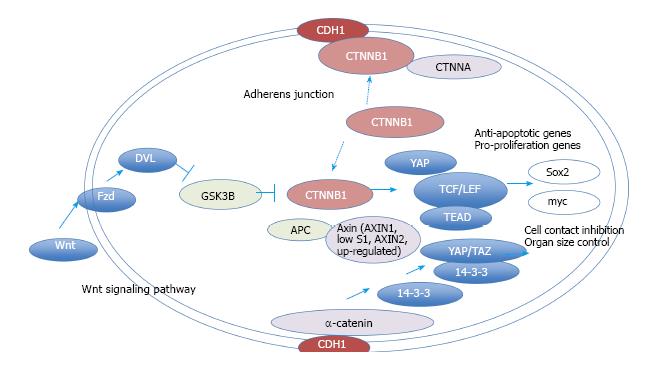
Figure 4 Network model for CTNNB1.
The molecular network model for CTNNB1 signaling is shown. The extracted networks for pathways in cancer, Hippo signaling pathway and the Wnt signaling pathway (KEGG) were merged and are shown in a molecular network model. Wnt signaling and adherens junction molecules cross-talk via CTNNB1. Activated CTNNB1 induces the transcription of anti-apoptosis genes and pro-proliferation genes.
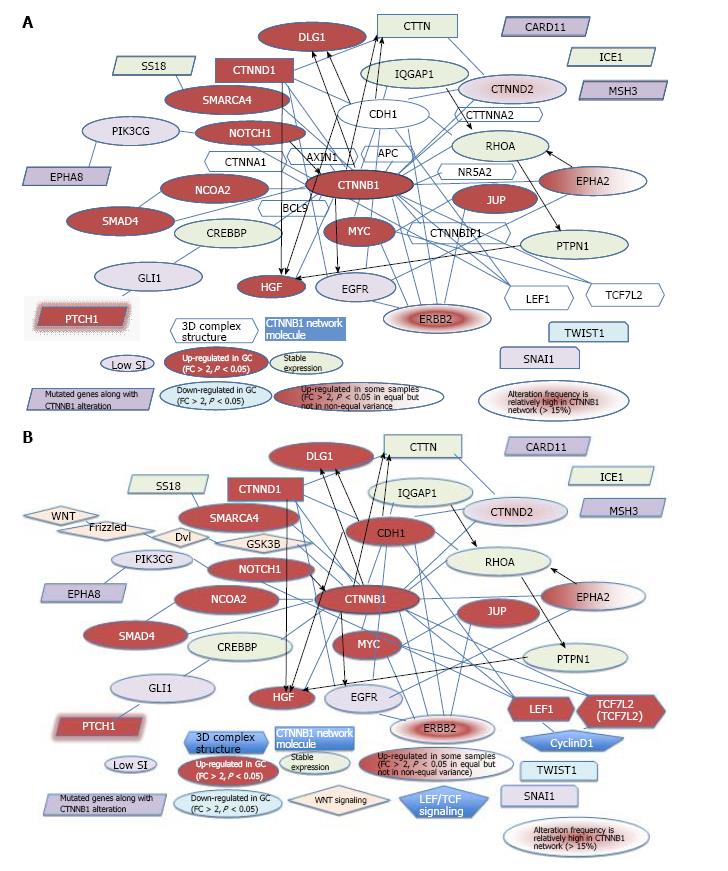
Figure 5 Network model for CTNNB1 and related genes.
A: Network model for CTNNB1 and genes mutated along with CTNNB1. The networks of extracted CTNNB1 with other mutated genes plus that of extracted CTNNB1 alone are shown (cBioPortal-oriented, Stomach Adenocarcinoma)[16]; B: Network model for CTNNB1 and 6 mutated genes. Wnt and LEF/TCF signaling are merged in CTNNB1 signaling (cBioPortal-oriented, Stomach Adenocarcinoma)[16].
- Citation: Tanabe S, Kawabata T, Aoyagi K, Yokozaki H, Sasaki H. Gene expression and pathway analysis of CTNNB1 in cancer and stem cells. World J Stem Cells 2016; 8(11): 384-395
- URL: https://www.wjgnet.com/1948-0210/full/v8/i11/384.htm
- DOI: https://dx.doi.org/10.4252/wjsc.v8.i11.384


