Copyright
©2013 Baishideng Publishing Group Co.
World J Stem Cells. Oct 26, 2013; 5(4): 229-237
Published online Oct 26, 2013. doi: 10.4252/wjsc.v5.i4.229
Published online Oct 26, 2013. doi: 10.4252/wjsc.v5.i4.229
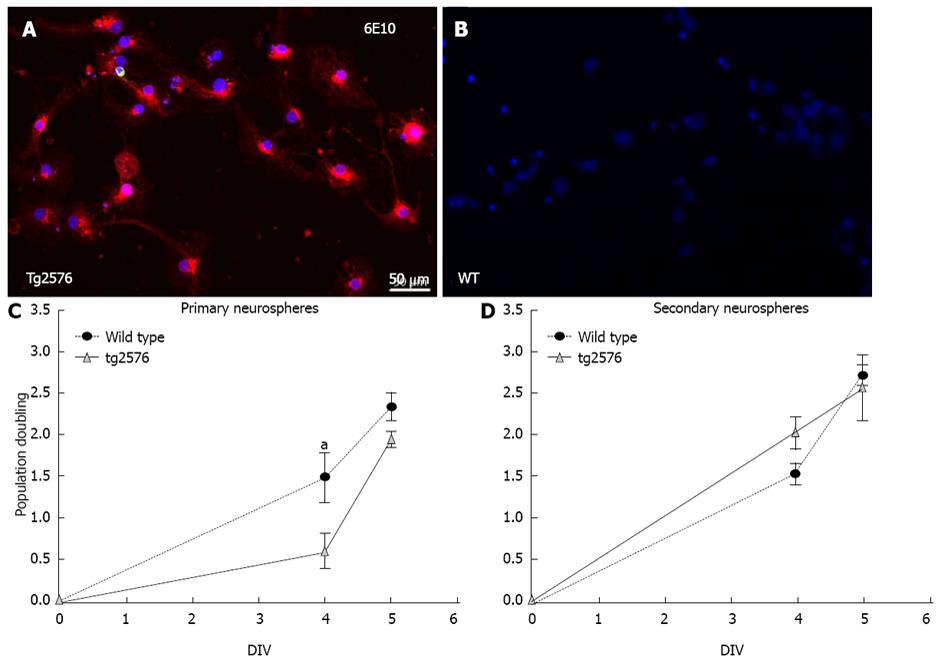
Figure 1 Transgenic protein expression and population doubling.
Micrograph shows the positive 6E10 staining of Tg2576 plated cells derived from secondary neurospheres (A) and the related negative staining of wild type derived cells (B). A decrease in population doubling seems to occur in the first few days of primary neurosphere development (C), and is not repeated in secondary neurosphere formation (D). Statistical analysis: Student’s t-test. Graphs represent mean ± SE and asterisks represent significant differences between Tg2576 and Wt at the same DIV (aP < 0.05).
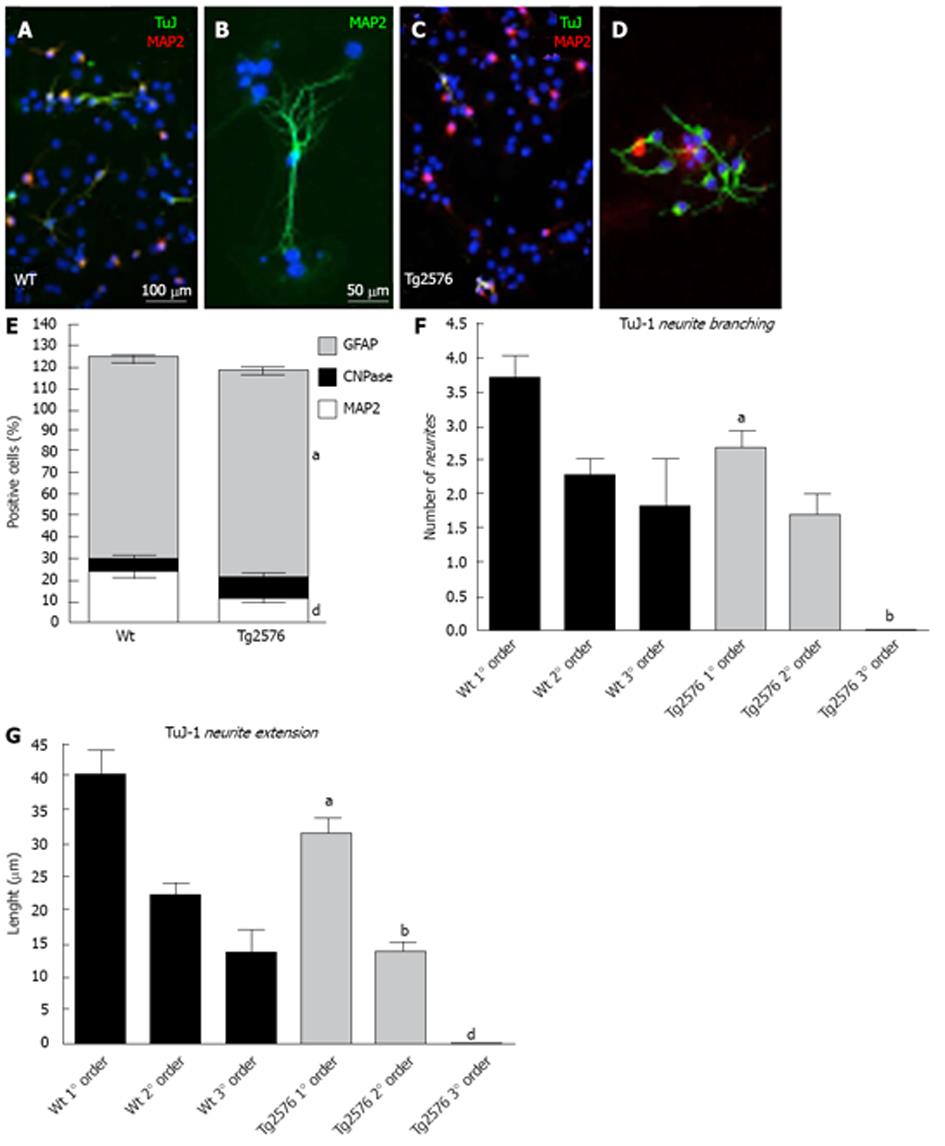
Figure 2 Morphological analysis.
A-D: Micrographs showing immunostaining for β-III-tubulin (TuJ-1) and MAP2 in Wt and Tg2576 cells. Hoechst 33258 nuclear staining was used to determine the total cell number; E: The analyses of cell lineage indicate an increase in GFAP- and a decrease in MAP2-positive cells in Tg2576 compared to Wt. The number of CNPase-positive cells does not vary between the two genotypes; F, G: neural maturation analysis shows both a decrease in TuJ-1 positive branching of the third order and in neurite extension in cells derived from Tg2576 animals. Statistical analysis: Student’s t-test. Graphs represent mean ± SE and asterisks represent significant differences between Tg2576 and Wt (aP < 0.05; bP < 0.01; dP < 0.001). Bars: A, C: 100 μm; B, D, 50 μm.
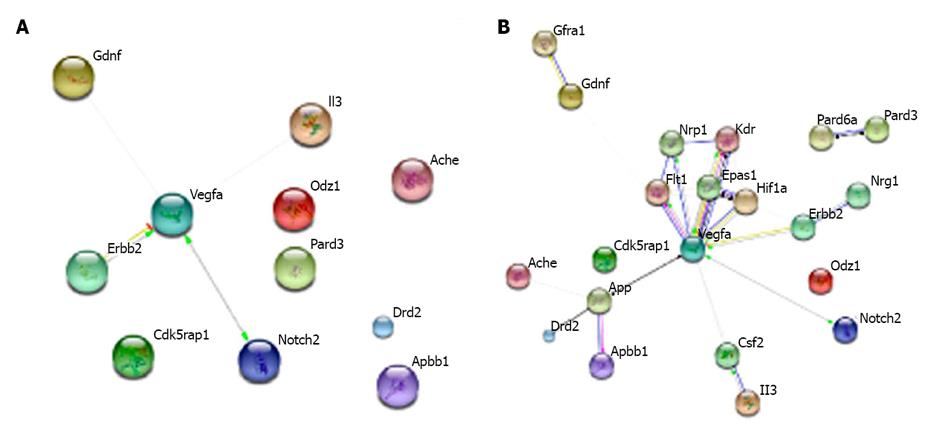
Figure 3 Functional protein net.
The list of the neurogenesis-involved genes altered in Tg2576 versus Wt cells is reported in Table 2. The related proteins were clustered using STRING web software. Figure shows the 11 genes (A) and the extended net (B).
- Citation: Baldassarro VA, Lizzo G, Paradisi M, Fernández M, Giardino L, Calzà L. Neural stem cells isolated from amyloid precursor protein-mutated mice for drug discovery. World J Stem Cells 2013; 5(4): 229-237
- URL: https://www.wjgnet.com/1948-0210/full/v5/i4/229.htm
- DOI: https://dx.doi.org/10.4252/wjsc.v5.i4.229


