Copyright
©The Author(s) 2025.
World J Stem Cells. Jul 26, 2025; 17(7): 104607
Published online Jul 26, 2025. doi: 10.4252/wjsc.v17.i7.104607
Published online Jul 26, 2025. doi: 10.4252/wjsc.v17.i7.104607
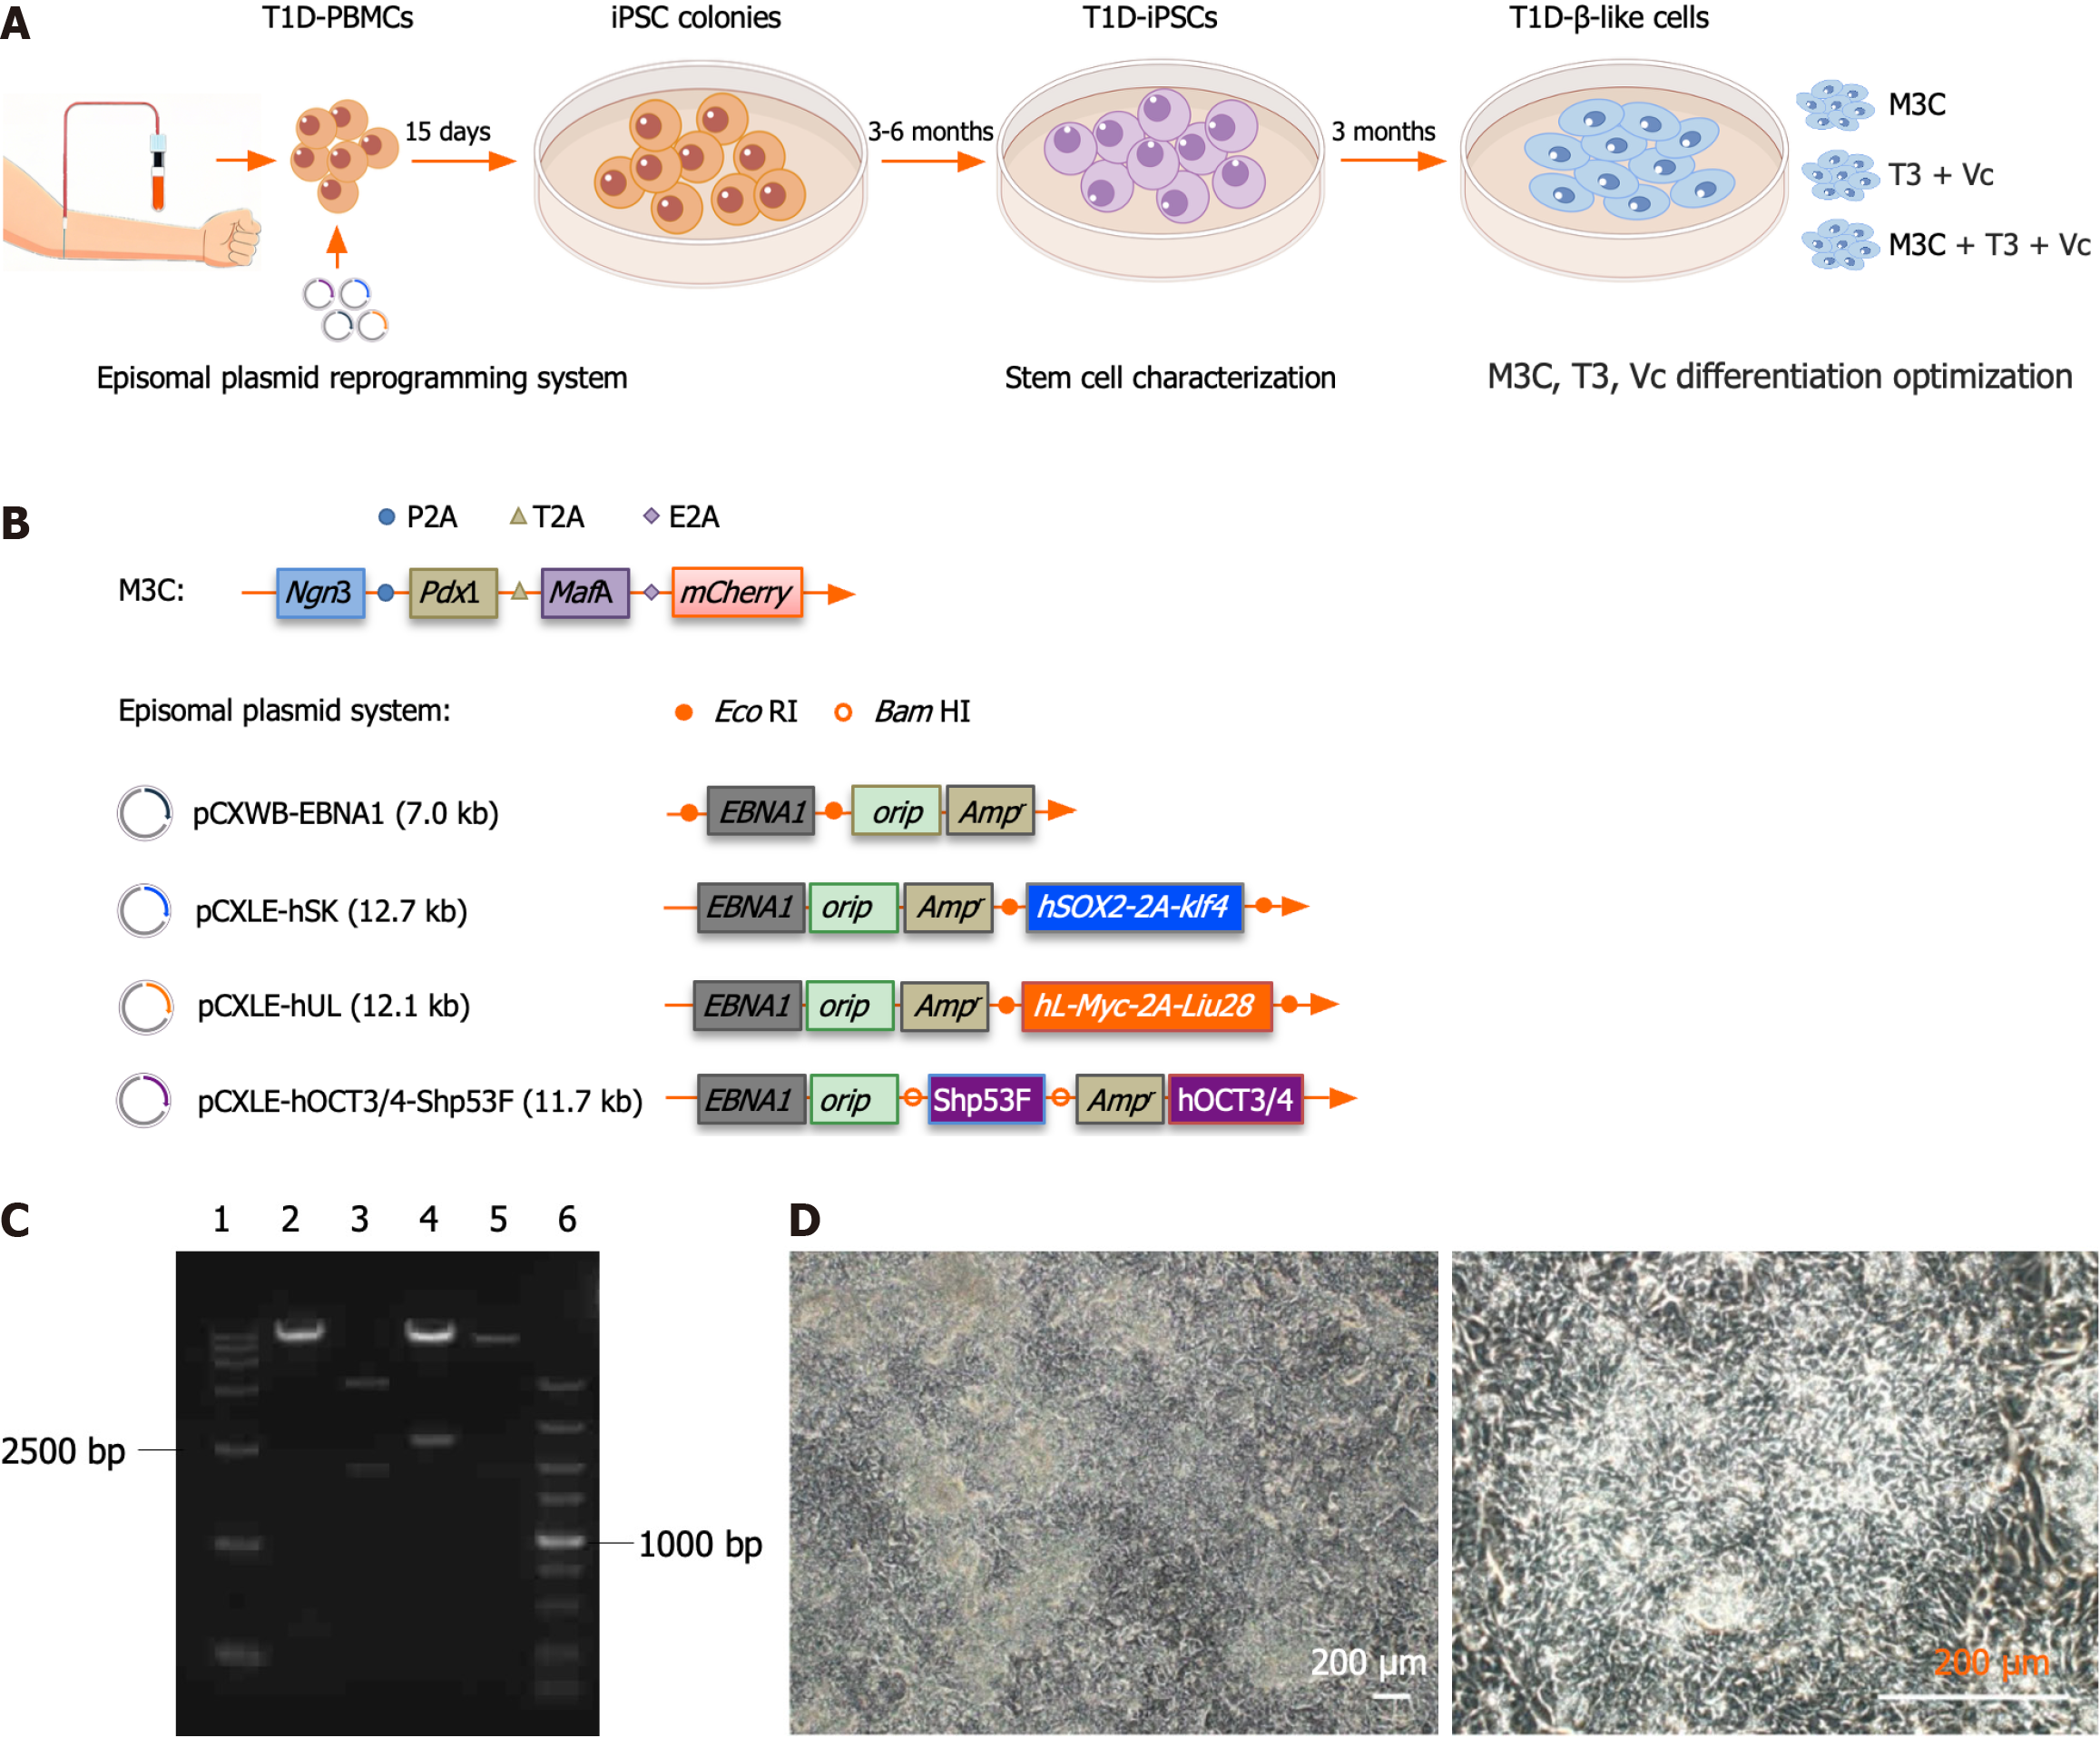
Figure 1 Reprogramming of type 1 diabetes peripheral blood mononuclear cells into type 1 diabetes-induced pluripotent stem cells.
A: Schematic of the type 1 diabetes (T1D)-β-like cell generation workflow. The diagram outlines the complete differentiation pipeline: (1) T1D patient-derived peripheral blood mononuclear cells were reprogrammed into induced pluripotent stem cells (iPSCs) using non-integrating episomal vectors, followed by 3-6 months of clone selection, expansion, and pluripotency verification, including appropriate morphology, differentiation potential, genomic integrity, and expression of pluripotency-associated genes; (2) iPSCs underwent 3-month directed differentiation using three optimized protocols [M3C, triiodothyronine (T3) + vitamin C (Vc), and M3C + T3 + Vc], with progression monitored through stage-specific markers (insulin 1, insulin 2, pancreatic duodenal homeobox-1, neurogenin 3, MAF bZIP transcription factor A, NeuroD, glucagon-like peptide-1 receptor, Nkx6.1, glucose transporter 2, and Kir62); and (3) Functional validation included glucose-stimulated insulin secretion assays and transplantation into streptozotocin-induced diabetic mice; B: Schematic representation of the M3C and episomal plasmid systems. The pAd-M3C plasmid was 40.2 kbp long and comprised a 36.6 kbp pAd-CMV/V5-DEST vector backbone with a 3.5 kbp M3C insert. The M3C insert (PubMed: 25402613) included pancreatic duodenal homeobox-1 (852 bp), neurogenin 3 (642 bp), MAF bZIP transcription factor A (1077 bp), and mCherry (711 bp). The junctions use restriction enzymes SalI (5’-GTCGAC-3’), SpeI (5’-ACTAGT-3’), BamHI (5’-GGATCC-3’), ClaI (5’-ATCGAT-3’), and NotI (5’-GCGGCCGC-3’). Synthetic sequences such as P2A (from porcine tetanus virus), T2A (porcine thymovirus type II), and E2A (coronavirus type II) are used for ligated inserts. The episomal plasmid system consisted of four plasmids: PCXWB-EBNA1 (7.0 kb) and its recombined counterparts, including pCXLE-hSK (12.7 kb), pCXLE-hUL (12.1 kb), and pCXLE-hOCT3/4-Shp53F (11.7 kb); C: Electrophoretic analysis of the episomal plasmid system post-restriction digestion. Agarose gel electrophoresis results: (1) DNA ladder DL15000; (2) pCXLE-hOCT3/4-Shp53F digested with BamHI, yielding fragments of 11.3 kb and 0.4 kb; (3) pCXWB-EBNA1 using EcoRI, with fragment sizes of 5 and 2 kb; (4) pCXLE-hSK digested with EcoRI, resulting in 10.2 kb and 2.5 kb fragments; (5) pCXLE-hUL with EcoRI giving 102 and 1.9 kb fragments; and (6) DNA ladder DL5000; D: Morphological characterization of T1D-iPSCs. T1D-iPSCs exhibit typical pluripotent stem cell morphology, including small cell size and compact colony formation (scale bar = 200 μm). T1D: Type 1 diabetes; PBMC: Peripheral blood mononuclear cell; iPSC: Induced pluripotent stem cells; T3: Triiodothyronine; Vc: Vitamin C; Ngn3: Neurogenin 3; Pdx1: Pancreatic duodenal homeobox-1; MafA: MAF bZIP transcription factor A.
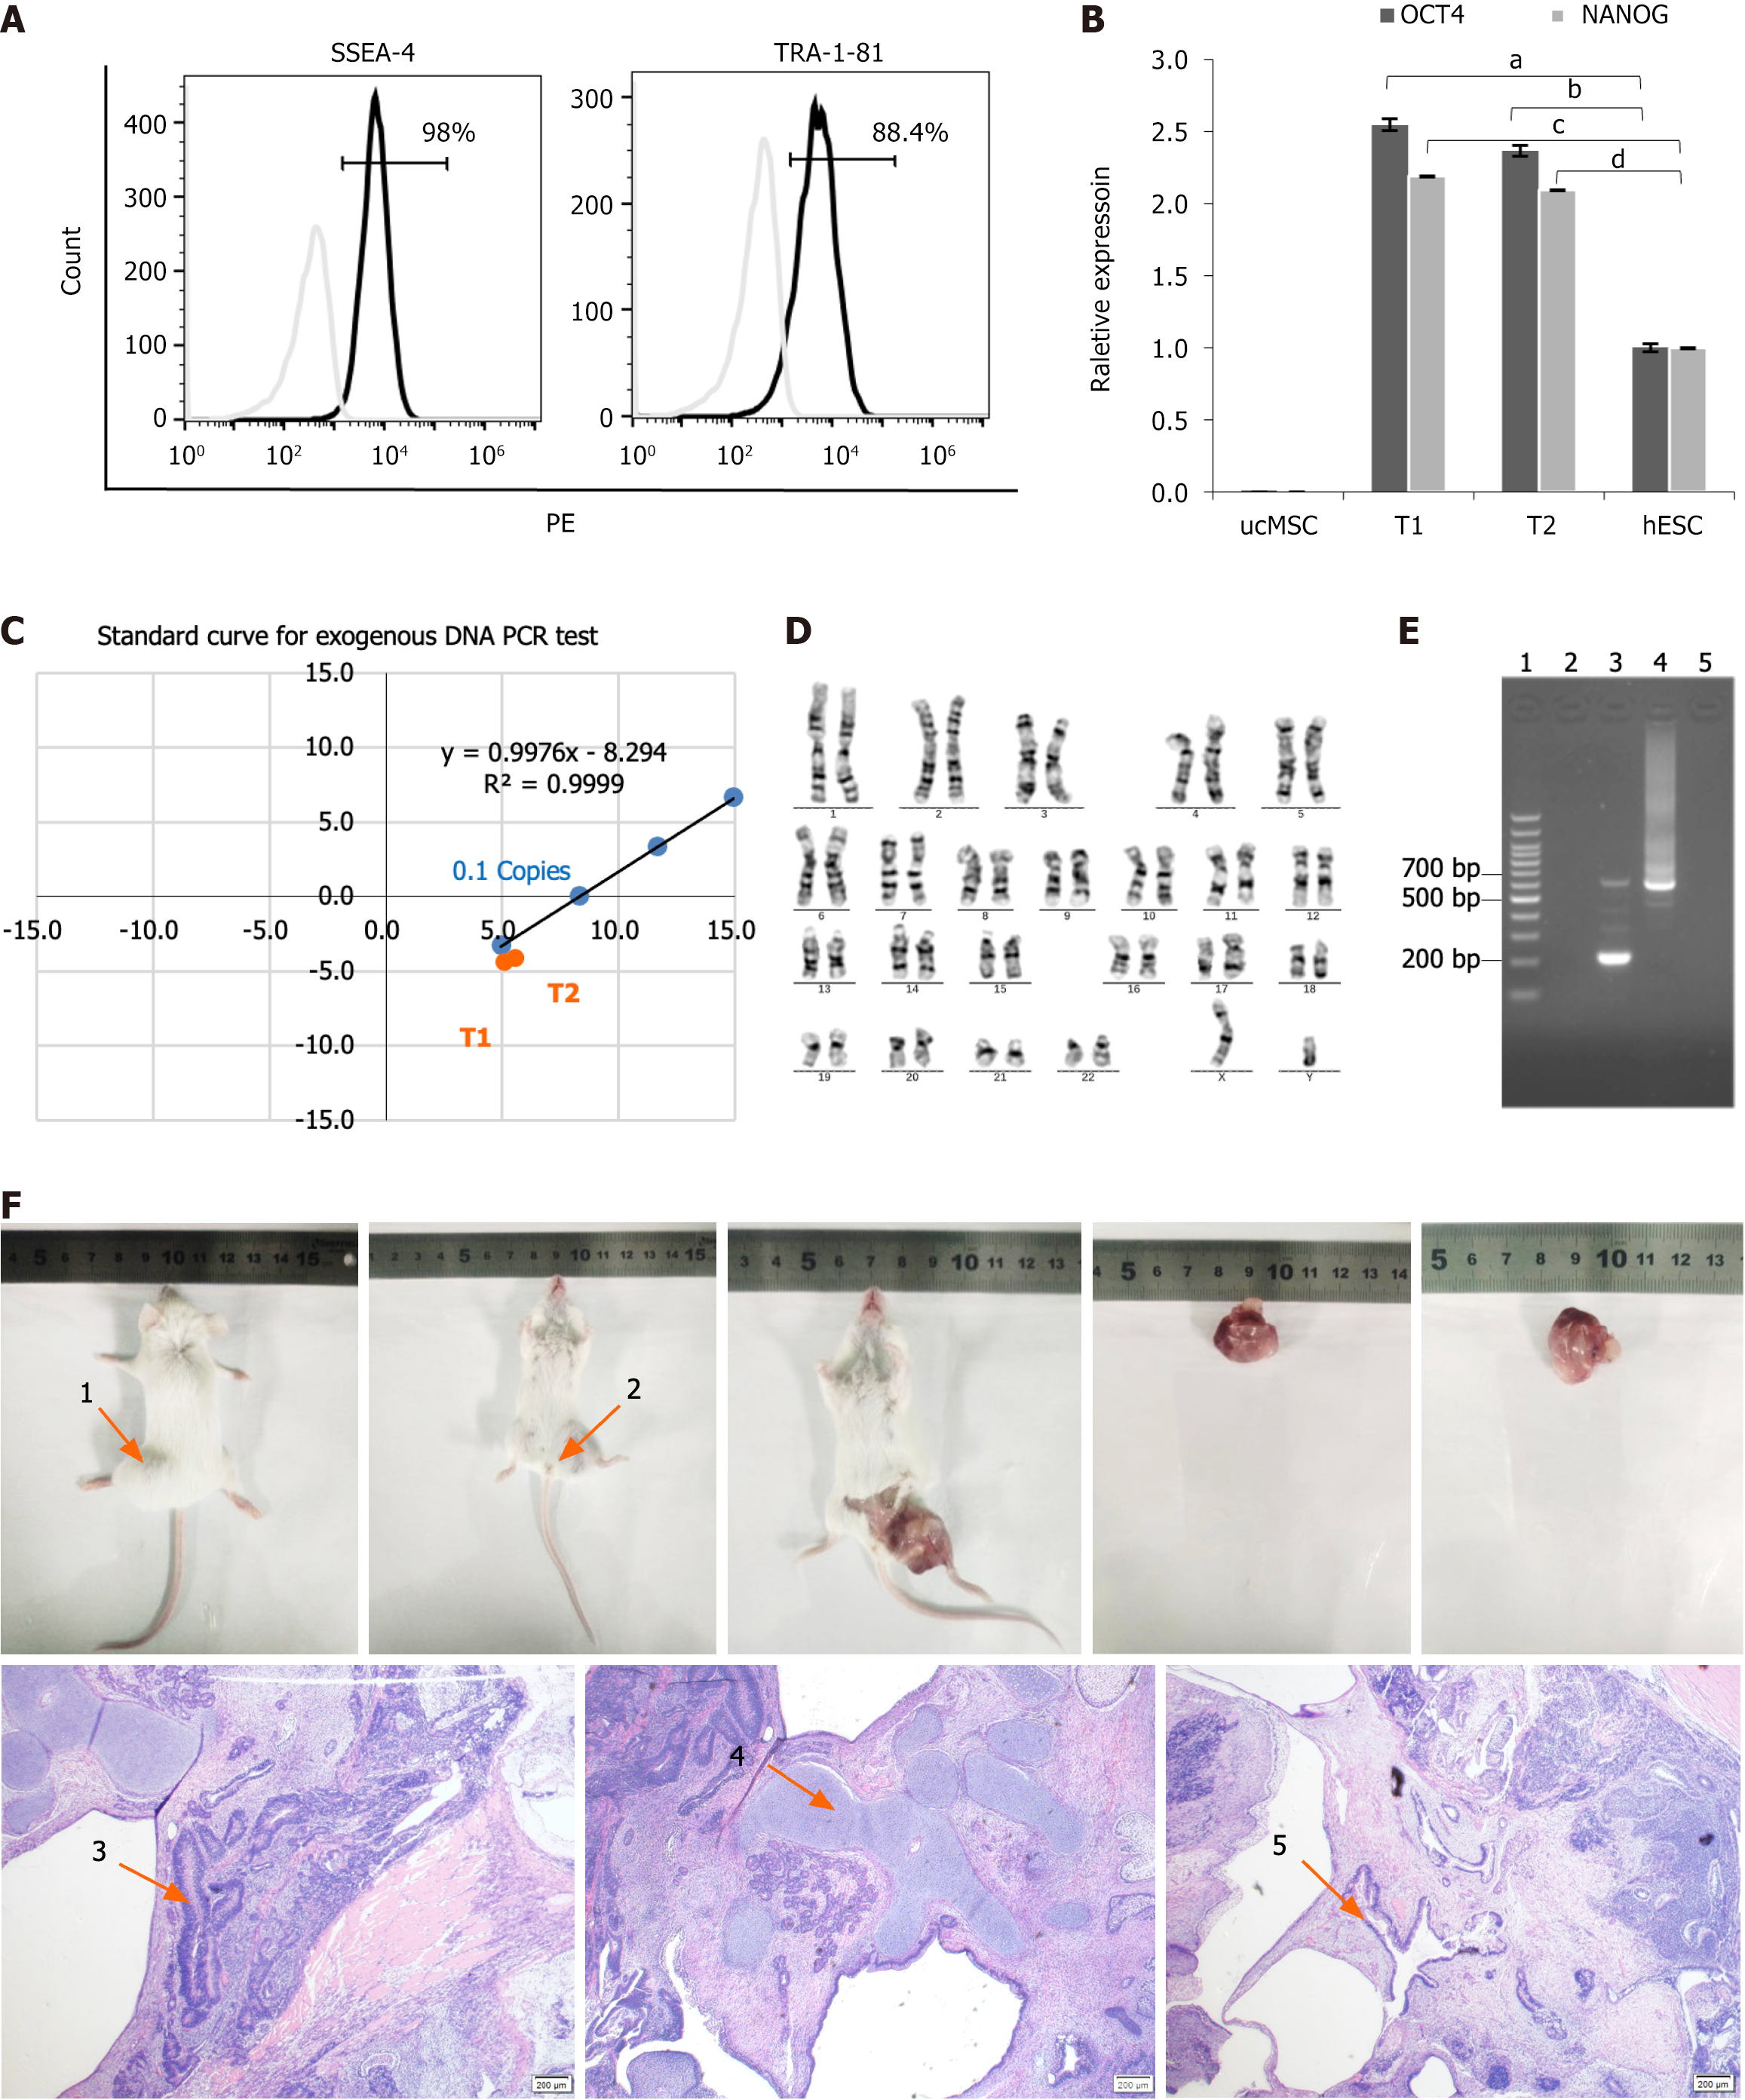
Figure 2 Comprehensive characterization of type 1 diabetes patient-derived induced pluripotent stem cells.
A: Flow cytometry analysis of pluripotency surface markers. SSEA4+/TRA-1-81+ expression levels were analyzed using flow cytometry (98% and 88.4%, respectively). Type 1 diabetes (T1D)-induced pluripotent stem cells (iPSCs) were labeled with PE-conjugated SSEA4 and TRA-1-81 antibodies; B: The quantitative real-time polymerase chain reaction (qRT-PCR) quantification of core pluripotency factors. The OCT4+/NANOG+ expression in T1D-iPSCs was quantified using qRT-PCR (human embryonic stem cell = 1), demonstrating a significant increase relative to human ESCs and umbilical cord mesenchymal stem cells (OCT4, 2.55 ± 0.04 vs 1.00 ± 0.028; aP < 0.01; 2.37 ± 0.36 vs 1.00 ± 0.028; bP < 0.01; NANOG, 2.19 ± 0.001 vs 1.00 ± 0.003, cP < 0.01; 2.09 ± 0.001 vs 1.00 ± 0.003, dP < 0.01); C: Validation of exogenous gene silencing. The absence of exogenous gene interference in T1D-iPSCs was validated using qRT-PCR of Ct values for OCT4, gEBNA1, and gOrip under an exogenous gene standard curve. The red dots indicate the positions of samples T1 and T2 within the shaded area, indicating that the Y(n) values were < 0.1 copies of Y (0.1), thus confirming the absence of exogenous genes; D: Genomic stability assessment. Chromosomal karyotyping was performed to assess the genomic stability of T1D-iPSCs, revealing 46 chromosomes with an XY composition. G-banding analysis of 20 mitotic phases confirmed a normal karyotype without numerical or structural abnormalities observed; E: Mycoplasma testing. PCR products for mycoplasma detection from T1D-iPSCs were negative, as demonstrated by gel electrophoresis, including: 1 = 100 bp plus DNA ladder; 2 = negative control; 3 = positive control (kit); 4 = positive control (infected samples); 5 = T1D-iPSCs; F: Teratoma formation assay. The teratoma formation assay indicated normal differentiation across all three germ layers. The teratomas were in the prone (arrow 1) and supine (arrow 2) positions. Microscopy (40 ×) of hematoxylin and eosin-stained sections revealed ectodermal differentiation (arrow 3), neural tissue with histiocytes; mesodermal differentiation (arrow 4), cartilage tissue with histiocytes; endodermal differentiation (arrow 5), and intestinal epithelium with histiocytes. aP < 0.01; bP < 0.01; cP < 0.01; dP < 0.01. ucMSC: Umbilical cord mesenchymal stem cell; hESC: Human embryonic stem cell; PCR: Polymerase chain reaction.
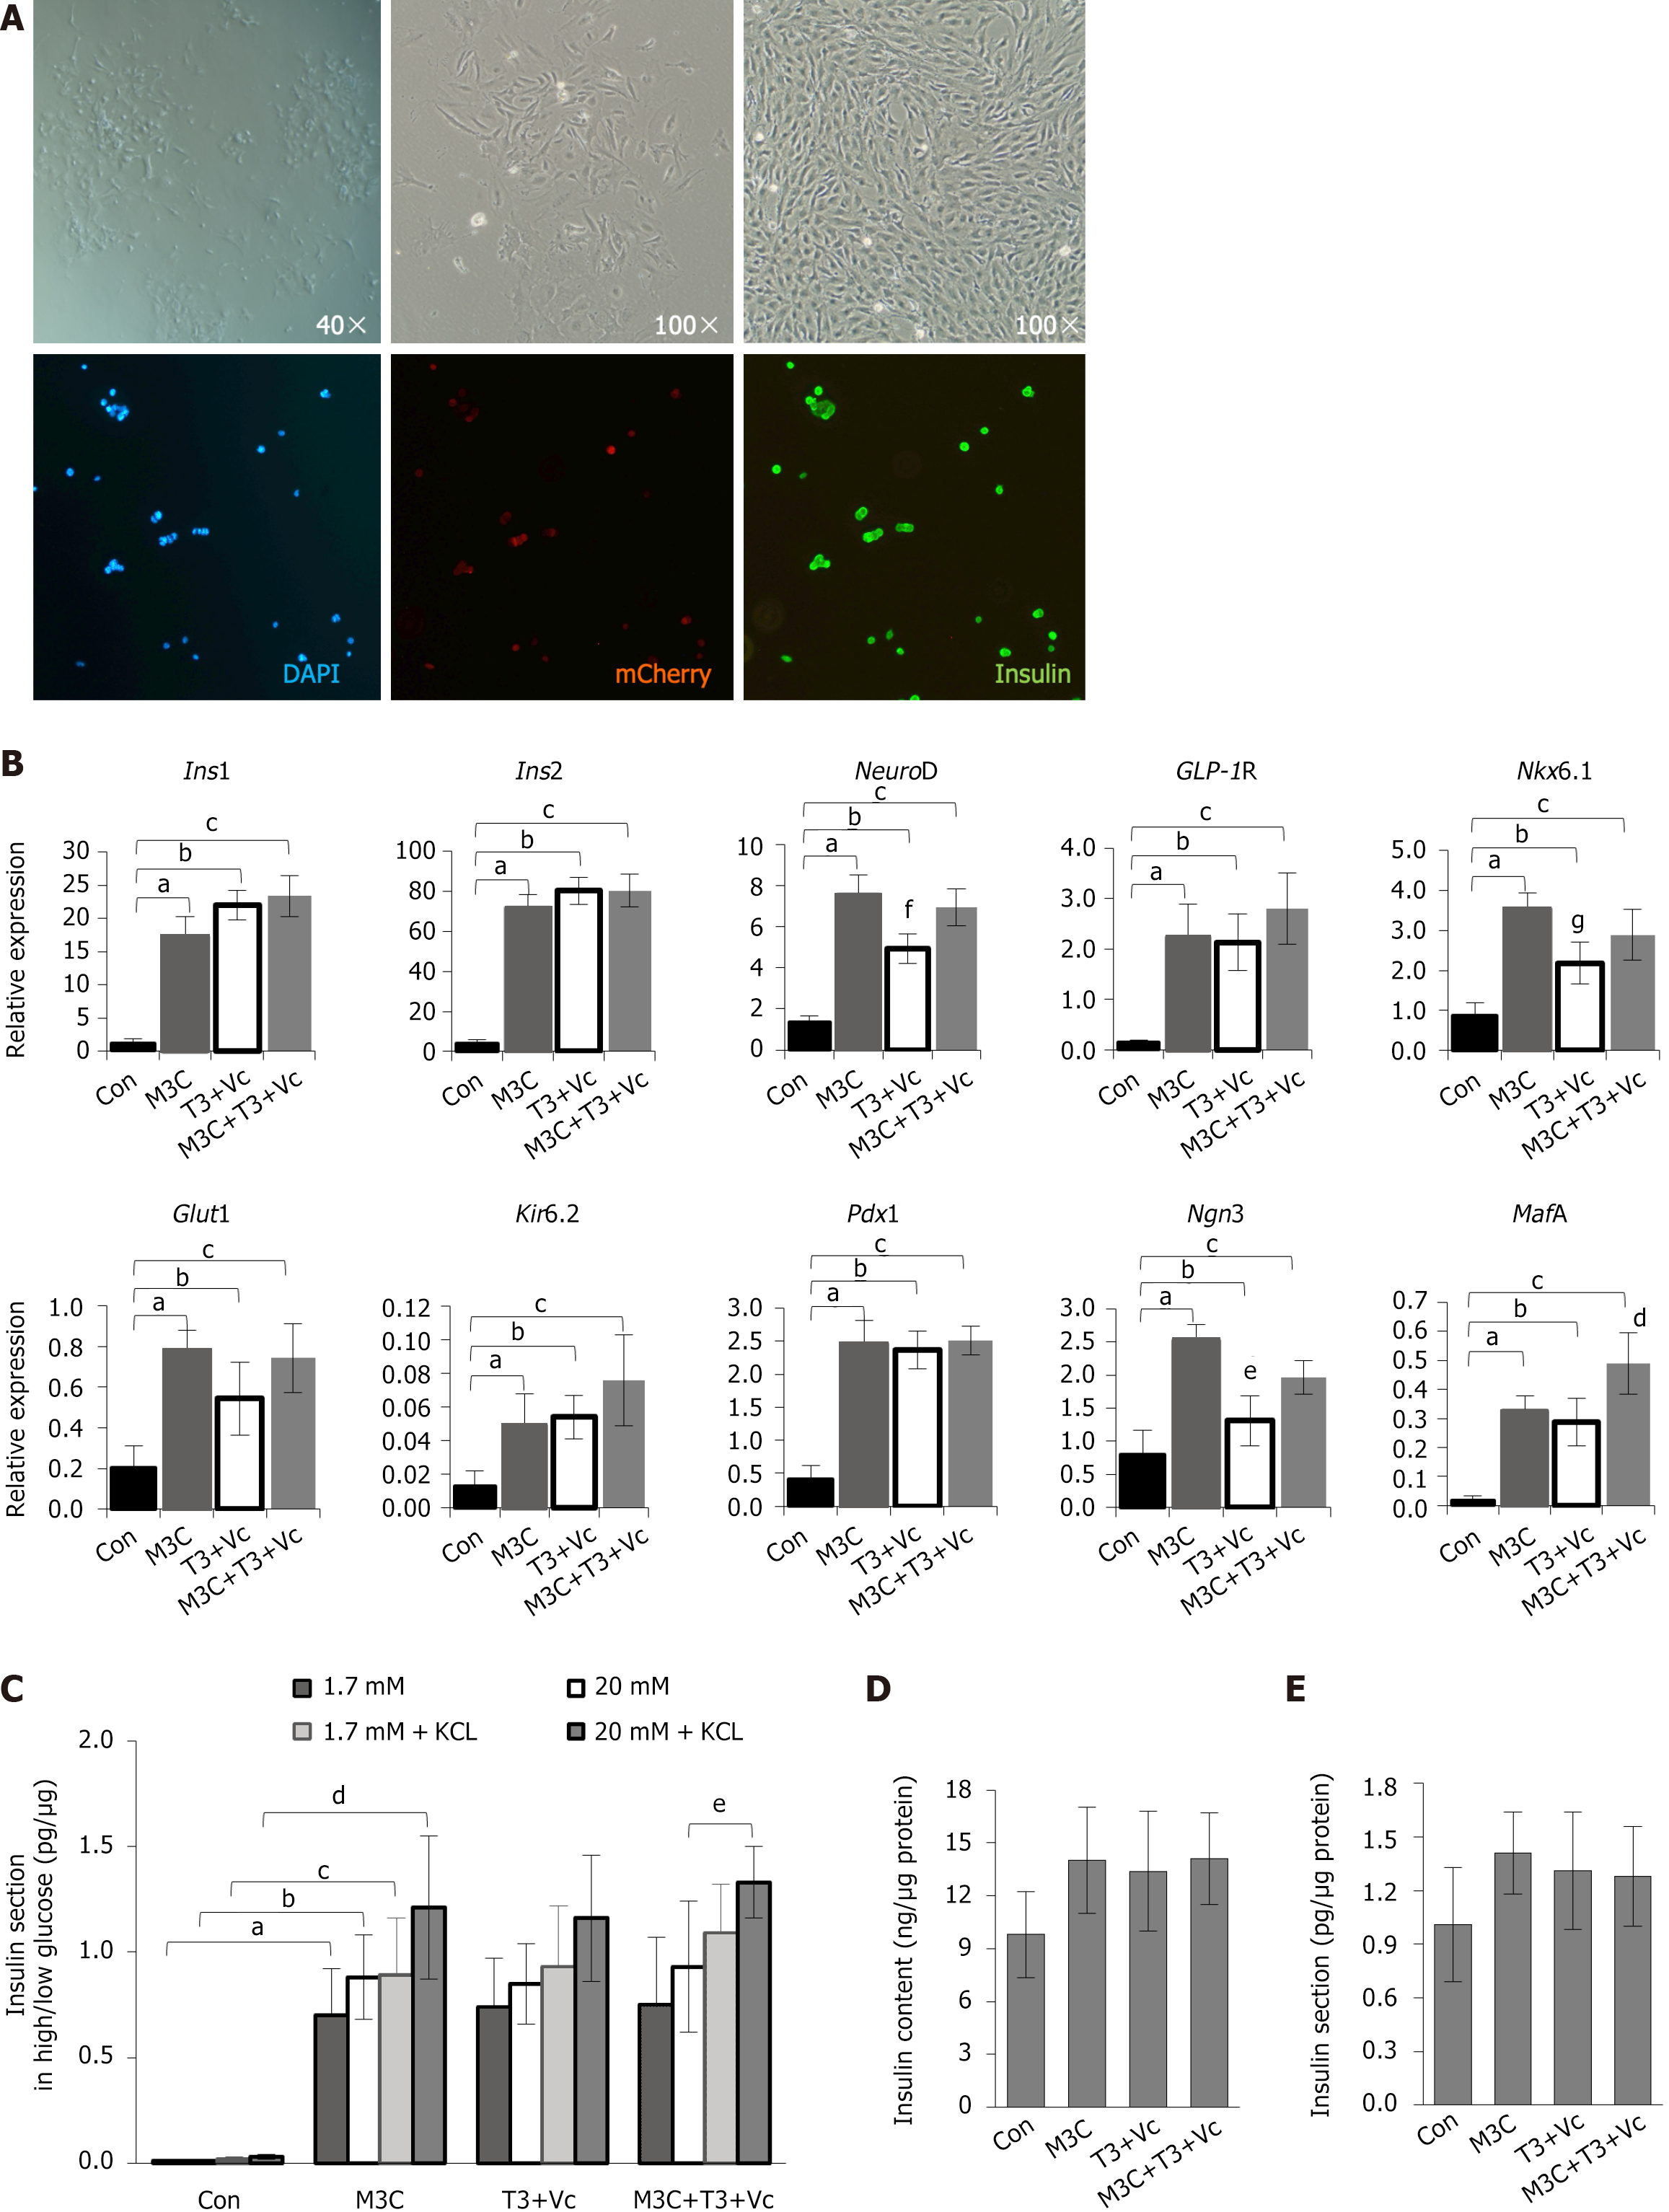
Figure 3 Characterization of type 1 diabetes-β-like cells: Morphology, molecular marker expression, and insulin secretion function.
A: Morphological and phenotypic analysis of differentiated cells. Type 1 diabetes (T1D)-induced pluripotent stem cells were induced to differentiate into T1D-β-like cells in vitro. Before induction, the adherent cells displayed clonal growth and transitioned into spindle- or rod-shaped monolayers. Post-induction, these cells exhibited a distinct oval, stone-like appearance, differing in size and shape from mature pancreatic β-cells. Immunofluorescence staining confirmed the co-expression of mCherry+ (red) and insulin+ (green) in these cells, indicating the presence of both markers; B: The quantitative real-time polymerase chain reaction analysis of β-cell marker expression. The expression of β-cell markers (insulin 1, insulin 2, NeuroD, glucagon-like peptide-1 receptor, Nkx6.1, glucose transporter 2, Kir62, pancreatic duodenal homeobox-1, neurogenin 3, and MAF bZIP transcription factor A) was significantly elevated in M3C, triiodothyronine (T3) + vitamin C (Vc), and M3C + T3 + Vc groups compared to that in undifferentiated T1D-induced pluripotent stem cells (blank control). Data are expressed as mean ± SD (n = 3 samples per group). Statistical significance was assessed using Student’s t-test (insulin 1, aP < 0.01, bP < 0.01, cP < 0.01; insulin 2, aP < 0.01, bP < 0.01, cP < 0.01; NeuroD, aP < 0.01, bP < 0.01, cP < 0.01, fP < 0.05, T3 + Vc group compared with other three experimental groups; GLP1R, aP < 0.01, bP < 0.01, cP < 0.01; Nkx6.1, aP < 0.01, bP < 0.01, cP < 0.01, gP < 0.05, T3 + Vc group compared with other three experimental groups; Glut2, aP < 0.01, bP < 0.01, cP < 0.01; Kir6.2, aP < 0.01, bP < 0.01, cP < 0.01; Pdx1, aP < 0.01, bP < 0.01, cP < 0.01; Ngn3, aP < 0.01, bP < 0.05, cP < 0.05, eP < 0.01, T3 + Vc group compared with other three experimental groups; MafA, aP < 0.01, bP < 0.01, cP < 0.01, dP < 0.05, M3C + T3 + Vc group compared with other three experimental groups); C: Glucose-stimulated insulin secretion. Glucose-stimulated insulin secretion was assessed using total protein (μg) levels in parallel wells as a standard. Insulin secretion (pg) elicited by 1.7 mmol/L and 20 mmol/L glucose was analyzed and expressed as a ratio (pg/μg) with mean ± SD (n = 6 samples per group). Statistical significance was determined using Student’s t-test. The results indicated that M3C, T3 + Vc, and M3C + T3 + Vc groups did not significantly respond to varying glucose concentrations (1.7 mmol/L vs 20 mmol/L), with limited increases. Insulin secretion was significantly higher in the M3C + T3 + Vc group under elevated glucose (20 mmol/L) with 30 mmol/L KCl than that in the same group without KCl (1.33 ± 0.17 vs 0.93 ± 0.31, eP < 0.05). Insulin output in all experimental groups (M3C, T3 + Vc, and M3C + T3 + Vc) was significantly greater than that of the control group under all conditions (aP < 0.01, bP < 0.01, cP < 0.01, dP < 0.01); D: Intracellular insulin content. ELISA was used to quantify the intracellular insulin content (ng) of T1D-β-like cells compared to the total protein (μg) of control cells (ng/μg). The results are expressed as mean ± SD (n = 6 samples per group), and statistical significance was assessed using Student’s t-test. No significant differences were observed in the increase in intracellular insulin content among M3C, T3 + Vc, and M3C + T3 + Vc groups; E: Basal insulin secretion. Another ELISA analyzed the insulin secretion levels (pg) from T1D-β-like cells, also reported as a ratio to total protein (μg) in control cells (pg/μg). Data are presented as mean ± SD (n = 6 samples per group), with statistical significance determined by Student’s t-test. Again, no notable differences were detected in the increase of extracellular insulin secretion across M3C, T3 + Vc, and M3C + T3 + Vc groups. Ins1: Insulin 1; Ins2: Insulin 2; GLP-1R: Glucagon-like peptide-1 receptor; Glut2: Glucose transporter 2; Pdx1: Pancreatic duodenal homeobox-1; Ngn3: Neurogenin 3; MafA: MAF bZIP transcription factor A; T3: Triiodothyronine; Vc: Vitamin C.
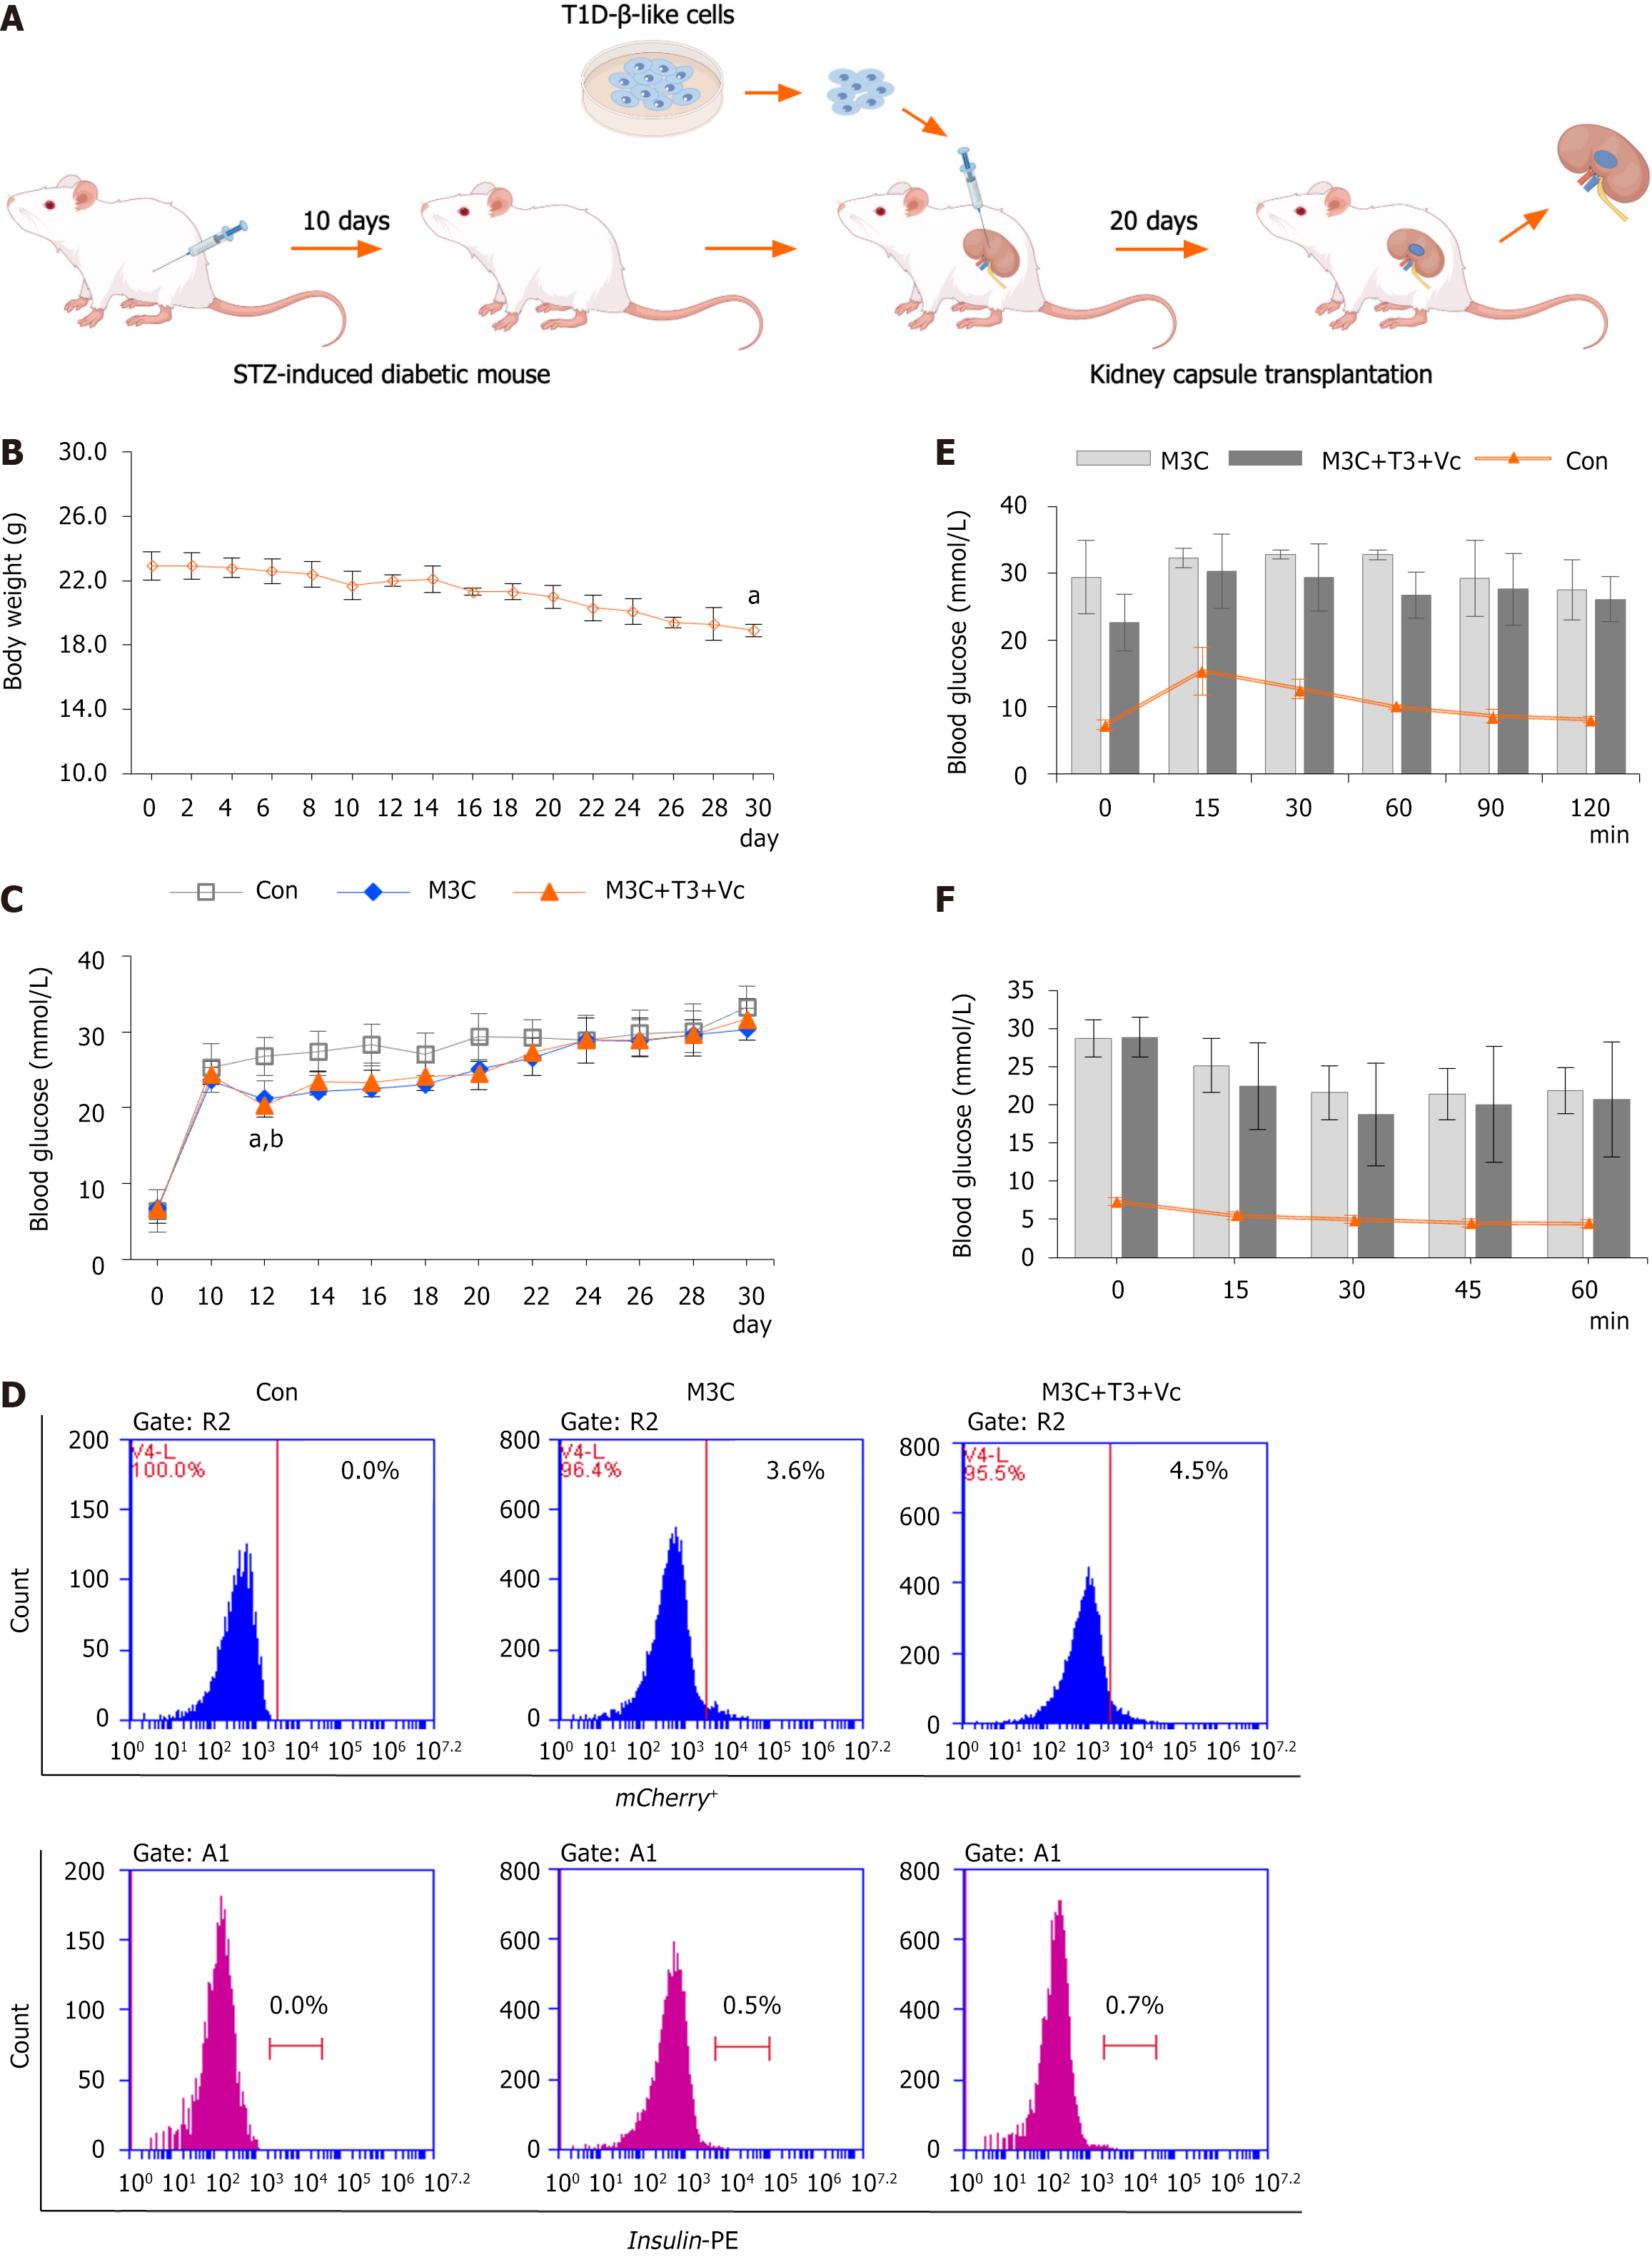
Figure 4 Regulation of hyperglycemia by type 1 diabetes-β-like cells in diabetic mice.
A: Schematic of renal subcapsular transplantation. Schematic representation of the process involved in subcapsular kidney transplantation of type 1 diabetes (T1D)-β-like cells aimed at regulating blood glucose levels in streptozotocin-induced diabetic mice; B: Longitudinal body weight monitoring. Body weight measurements in streptozotocin-induced diabetic mice demonstrated a gradual decline starting from the onset of the experiment, continuing throughout the entire 30-day duration until study completion (n = 15, 18.90 ± 0.40 vs 22.9 ± 0.89, aP < 0.01); C: Random blood glucose profiles. Random blood glucose assessments in the tail vein of mice from each diabetic group (n = 5 samples per group) showed that following transplantation of T1D-β-like cells under the renal capsule (performed on day 10 post-modeling), blood glucose levels in the M3C and M3C + triiodothyronine (T3) + vitamin C (Vc) groups decreased significantly over 2 days, compared to the control (21.16 ± 2.13 vs 26.8 ± 2.51; 20.3 ± 1.50 vs 26.8 ± 2.51; aP < 0.01, bP < 0.01, M3C and M3C + T3 + Vc group compared with the control group, respectively). However, glucose levels rose again and stabilized at high levels, with no statistically significant differences relative to the control group; D: Flow cytometry analysis of grafted cells. Flow cytometry results indicated an increase in the percentages of insulin+ (0.5%, 0.7%) and mCherry+ (3.8%, 4.5%) cells compared to isotype-negative controls 20 days post-transplantation, though no significant difference was noted between the M3C and M3C + T3 + Vc groups; E: Intraperitoneal glucose tolerance test. Intraperitoneal glucose tolerance test (n = 5 samples per group), M3C and M3C + T3 + Vc groups initially registered high blood glucose levels which peaked at 15 minutes, subsequently decreasing at the 60th and 90th minutes. In contrast, blood glucose in the control group began to decrease post 15 minutes, but no significant differences were observed between the M3C and M3C + T3 + Vc groups; F: Insulin tolerance test in transplanted mice. Insulin tolerance test (n = 5 samples per group), post-intraperitoneal insulin injections, blood glucose levels in the tails of M3C and M3C + T3 + Vc mice reached their lowest at the 30-minute mark before rising again. This pattern was consistent in the control group, where levels also decreased after 15 minutes, with no significant differences between the M3C and M3C + T3 + Vc groups. T1D: Type 1 diabetes; STZ: Streptozotocin; T3: Triiodothyronine; Vc: Vitamin C.
- Citation: Wang K, Lin W, Han JY, Chen JY, Liu RH, Yu Z, Jin JJ. Differentiation of patient-specific induced pluripotent stem cells derived from type 1 diabetes peripheral blood mononuclear cells into pancreatic β-like cells. World J Stem Cells 2025; 17(7): 104607
- URL: https://www.wjgnet.com/1948-0210/full/v17/i7/104607.htm
- DOI: https://dx.doi.org/10.4252/wjsc.v17.i7.104607


