Copyright
©The Author(s) 2025.
World J Stem Cells. Apr 26, 2025; 17(4): 101290
Published online Apr 26, 2025. doi: 10.4252/wjsc.v17.i4.101290
Published online Apr 26, 2025. doi: 10.4252/wjsc.v17.i4.101290
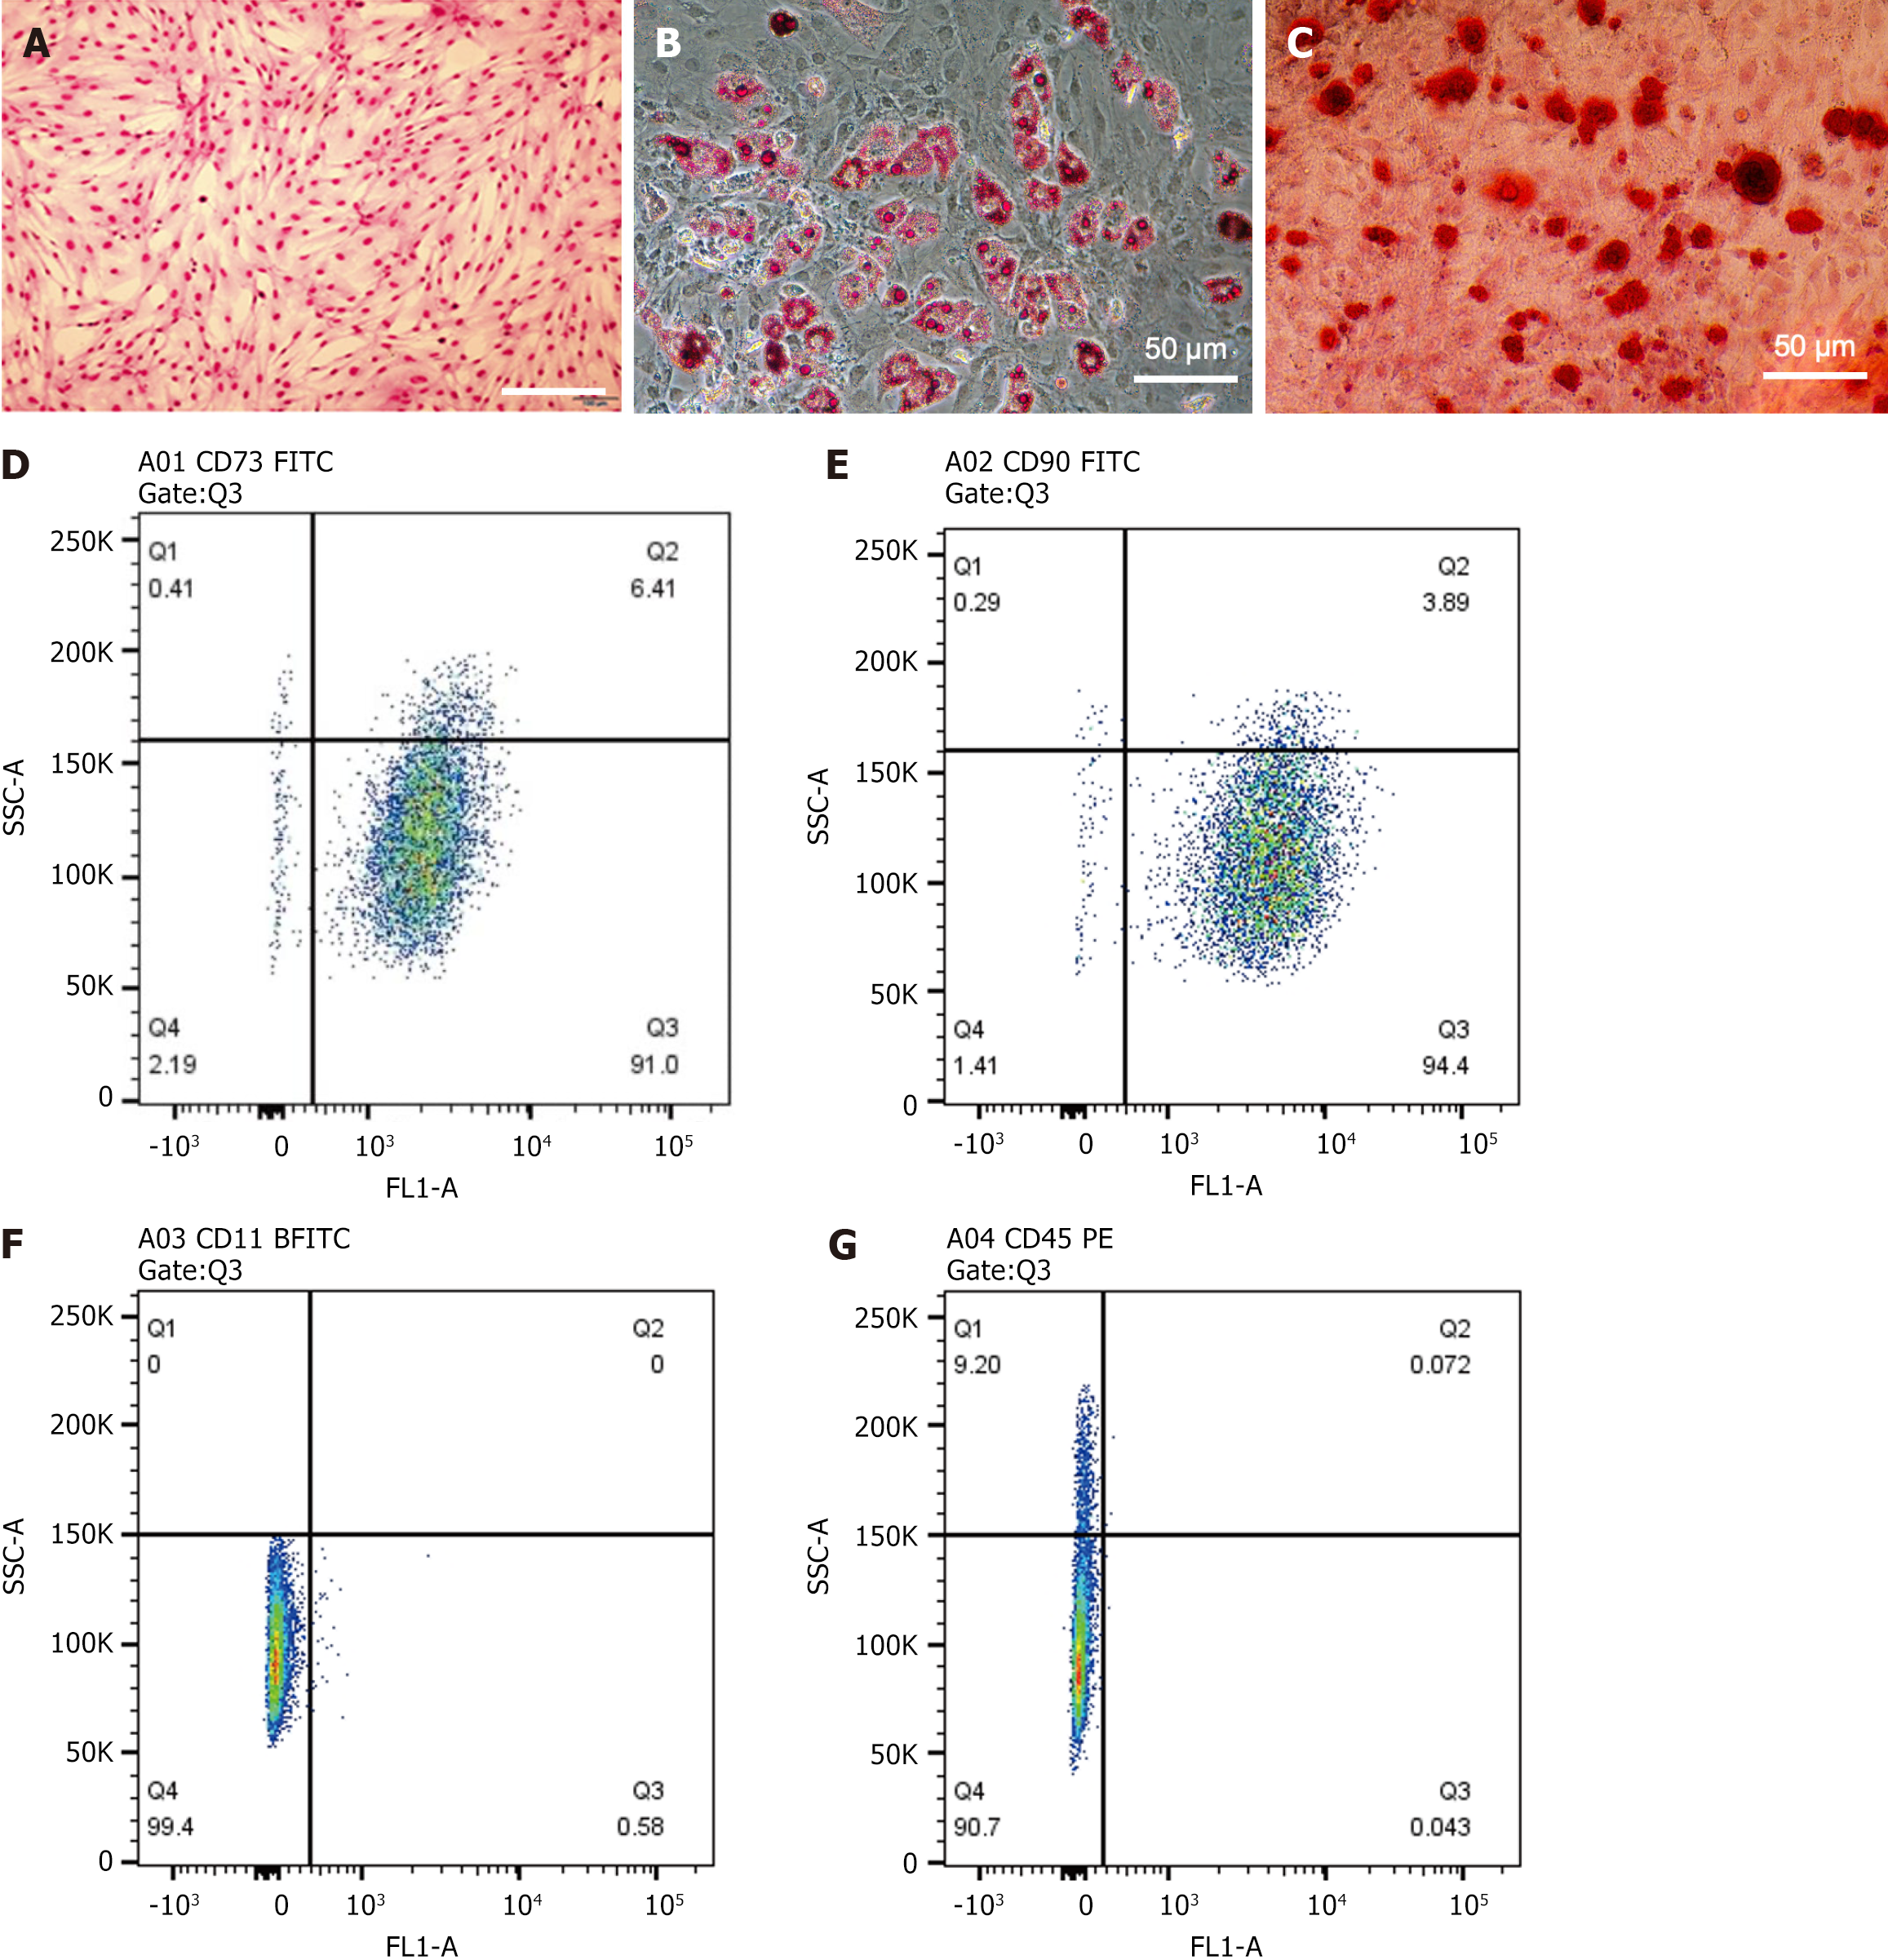
Figure 1 Cultured bone marrow-derived mesenchymal stem cells micrographs and flow cytometry analysis.
A: Microscopic image of bone marrow-derived mesenchymal stem cells (BMSCs) after Giemsa staining (scale bar = 200 μm); B: Microscopic image of BMSCs stained with Oil Red O on day 21 (scale bar = 200 μm); C: Microscopic image of BMSCs stained with Alizarin Red on day 21 (scale bar = 200 μm); D and E: Flow cytometry analysis of CD73 (D) and CD90 (E) expression in cultured BMSCs; F and G: Flow cytometry analysis of CD11B (F) and CD45 (G) expression in cultured BMSCs. The results show that over 95% of cultured BMSCs express the mesenchymal stem cell markers CD73 and CD90, while less than 2% of BMSCs express the hematopoietic stem cell markers CD11B and CD45.
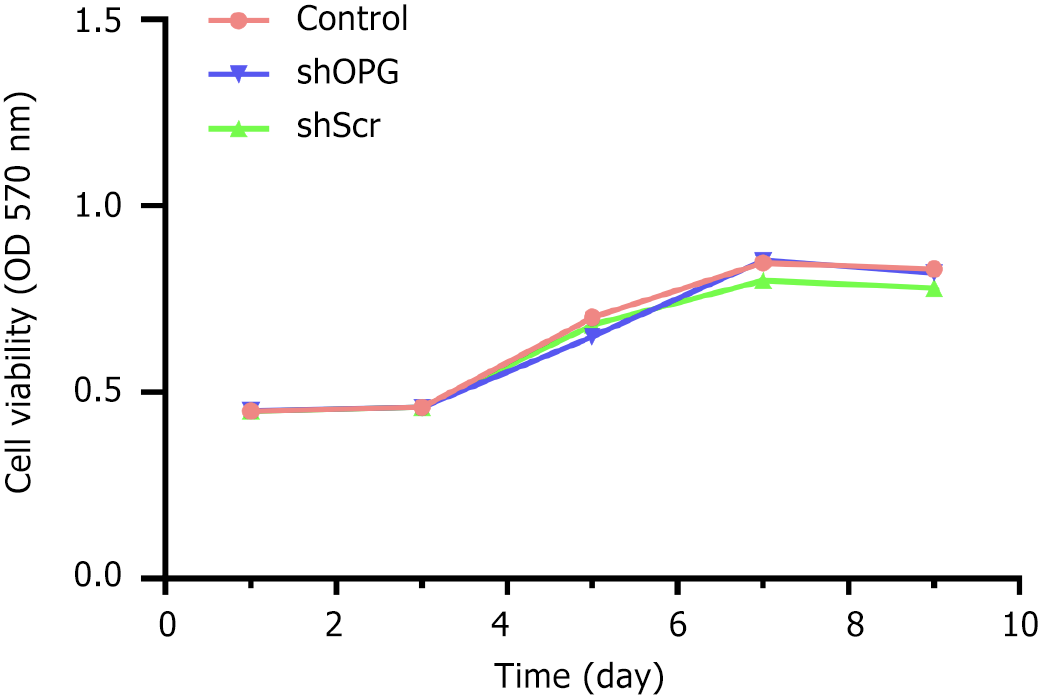
Figure 2 MTT assay to detect changes in cell proliferation in each group.
The cell proliferation growth curves for each group were plotted with time on the X-axis and absorbance (A value) on the Y-axis. The experimental group, “shOPG”, represents osteoprotegerin gene-silenced bone marrow-derived mesenchymal stem cells (BMSCs) transfected with shOPG. The control group, “shScr”, consists of BMSCs transfected with a scrambling vector, while the “control” group includes untreated BMSCs.
Figure 3 The mRNA levels of receptor activator of nuclear factor-kappa B ligand and osteoprotegerin genes in each group.
A and B: On the 3rd, 7th, 14th, and 21st day post-transfection, real-time quantitative polymerase chain reaction was used to evaluate the mRNA levels of osteoprotegerin (OPG) (A) and receptor activator of nuclear factor-kappa B ligand (RANKL) (B) in each group. The experimental group, “shOPG”, represents OPG gene-silenced bone marrow-derived mesenchymal stem cells (BMSCs) transfected with shOPG, while the control groups, “shScr” and “control”, represent BMSCs transfected with a scramble vector and untreated BMSCs, respectively. Compared to the shScr and control groups, RANKL was upregulated in shOPG-transfected BMSCs, particularly on day 3. Conversely, OPG expression was downregulated in shOPG-transfected BMSCs compared to the shScr and control groups (mean ± SEM, n = 3 experiments). aP < 0.05; bP < 0.01. BMSC: Bone marrow-derived mesenchymal stem cell; OPG: Osteoprotegerin; RANKL: Receptor activator of nuclear factor-kappa B ligand.
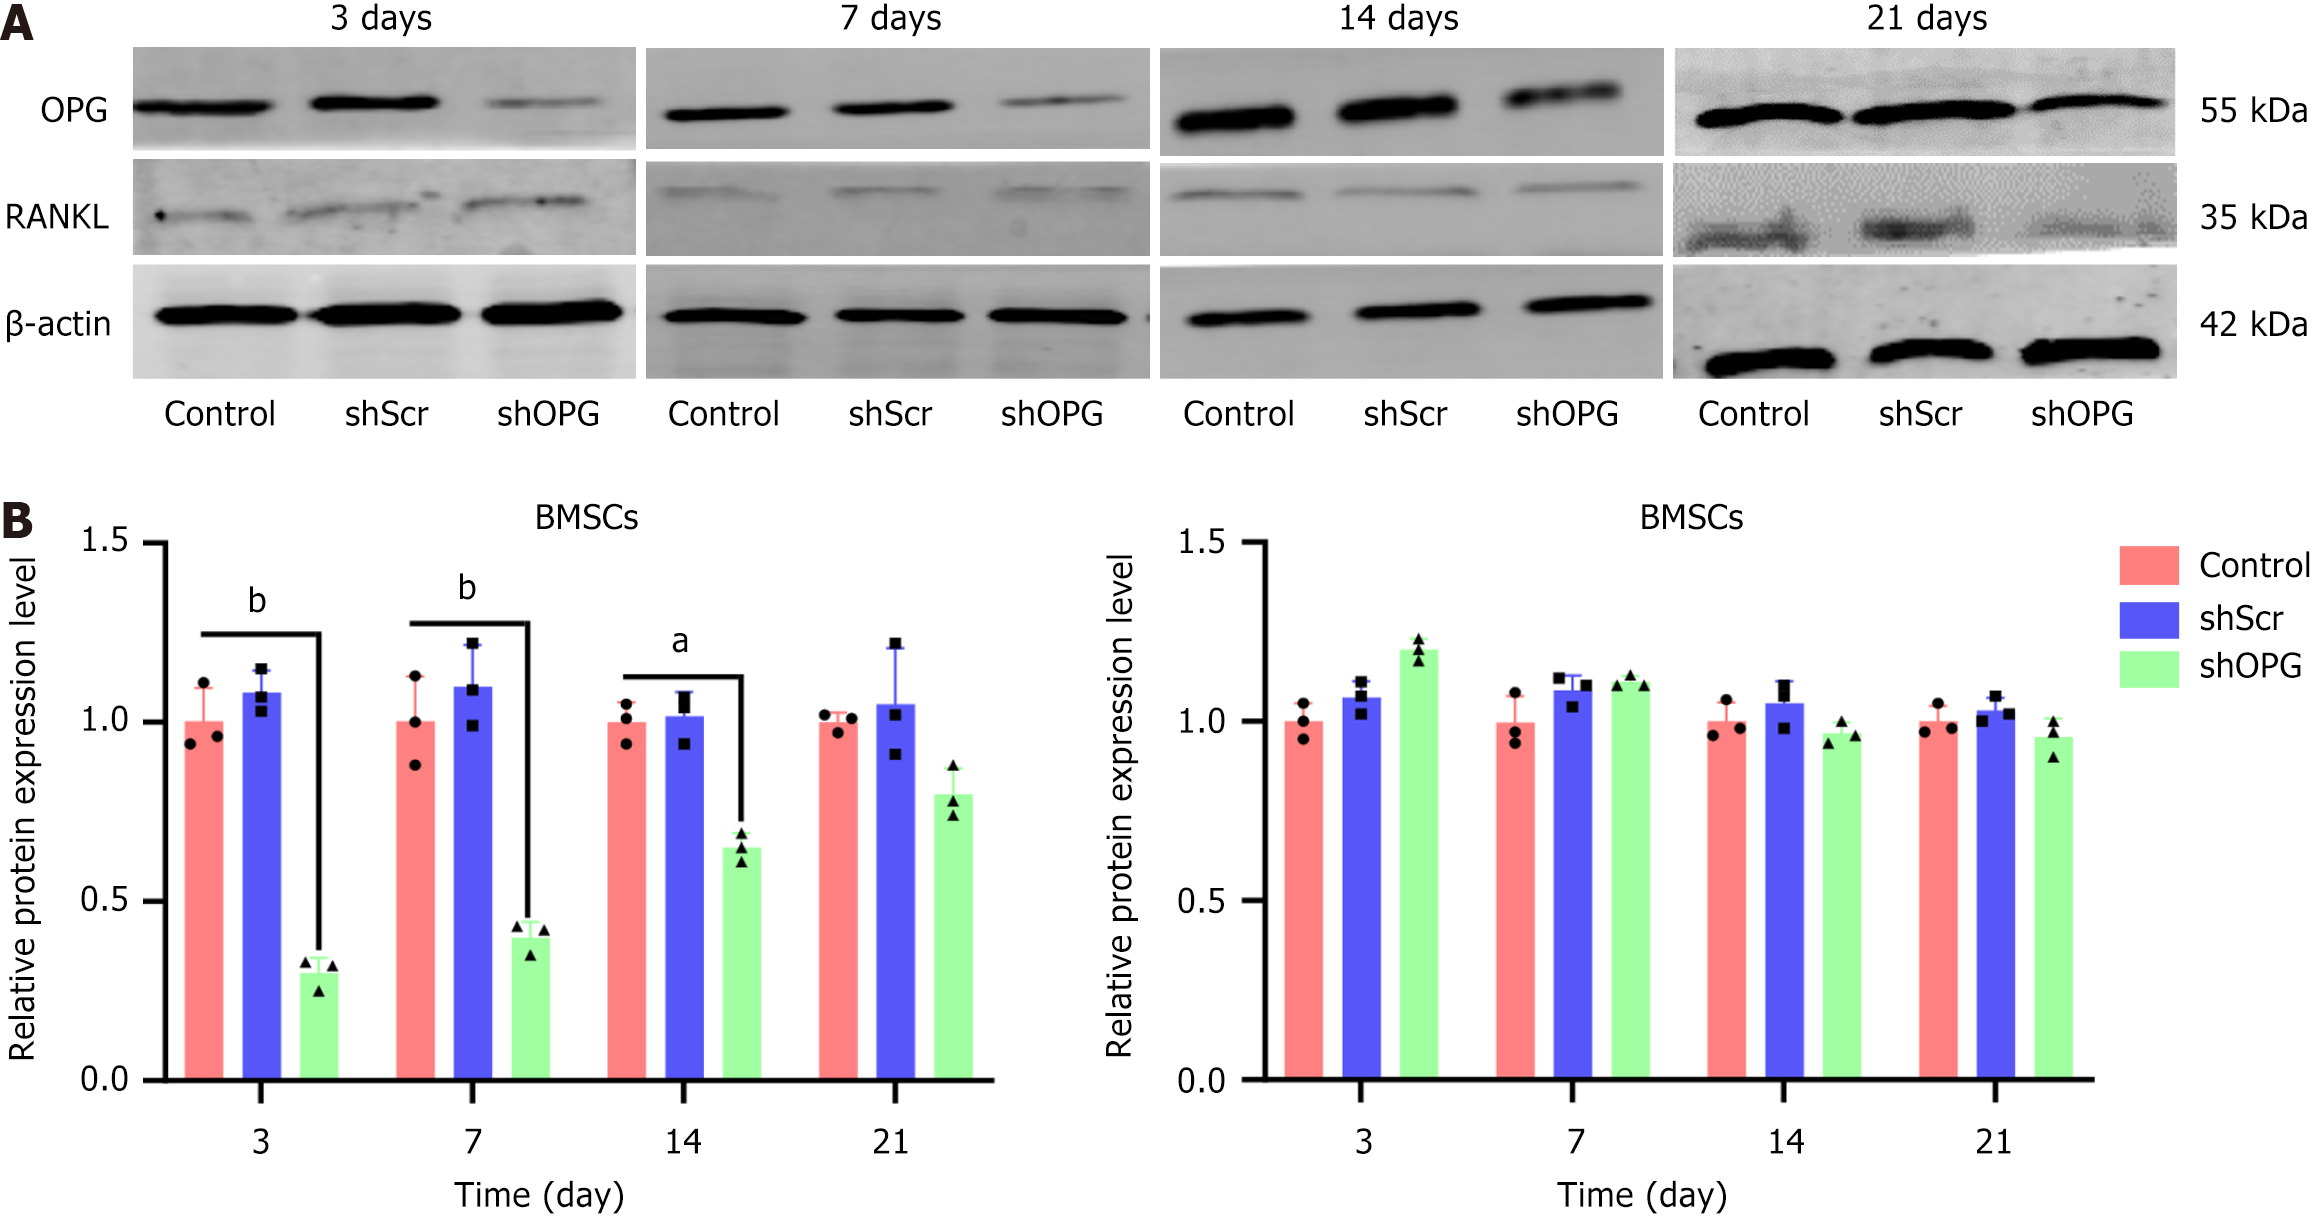
Figure 4 Protein levels of receptor activator of nuclear factor-kappa B ligand and osteoprotegerin in each group.
A and B: The western blot results of osteoprotegerin (OPG) and receptor activator of nuclear factor-kappa B ligand (RANKL) protein expression at different time points (3rd, 7th, 14th, and 21st days) after transfection with shScr or shOPG (A) and their quantitative analysis (B). The experimental group, “shOPG”, represents OPG gene-silenced bone marrow-derived mesenchymal stem cells (BMSCs) transfected with shOPG, while the control groups, “shScr” and “control”, represent BMSCs transfected with a scramble vector and untreated BMSCs, respectively. The data represent results from three independent experiments. Changes in RANKL and OPG protein levels in shOPG-transfected BMSCs were observed compared to the shScr and control groups (mean ± SEM, n = 3 experiments). aP < 0.05; bP < 0.01. BMSC: Bone marrow-derived mesenchymal stem cell; OPG: Osteoprotegerin; RANKL: Receptor activator of nuclear factor-kappa B ligand.
Figure 5 Receptor activator of nuclear factor-kappa B ligand/osteoprotegerin ratio of shOPG and shScr groups in mRNA and protein levels.
A and B: Time-dependent changes in the receptor activator of nuclear factor-kappa B ligand/osteoprotegerin (RANKL/OPG) mRNA (A) and protein (B) ratio following transfection with shScr or shOPG. The control group, “shScr”, represents bone marrow-derived mesenchymal stem cells transfected with a scramble vector, while the experimental group, “shOPG”, represents bone marrow-derived mesenchymal stem cells transfected with shOPG. Comparisons of RANKL/OPG mRNA and protein levels were conducted on the 3rd, 7th, 14th, and 21st days post-transfection between the “shOPG” and “shScr” groups. A comparison was made on the 3rd, 7th, 14th, and 21st days post-transduction with the control group. aP < 0.05; bP < 0.01 compared to the control group. OPG: Osteoprotegerin; RANKL: Receptor activator of nuclear factor-kappa B ligand.
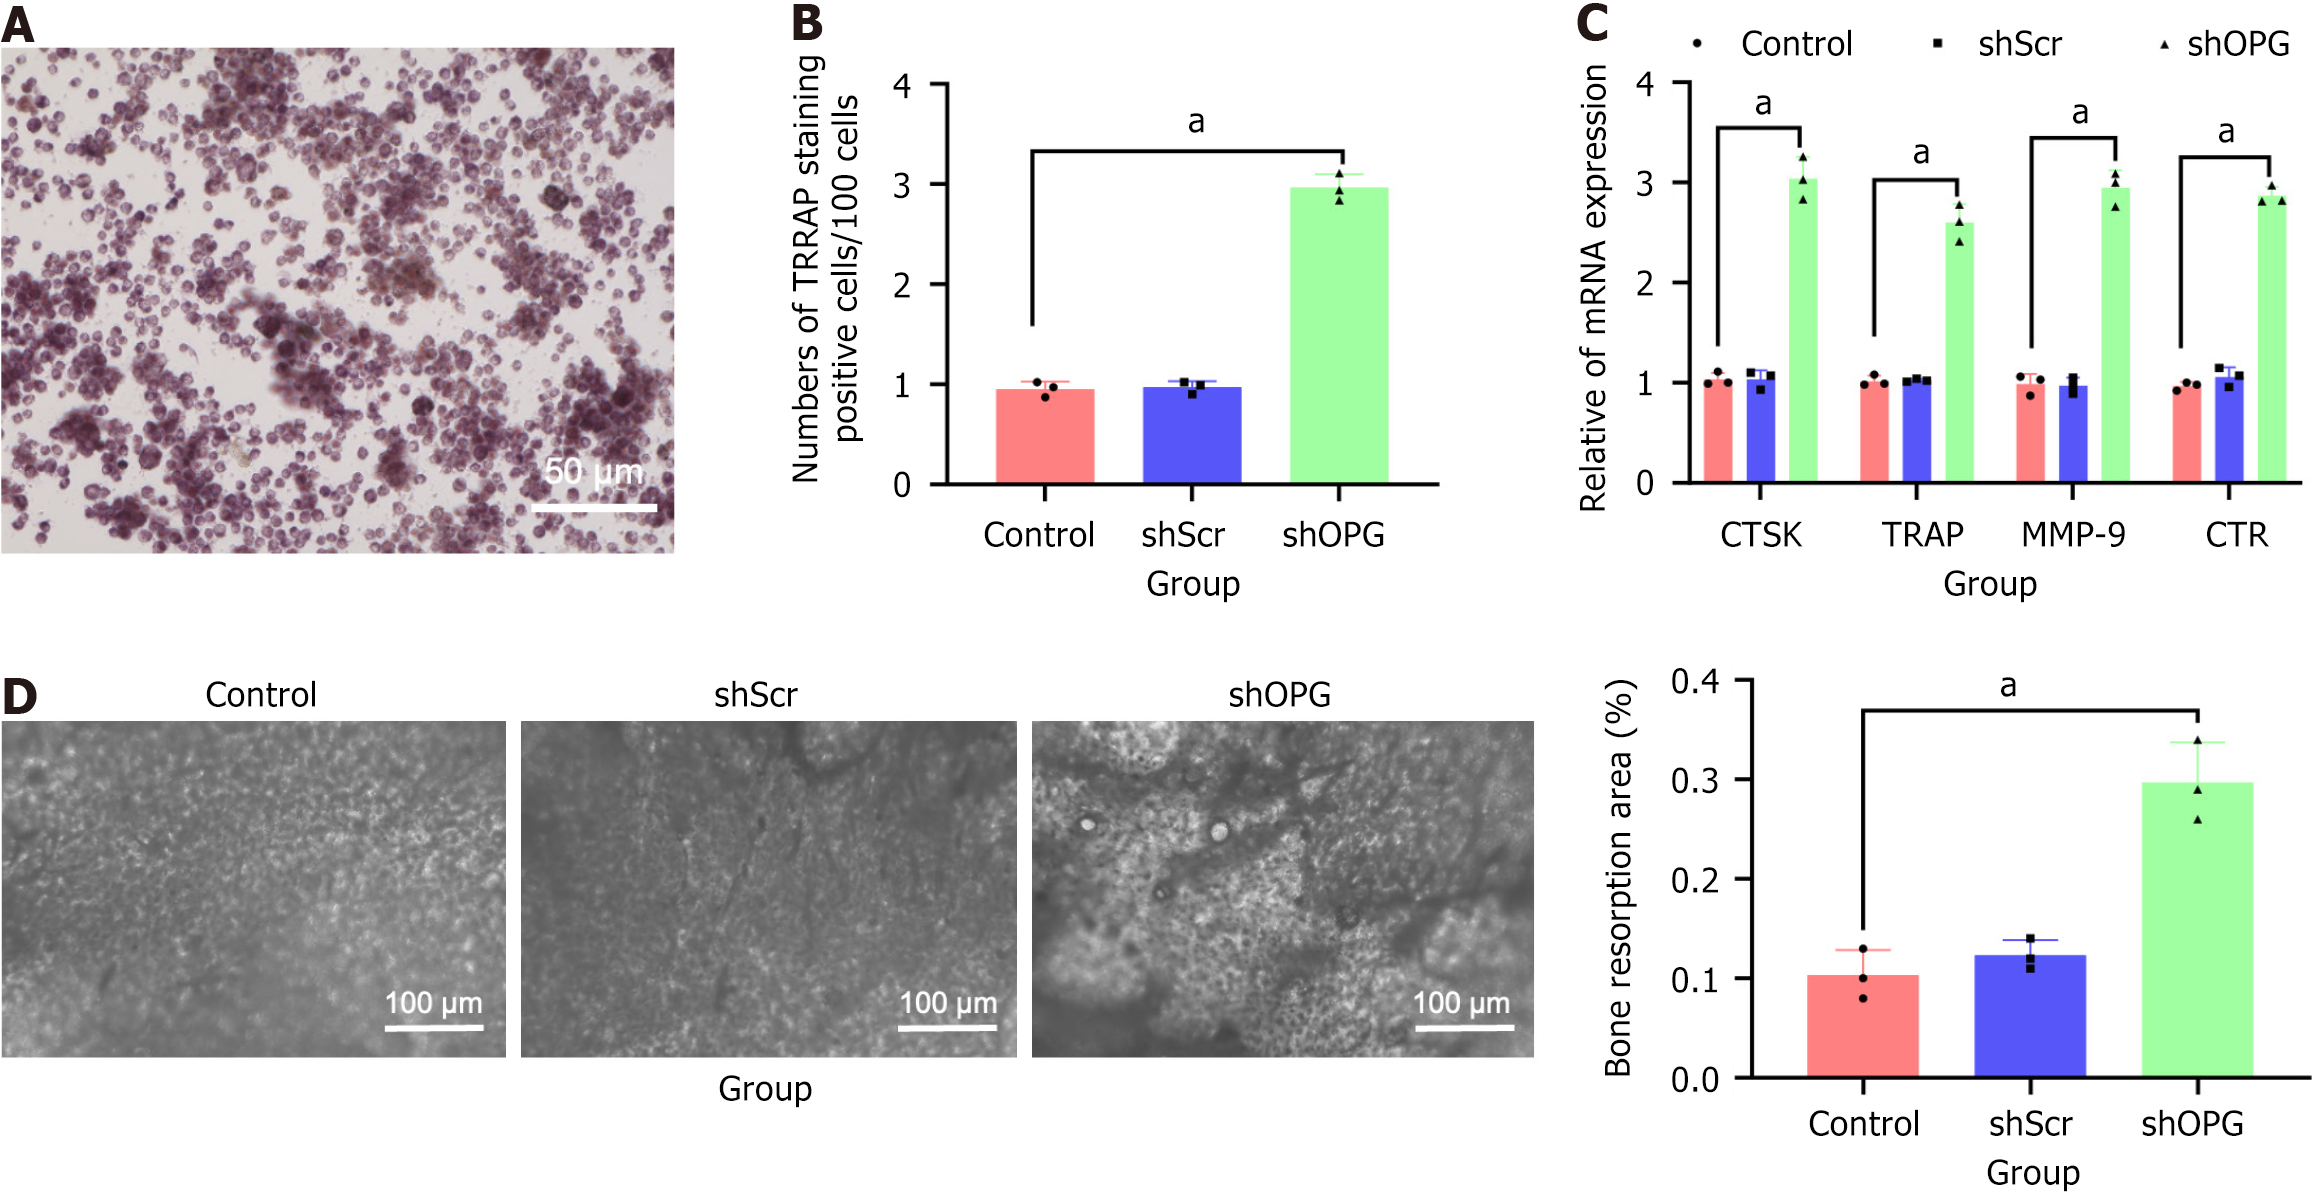
Figure 6 Representative regions of tartrate-resistant acid phosphatase-positive multinucleated cells in osteoclast generation experiment.
A and B: Results of tartrate-resistant acid phosphatase (TRAP)-positive multinucleated cells formed after 7 days of co-culture between the experimental group (shOPG bone marrow-derived mesenchymal stem cells) and non-adherent rat bone marrow stromal cells are shown in (A), along with the quantitative statistical analysis (B). TRAP-positive multinucleated cells (indicated by arrows; scale bar = 200 μm); C: Quantitative reverse transcription polymerase chain reaction analysis of mRNA levels of osteoclast marker genes cathepsin K, TRAP, matrix metalloproteinase-9, and receptors for calcitonin; D: Toluidine blue staining showing the proportion of resorption pit areas in co-cultured cells for each group, scale bar = 25 μm. Notably, the shOPG group exhibited significantly stronger osteoclast formation capability compared to the “shScr” and “control” groups. aP < 0.05. TRAP: Tartrate-resistant acid phosphatase.
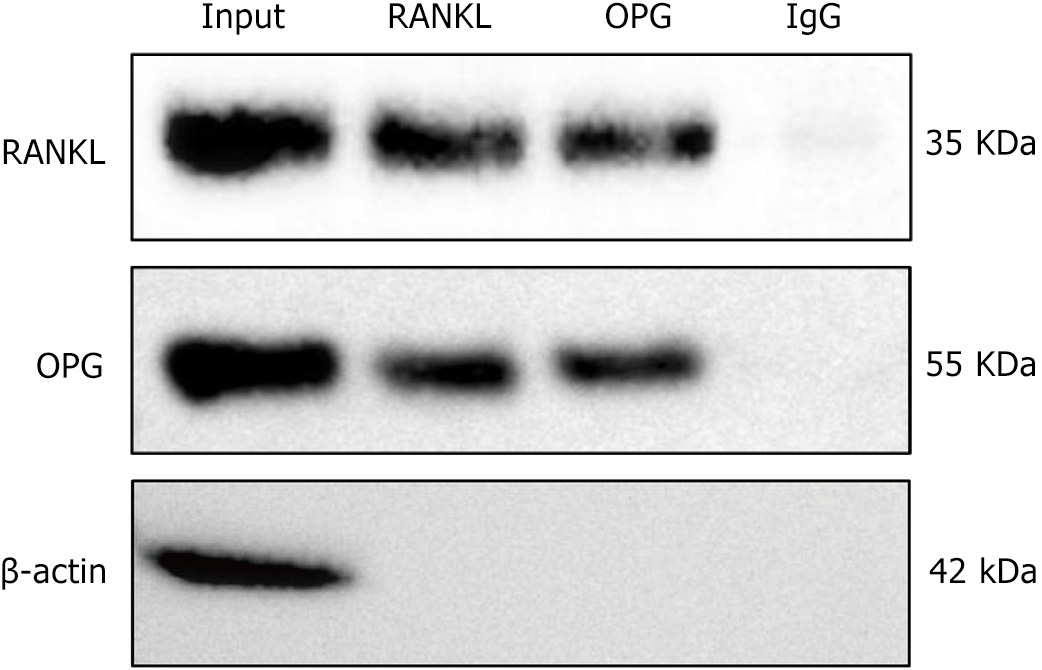
Figure 7 Co-immunoprecipitation results of the interaction between receptor activator of nuclear factor-kappa B ligand and osteoprotegerin.
This figure demonstrates the protein-protein interaction between receptor activator of nuclear factor-kappa B ligand (RANKL) and osteoprotegerin (OPG) in co-immunoprecipitation experiments. In the input samples (input, the supernatant obtained from centrifuged bone marrow-derived mesenchymal stem cell protein lysates without antibody addition or immunoprecipitation), distinct protein bands were observed at 55 kDa and 35 kDa, corresponding to OPG and RANKL, respectively. Significant bands were also detected at 55 kDa and 35 kDa in the immunoprecipitation samples using RANKL antibody (RANKL) and OPG antibody (OPG), indicating a direct protein-protein interaction between RANKL and OPG. No significant signals were observed in the negative control group (immunoglobulin G), confirming the specificity of the experimental results. n = 3. RANKL: Receptor activator of nuclear factor-kappa B ligand; OPG: Osteoprotegerin; IgG: Immunoglobulin G.
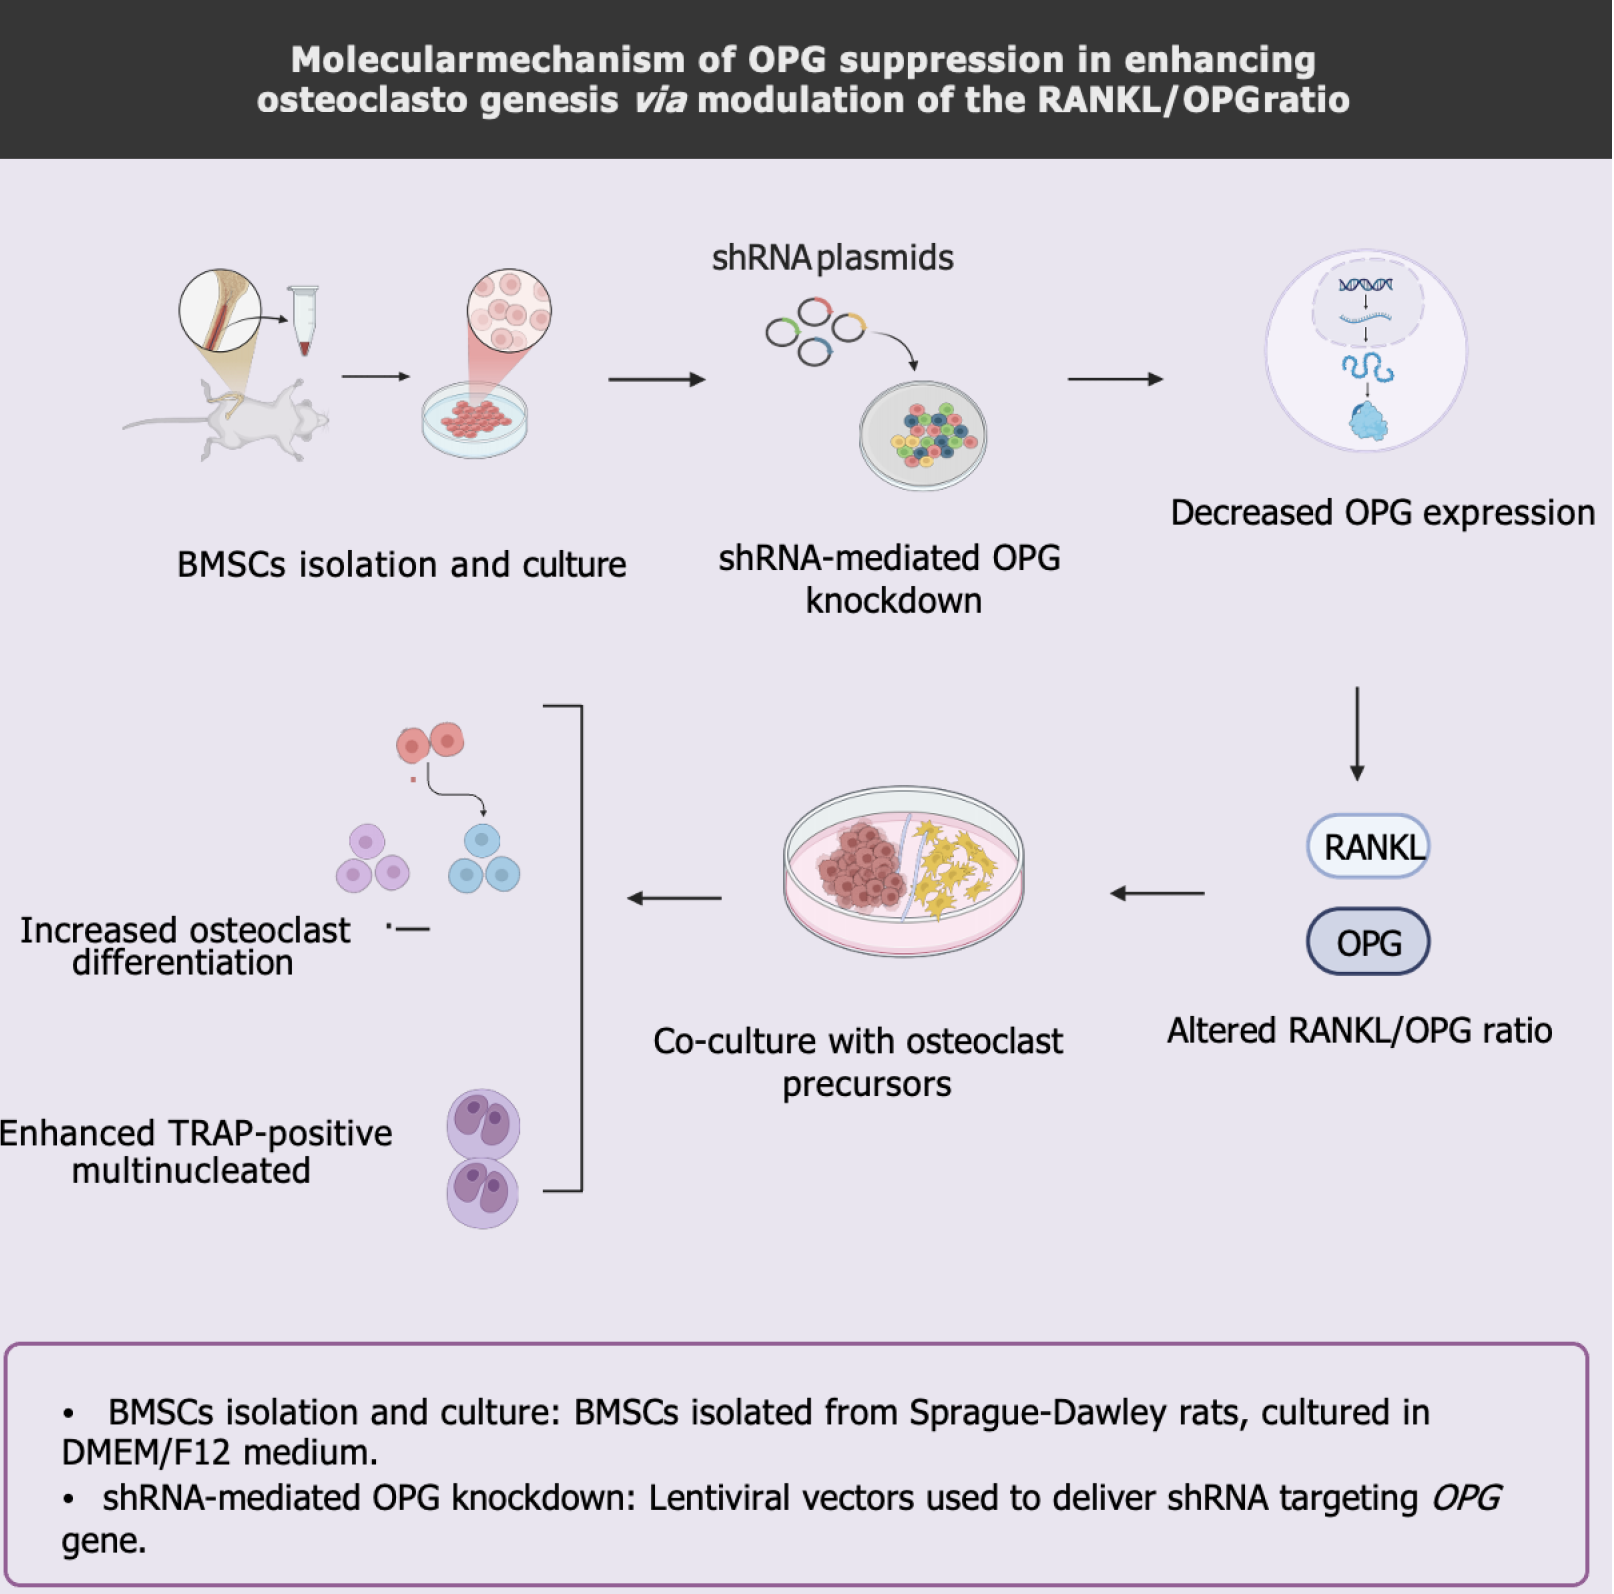
Figure 8 Molecular mechanism of osteoprotegerin suppression in enhancing osteoclastogenesis via modulation of the receptor activator of nuclear factor-kappa B ligand/osteoprotegerin ratio.
BMSC: Bone marrow-derived mesenchymal stem cell; OPG: Osteoprotegerin; RANKL: Receptor activator of nuclear factor-kappa B ligand; shRNA: Short hairpin RNA; TRAP: Tartrate-resistant acid phosphatase.
- Citation: Wei SG, Chen HH, Xie LR, Qin Y, Mai YY, Huang LH, Liao HB. RNA interference-mediated osteoprotegerin silencing increases the receptor activator of nuclear factor-kappa B ligand/osteoprotegerin ratio and promotes osteoclastogenesis. World J Stem Cells 2025; 17(4): 101290
- URL: https://www.wjgnet.com/1948-0210/full/v17/i4/101290.htm
- DOI: https://dx.doi.org/10.4252/wjsc.v17.i4.101290


