Copyright
©The Author(s) 2025.
World J Stem Cells. Jan 26, 2025; 17(1): 98349
Published online Jan 26, 2025. doi: 10.4252/wjsc.v17.i1.98349
Published online Jan 26, 2025. doi: 10.4252/wjsc.v17.i1.98349
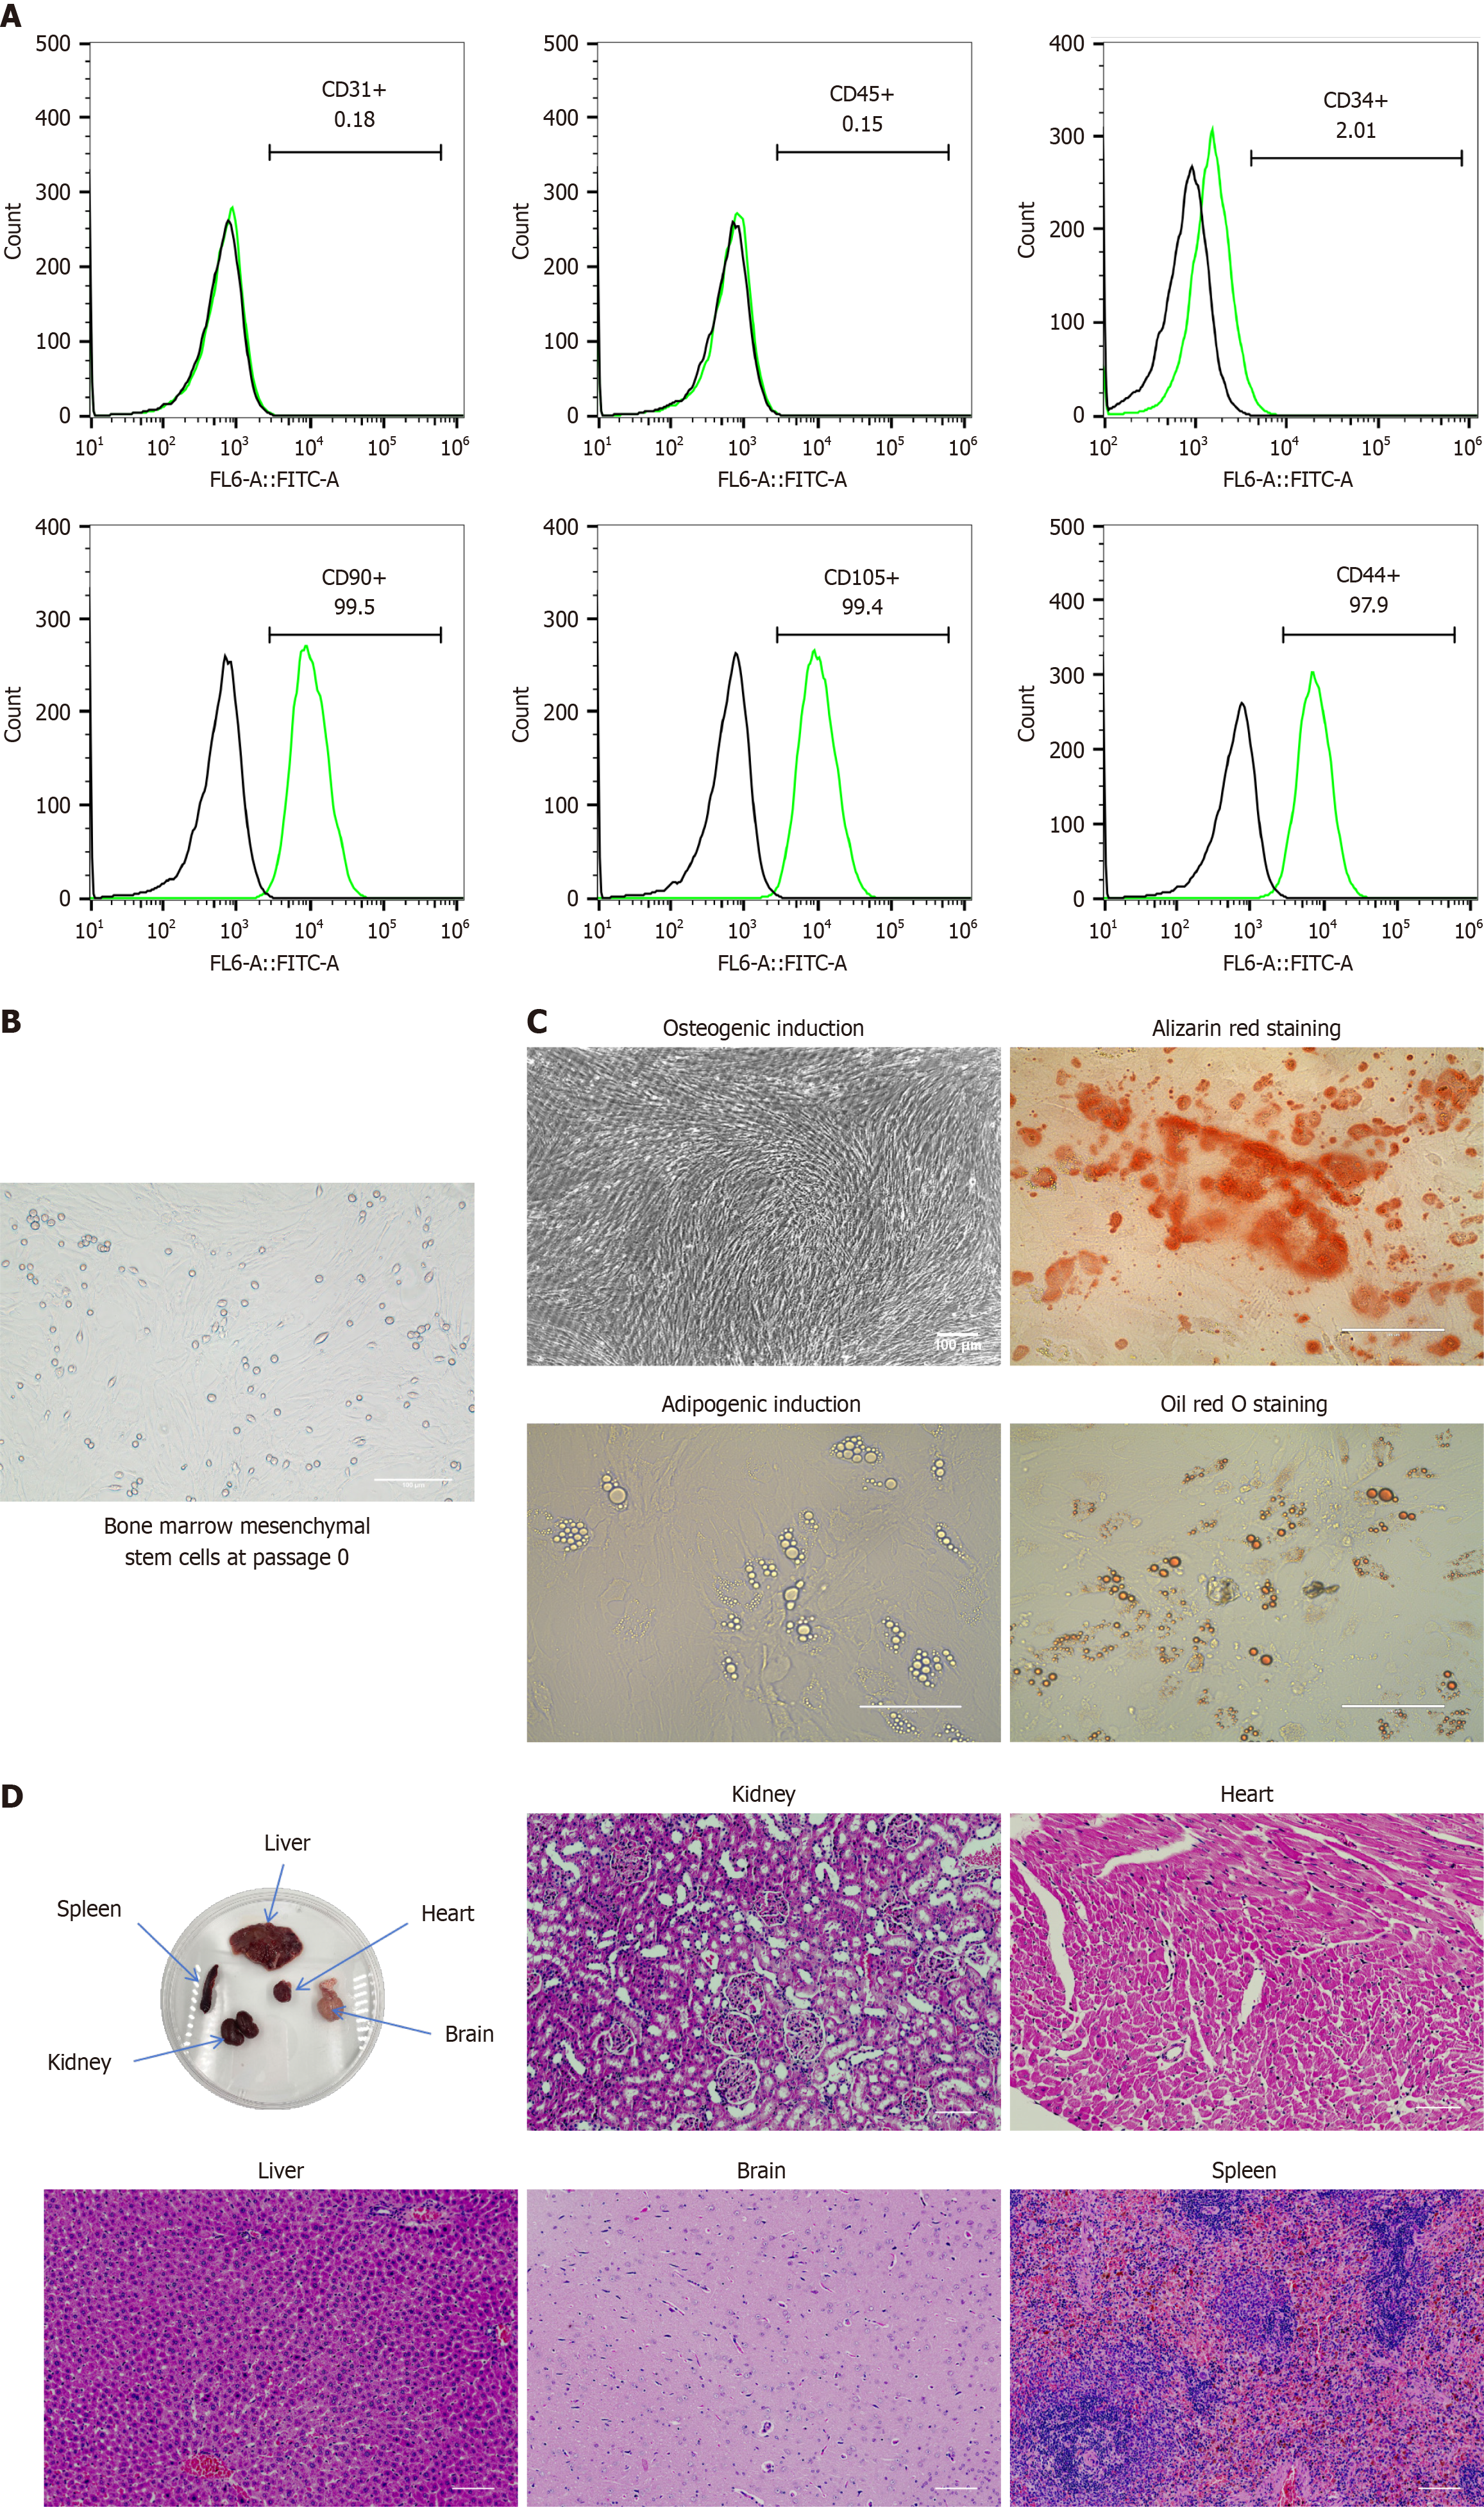
Figure 1 Characterization, morphology, differentiation capacity, and safety of bone marrow mesenchymal stem cells.
A: Flow cytometric analysis of CD90, CD44, CD105, CD34, CD45, and CD31 expression in bone marrow mesenchymal stem cells (BMSCs). The black lines represent isotype controls, whereas the green lines represent the levels of surface markers; B: Representative optical microscopy image of passage 0 BMSCs cultured for 5 d in plastic cell culture flasks (scale bar = 100 μm); C: Multilineage differentiation potential of BMSCs. BMSCs differentiate into mature adipocytes and osteoblasts upon induction. Lipid droplets and bone trabecular structures were observed under a light microscope and stained with Oil Red O and Alizarin Red to detect adipocytes and osteoblasts derived from BMSCs (scale bar = 100 μm); D: Gross appearance images of primary organs in rat models after BMSC transplantation, as assessed via hematoxylin and eosin staining to examine tissue structures (scale bar = 100 μm).
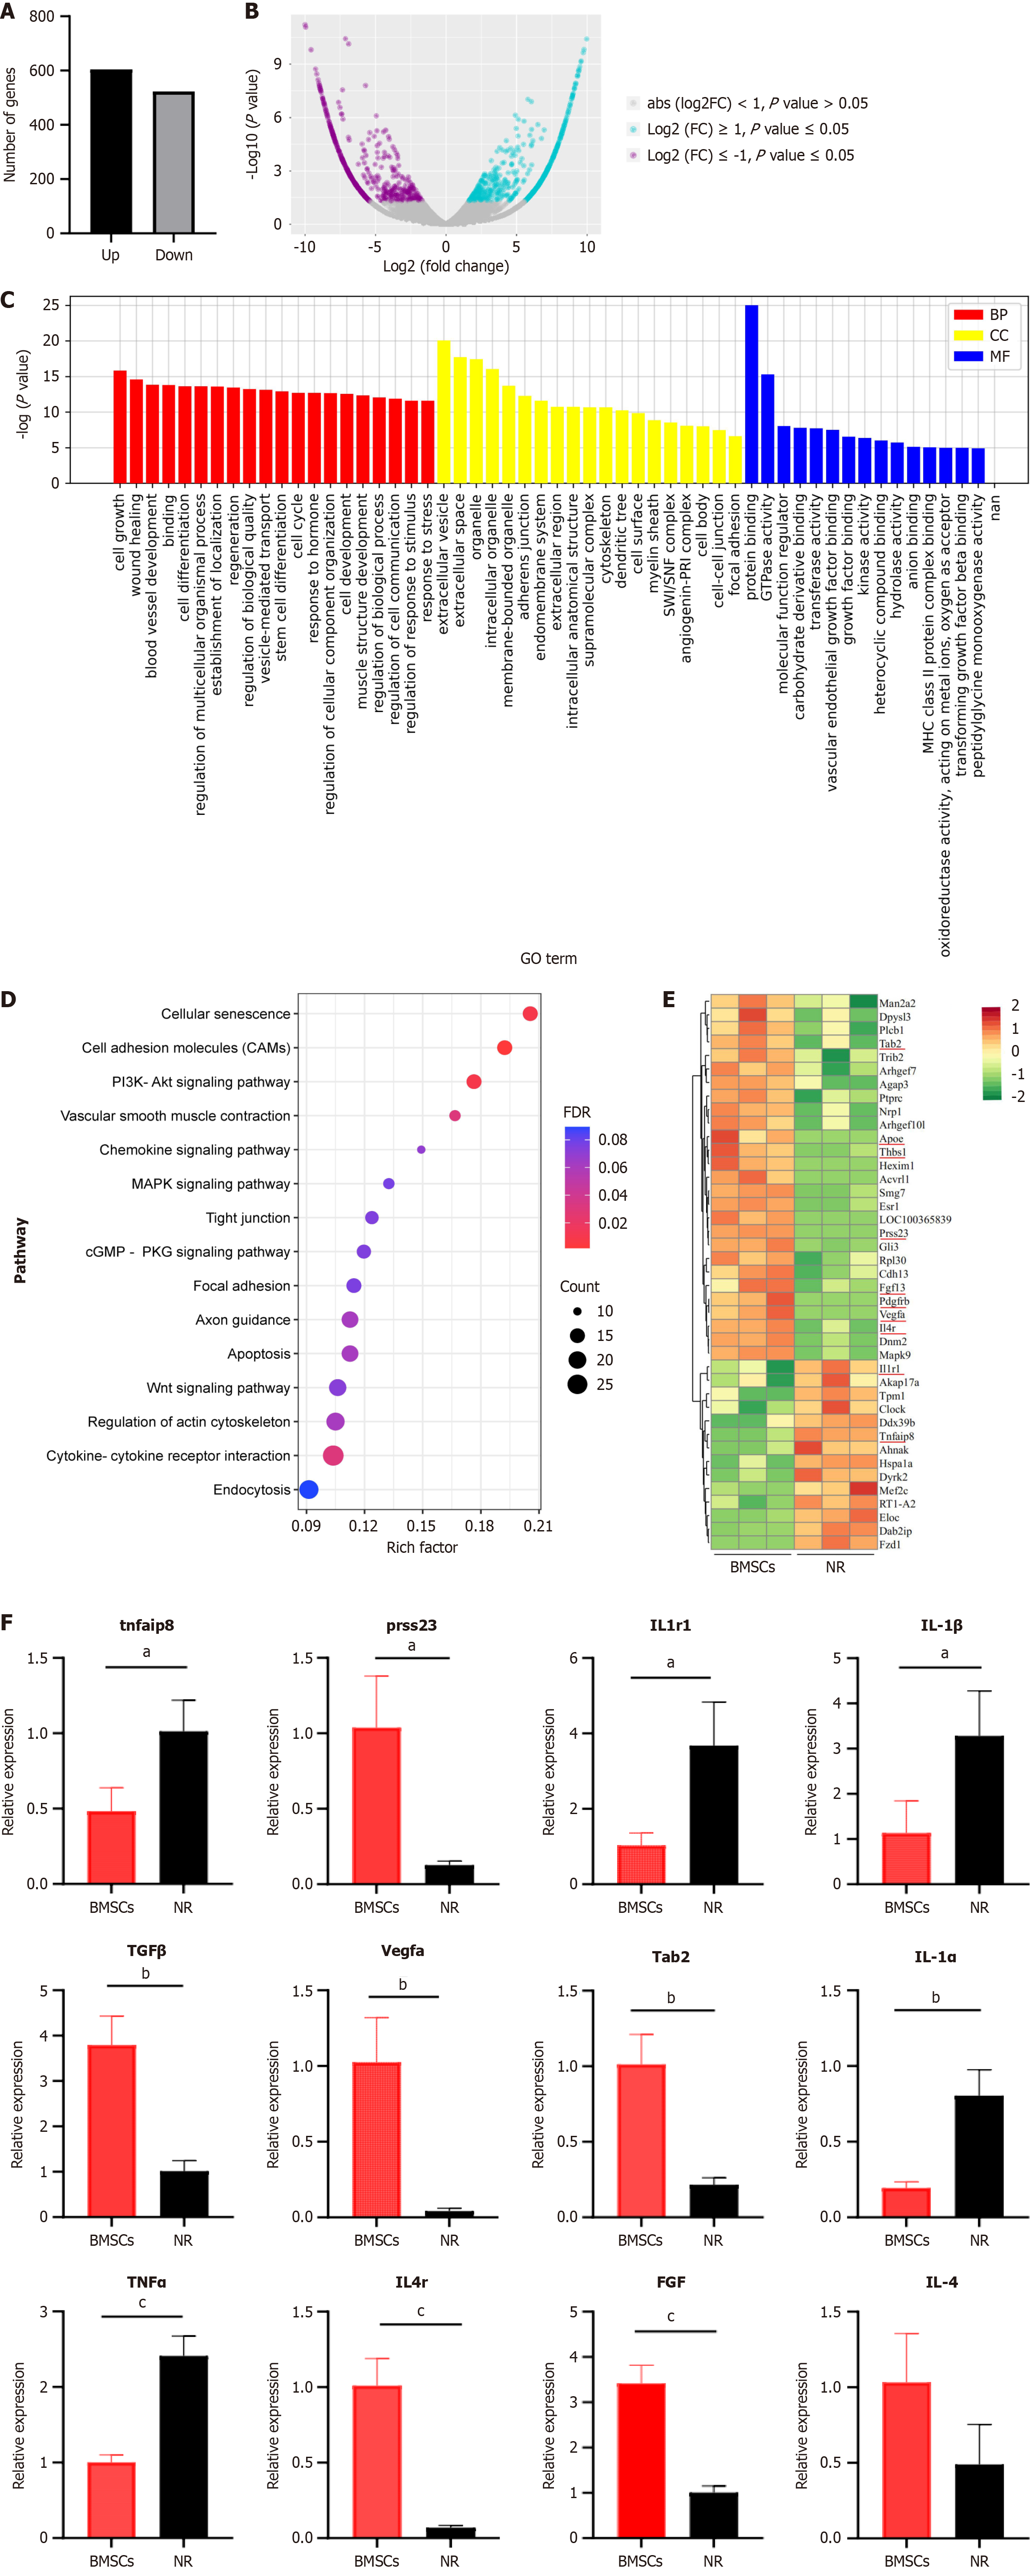
Figure 2 Transcriptome sequencing and differential gene clustering analysis.
A: Bar graph illustrating significantly differentially expressed genes at the uterine wound site, with a total of 604 upregulated genes and 523 downregulated genes identified; B: Volcano plot and scatter plot of significantly differentially expressed genes; C: Gene Ontology analysis of the impact of bone marrow mesenchymal stem cells (BMSCs) on the uterine wound tissue transcriptome (bar graph); D: Kyoto Encyclopedia of Genes and Genomes analysis of significantly different pathways; E: Cluster analysis of differential gene expression changes. Red represents upregulated genes, and green represents downregulated genes; F: Quantitative reverse-transcription polymerase chain reaction validation of differential genes and their corresponding cytokine genes. The values are shown as the means ± SDs. aP < 0.05 vs the natural repair group, bP < 0.01 vs the natural repair group, cP < 0.001 vs the natural repair group, n = 3 per group. BMSCs: Bone marrow mesenchymal stem cells; BP: Biological process; CC: Cellular component; FC: Fold change; FGF: Fibroblast growth factor; IL-1α: Interleukin 1 alpha; IL-1β: Interleukin 1 beta; IL1r1: Interleukin 1 receptor type 1; IL-4: Interleukin 4; IL4r: Interleukin 4 receptor; MF: Molecular function; NR: Natural repair; Prss23: Protease 23; Tab2: Transforming growth factor-beta activated kinase 1 (MAP3K7) binding protein 2; TGF: Transforming growth factor; TNFα: Tumor necrosis factor alpha; Tnfaip8: Tumor necrosis factor alpha-induced protein 8; Vegfa: Vascular endothelial growth factor alpha.
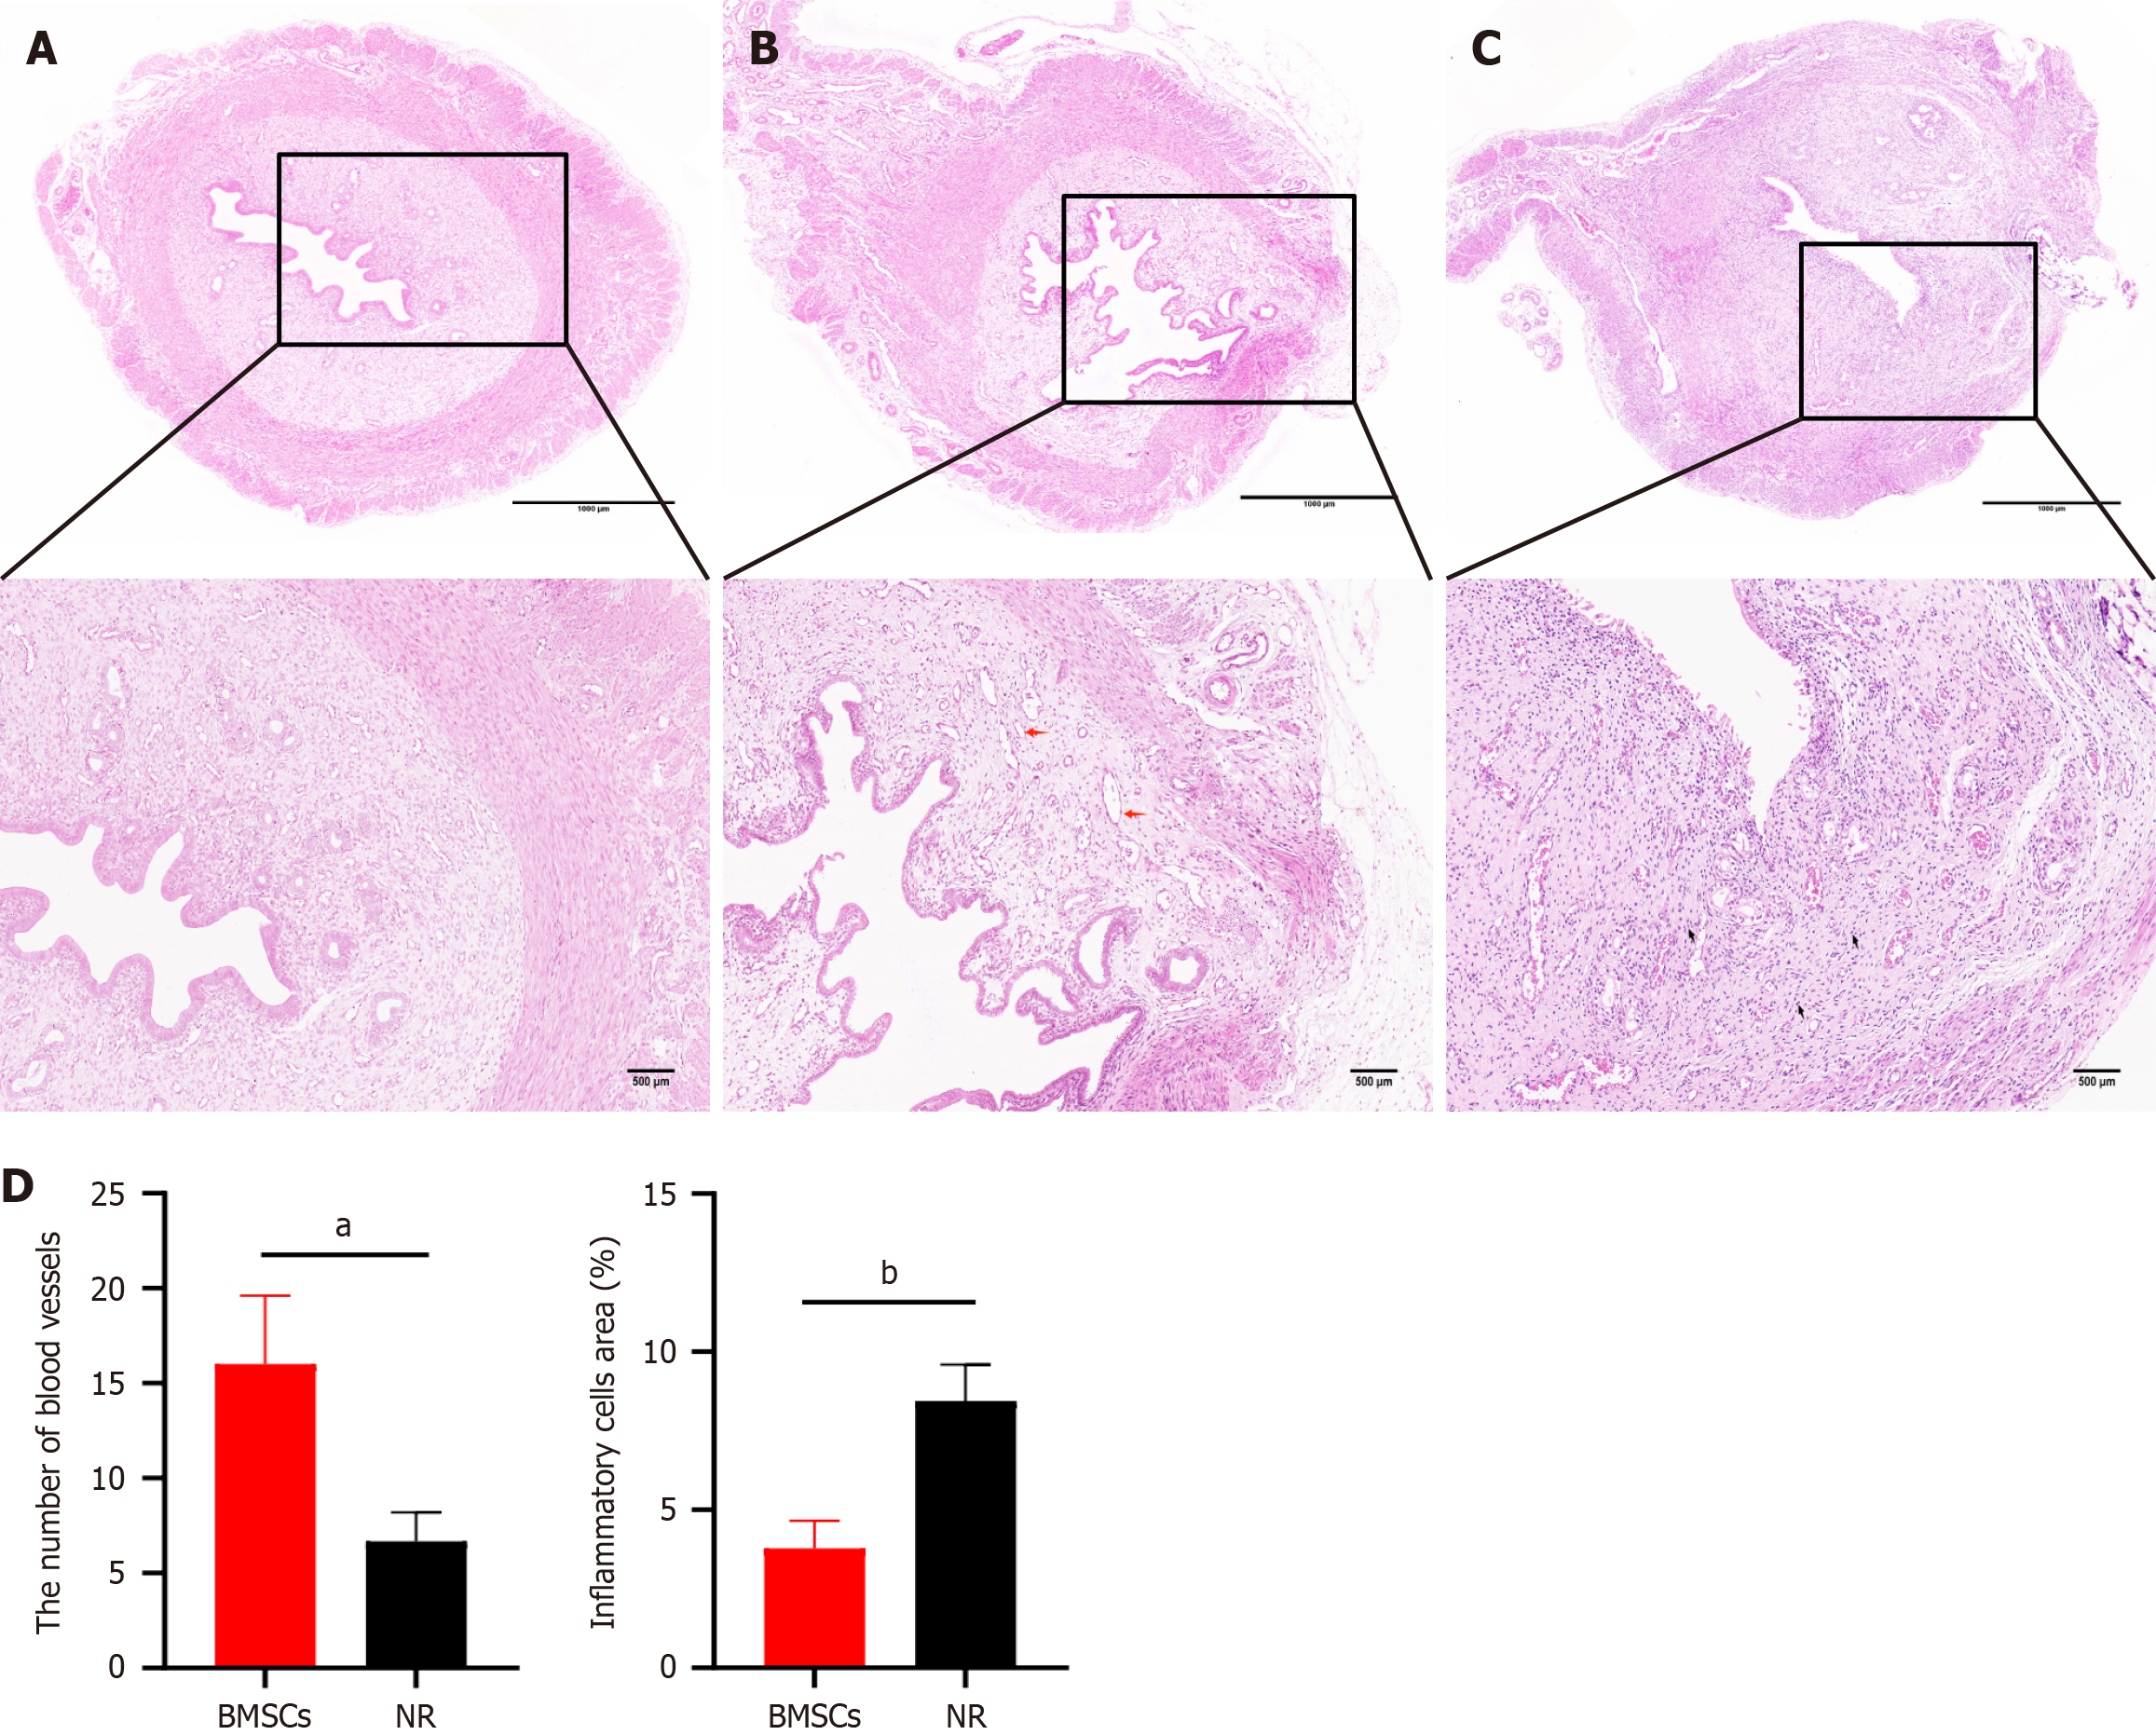
Figure 3 Hematoxylin and eosin staining of the damaged uterus.
A: Uterine tissue of rats in the sham surgery group; B: Uterine tissue of rats in the bone marrow mesenchymal stem cell (BMSC) group, red arrow: Thin-walled small blood vessels; C: Uterine tissue of rats in the natural repair (NR) group, black arrow: Inflammatory cells; D: The quantitative analysis of inflammatory cells and blood vessels in the BMSCs group and NR group. aP < 0.05 vs the NR group, bP < 0.01 vs the NR group, n = 5 per group.
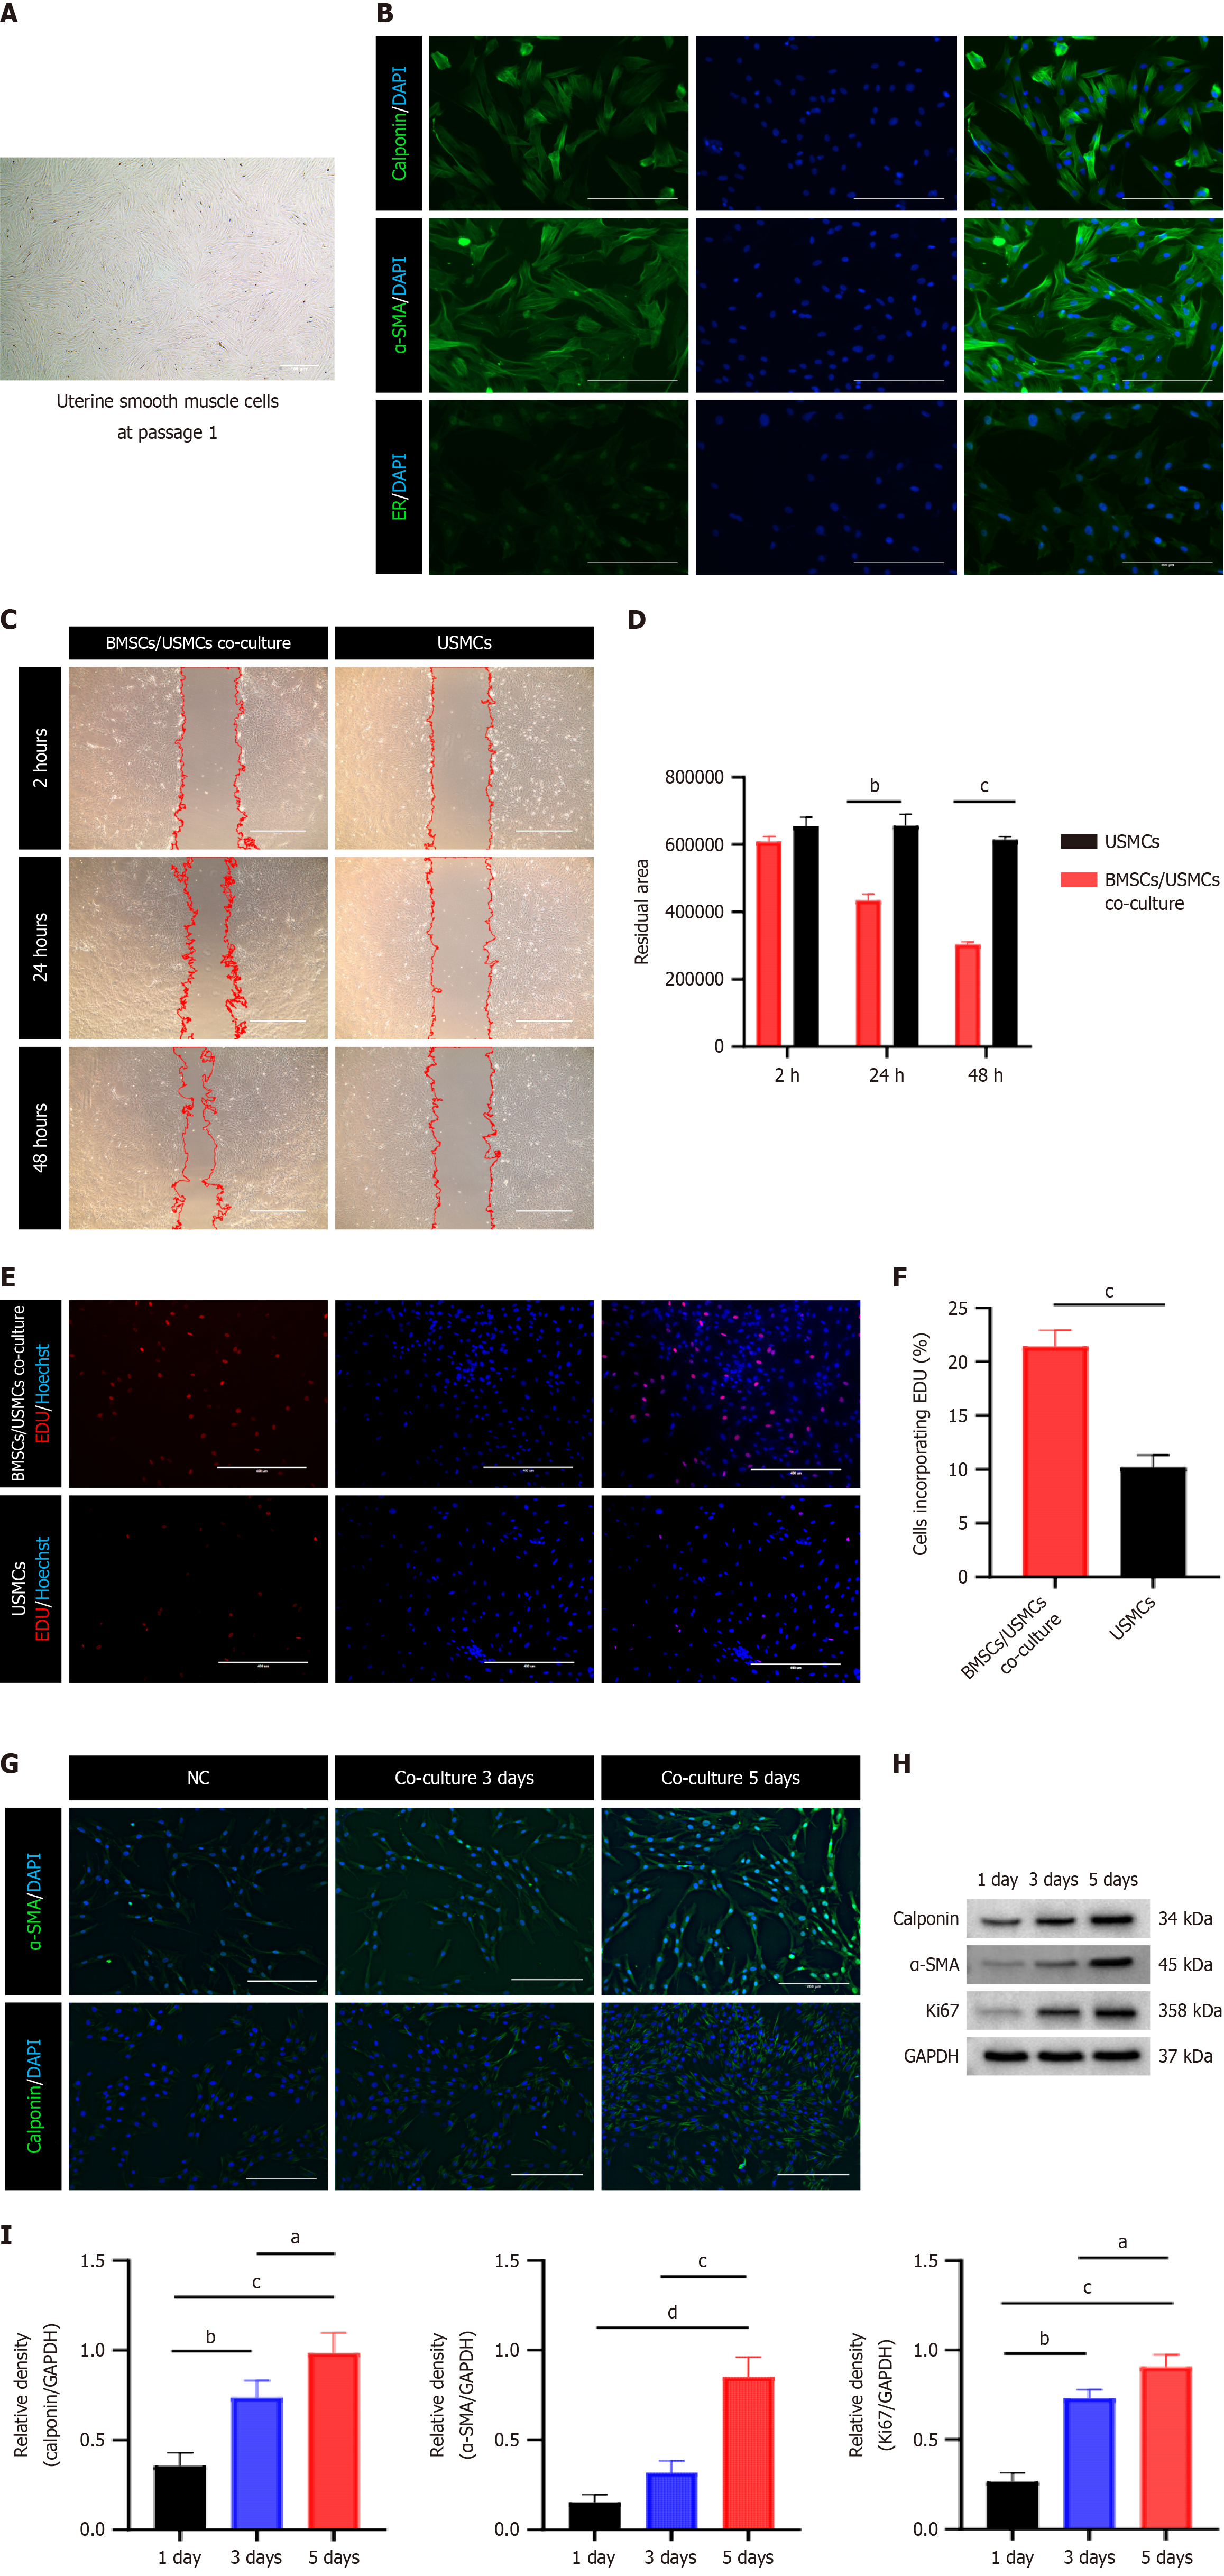
Figure 4 Influence of the microenvironment on uterine smooth muscle cells and bone marrow mesenchymal stem cells.
A: Representative optical micrographs of P1 uterine smooth muscle cells (USMCs) cultured for 7 d (scale bar = 100 μm); B: Immunofluorescence staining for USMC markers, with green fluorescence indicating positivity (scale bar = 200 μm); C: Bright-field image showing USMC migration at 2 h, 24 h, and 48 h, with red dashed lines delineating migration contours (scale bar = 1000 μm); D: Quantification of the residual USMC area. bP < 0.01 vs the USMCs, cP < 0.001 vs the USMCs; E: Fluorescence images depicting the 5-ethynyl-2’-deoxyuridine (EdU) cell proliferation assay used to detect USMC proliferation, where red fluorescence indicates EdU-positive proliferating cells and blue fluorescence indicates Hoechst 33342-positive nuclei (scale bar = 400 μm); F: Percentage of EdU-positive USMCs. cP < 0.001 vs USMCs; G: Immunofluorescence staining of alpha-smooth muscle actin (α-SMA) and calponin in bone marrow mesenchymal stem cells (BMSCs). Green indicates positivity, and the fluorescence intensity reflects the expression level (scale bar = 200 μm); H: Western blot analysis of α-SMA, calponin, and the Kiel-67 marker of proliferation (Ki67) expression in BMSCs cocultured with USMCs for 1, 3, or 5 d; I: Statistical analysis of relative protein levels at different coculture times. aP < 0.05 vs the 3-d group, bP < 0.01 vs the 1-d group, cP < 0.001 vs the 1-d and 3-d groups, dP < 0.001 vs the 1-d group. ImageJ software was used to process the images. The data are presented as the mean ± SD, n = 3 per group. P values for D were determined via two-way ANOVA, and those for I were determined via one-way ANOVA. Comparisons between two groups in F were conducted via a t test. ER: Estrogen receptor.
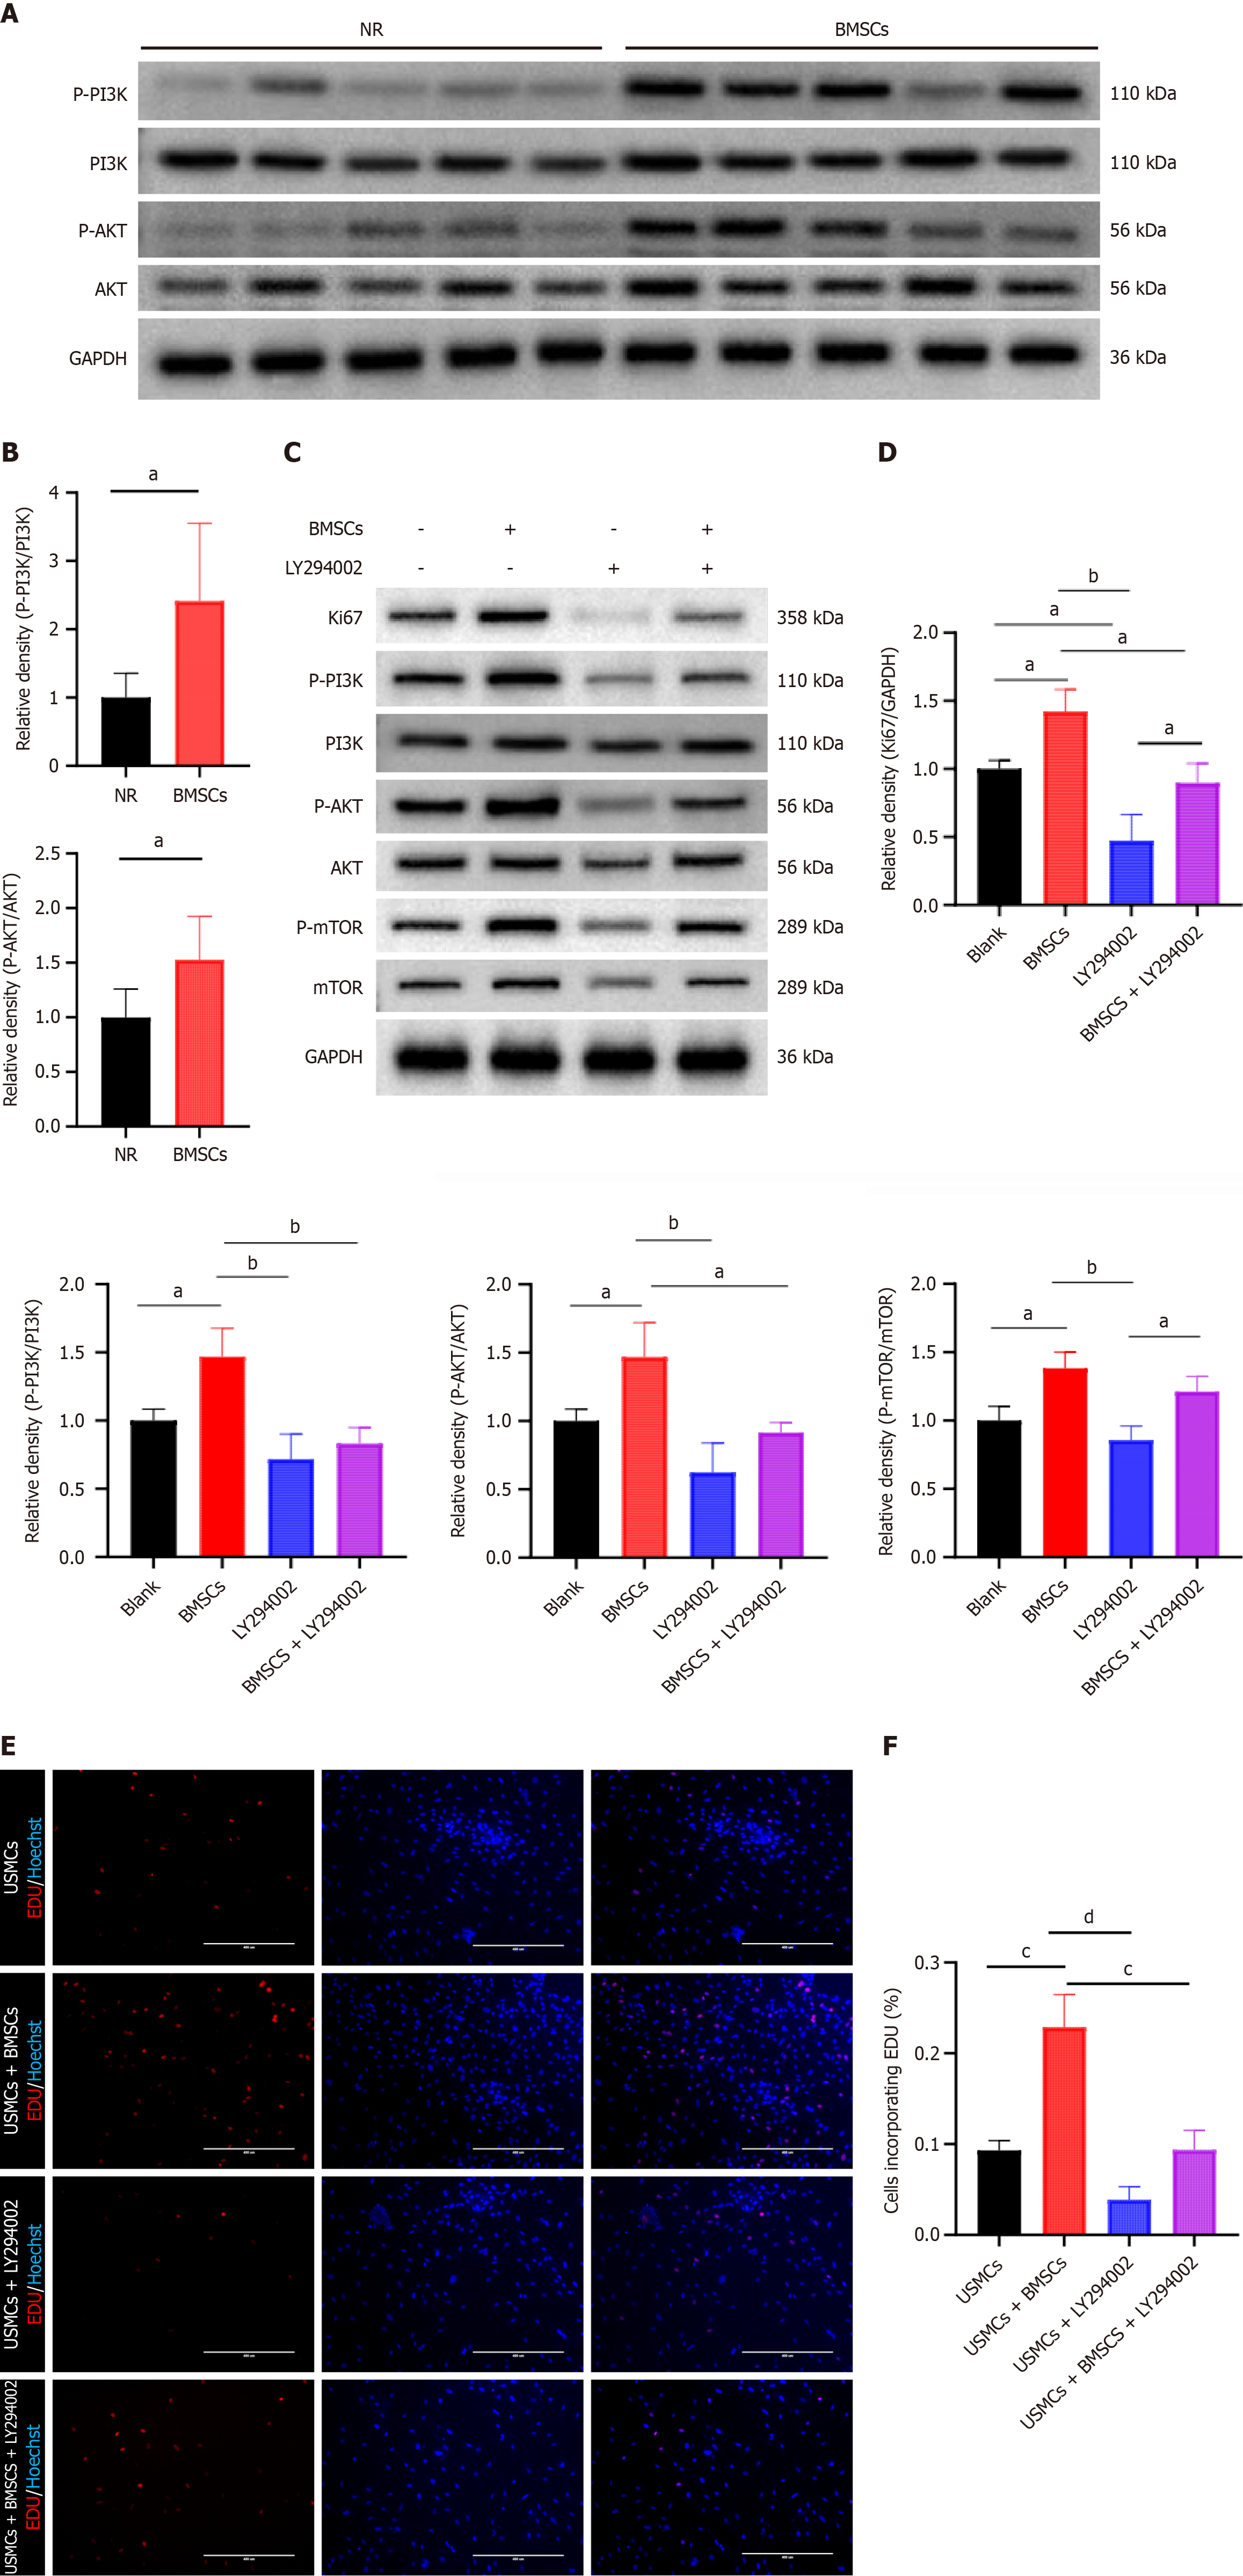
Figure 5 Bone marrow mesenchymal stromal cells regulate uterine smooth muscle cells through the phosphoinositide 3-kinase/protein kinase B signaling pathway in vitro and in vivo.
A: Examination of the impact of bone marrow mesenchymal stromal cells (BMSCs) on phosphorylated phosphoinositide 3-kinase (p-PI3K)/phosphorylated protein kinase B (p-AKT) in uterine wound tissues; B: Comparison of the relative expression levels of p-PI3K/p-AKT in the wound tissues. aP < 0.05 vs the natural repair (NR) ; C: Detection of the Kiel67 marker of proliferation (Ki67), p-PI3K, p-AKT, and phosphorylated mechanistic target of rapamycin (p-mTOR) in uterine smooth muscle cells (USMCs) treated with complete culture medium in the presence or absence of 2-(4-morpholinyl)-8-phenyl-4H-1-benzopyran-4-one (LY294002), as well as in BMSCs cultured in the presence or absence of LY294002 (25 μM); D: Relative expression levels of Ki67, p-PI3K, p-AKT, and p-mTOR in USMCs under different treatment conditions; E: 5-ethynyl-2’-deoxyuridine assay for assessing the proliferation of USMCs. The treatment was the same as in C (scale bar = 400 μm); F: Percentage of 5-ethynyl-2’-deoxyuridine (EDU)-positive USMCs. The data are presented as mean ± SD, with n = 5 per group for A and n = 3 for C and E. One-way ANOVA was used for multiple comparisons, and a t test was used for comparisons between two groups. aP < 0.05, bP < 0.01, cP < 0.001, dP < 0.0001.
- Citation: Yang J, Yuan J, Wen YQ, Wu L, Liao JJ, Qi HB. Bone marrow mesenchymal stem cells promote uterine healing by activating the PI3K/AKT pathway and modulating inflammation in rat models. World J Stem Cells 2025; 17(1): 98349
- URL: https://www.wjgnet.com/1948-0210/full/v17/i1/98349.htm
- DOI: https://dx.doi.org/10.4252/wjsc.v17.i1.98349


