Copyright
©The Author(s) 2024.
World J Stem Cells. Feb 26, 2024; 16(2): 163-175
Published online Feb 26, 2024. doi: 10.4252/wjsc.v16.i2.163
Published online Feb 26, 2024. doi: 10.4252/wjsc.v16.i2.163
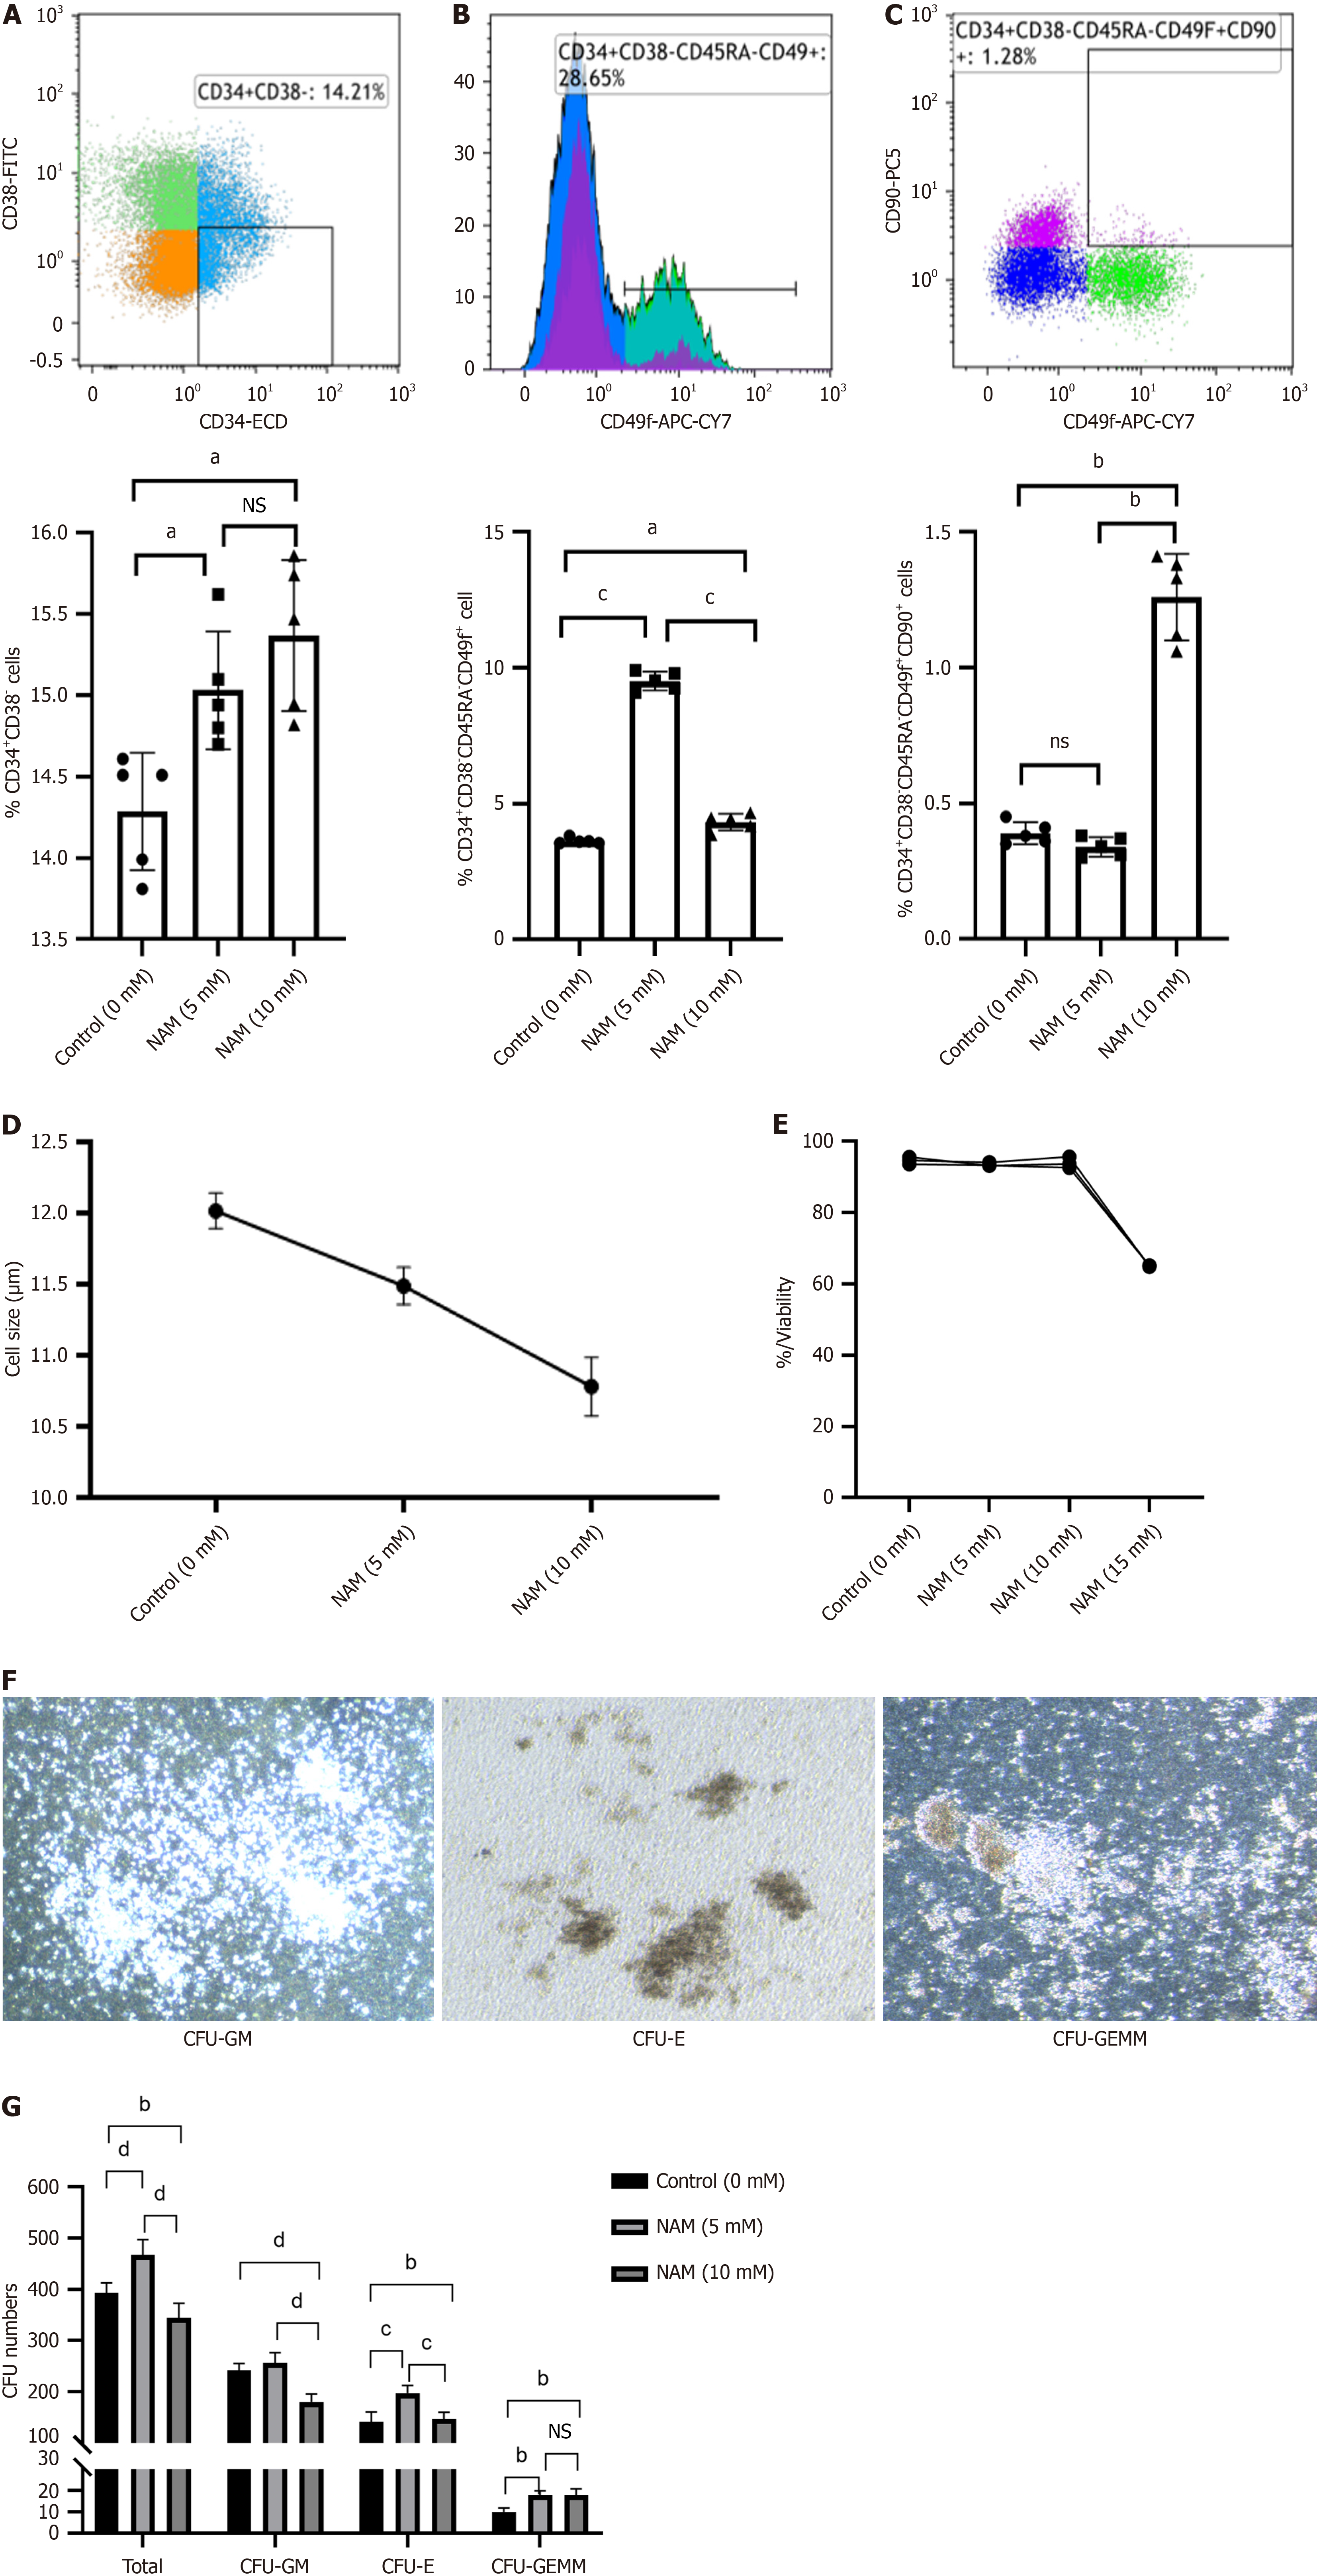
Figure 1 Proportion of hematopoietic stem and progenitor cells, short-term repopulating hematopoietic stem cells and long-term repopulating hematopoietic stem cells populations in each group of cultured cells.
A: Phenotype (up) and proportion (down) of hematopoietic stem and progenitor cells; B: Phenotype (up) and proportion (down) of short-term repopulating hematopoietic stem cells (ST-HSCs); C: Phenotype (up) and proportion (down) of long-term repopulating HSCs; D: Cell size for each group of cells; E: Viability of each group of cells; F: Typical images of representative morphologies of various type of colonies as indicated; G: Colony formation assay showing the number of various types of cell colonies as indicated. The number of colony-forming unit (CFU)-erythroid, CFU-macrophage and CFU-granulocyte/erythroid/macrophage/megakaryocyte were scored. aP < 0.05; bP < 0.01; cP < 0.001; dP < 0.0001; NS: Not significant. NAM: Nicotinamide; CFU-E: Colony-forming unit-erythroid; CFU-GM: Colony-forming unit-granulocyte, macrophage; CFU-GEMM: Colony-forming unit-granulocyte/erythroid/macrophage/megakaryocyte.
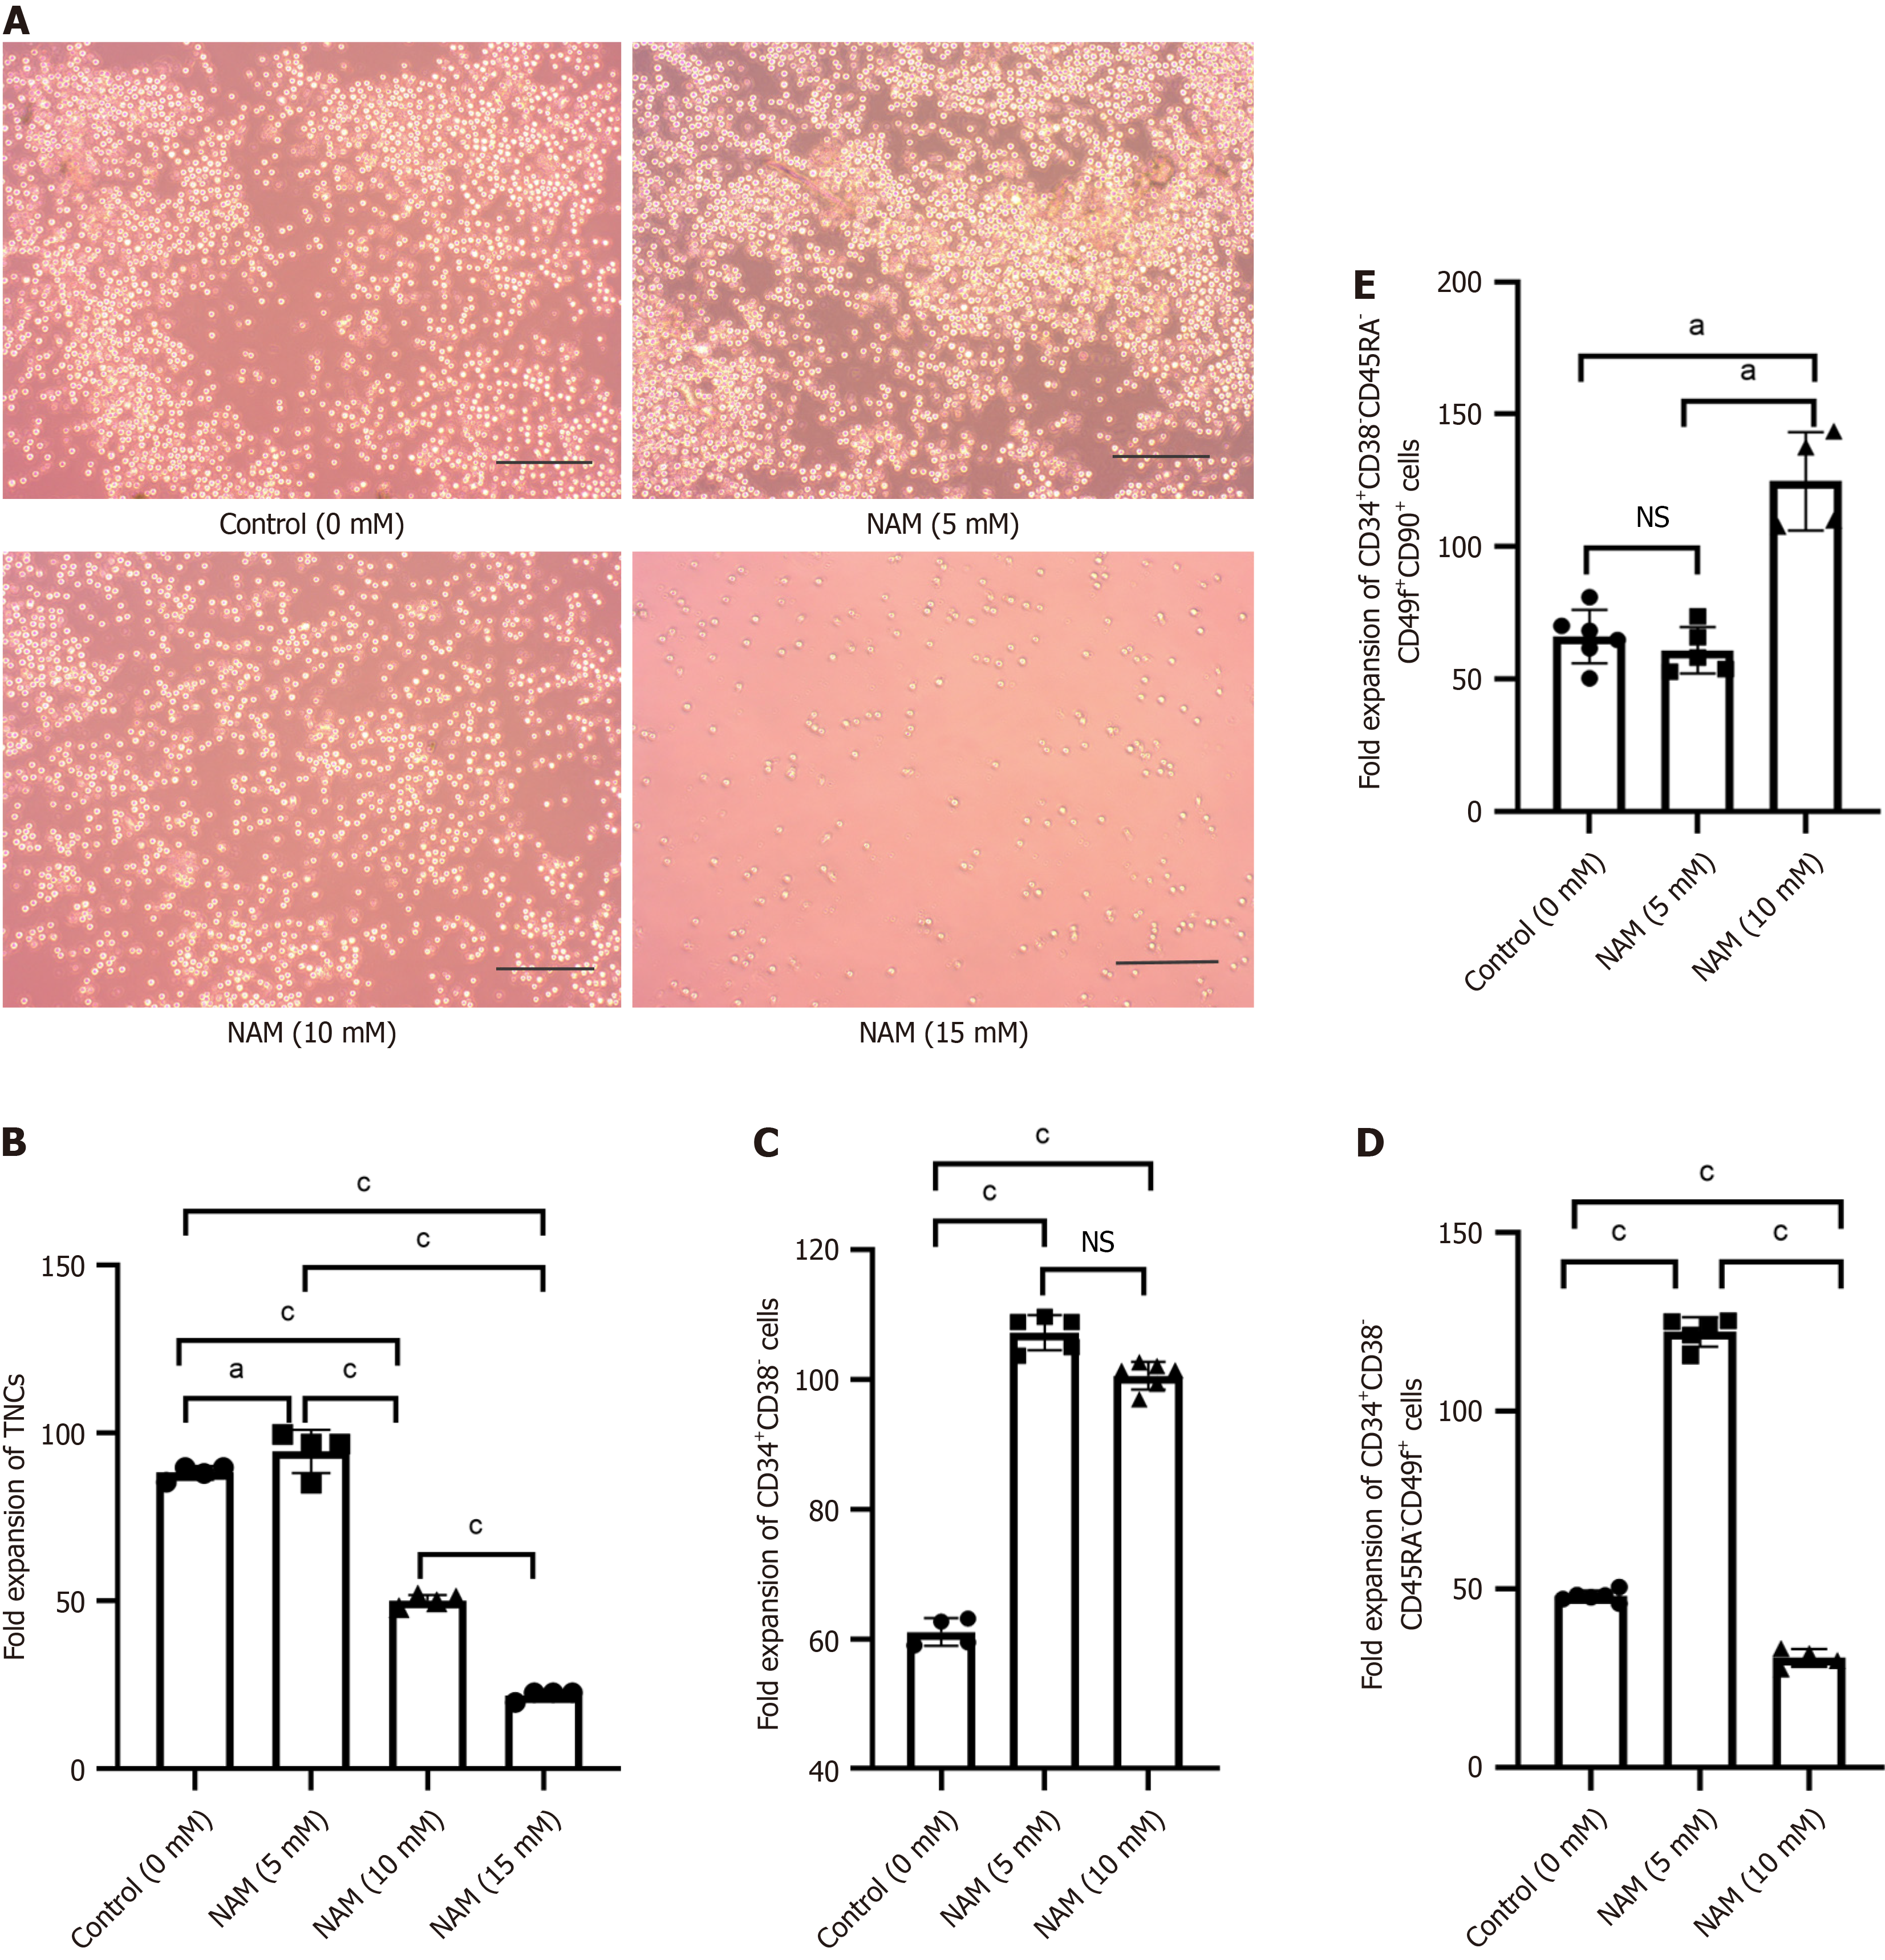
Figure 2 Expansion efficiency of subsets of hematopoietic stem cells in different concentrations of nicotinamide.
A: Microscopic observation of cultured cells in each group (Bar = 200 μm); B: Fold expansion of total nucleated cells; C: Fold expansion of hematopoietic stem and progenitor cells; D: Fold expansion of short-term repopulating hematopoietic stem cells; E: Fold expansion of long-term repopulating hematopoietic stem cells. aP < 0.05; cP < 0.001; NS: Not significant. NAM: Nicotinamide; TNC: Total nucleated cells.
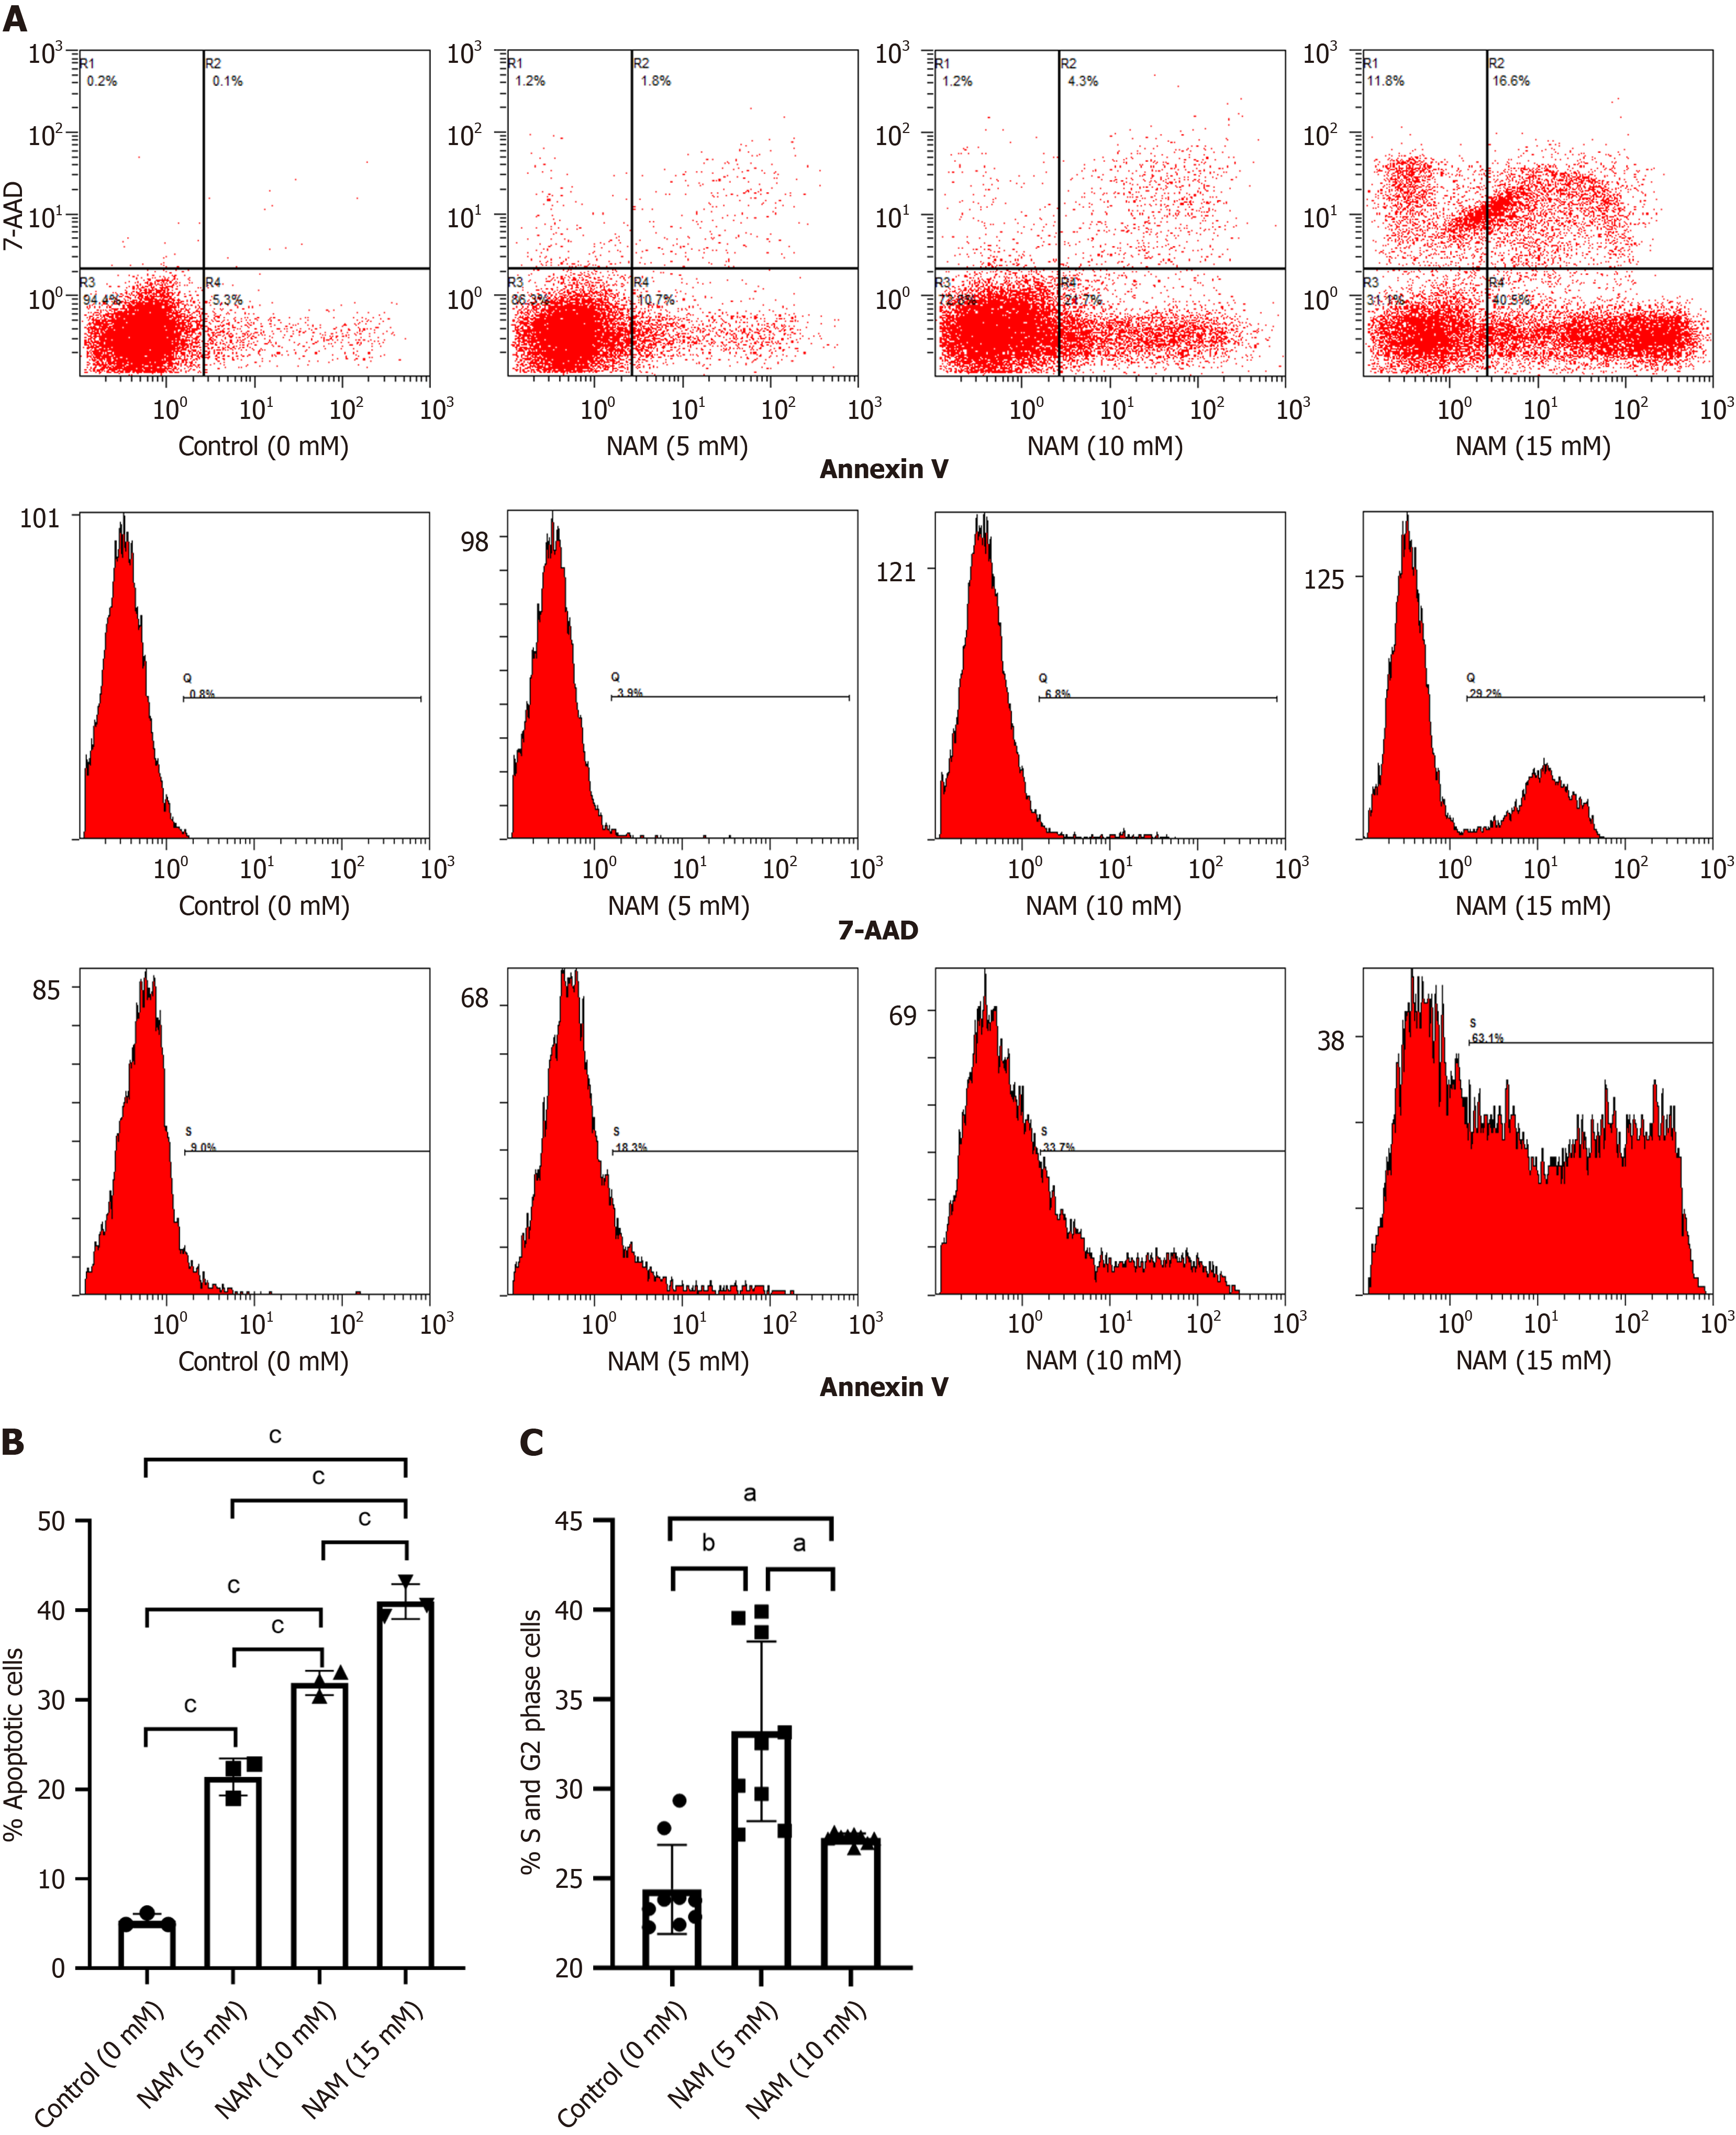
Figure 3 Effect of different concentrations of nicotinamide on the proportion of apoptotic cells and cell cycle distribution.
A: Representative flow cytometry for apoptosis detection in each group; B: Proportion of apoptotic cells in each group; C: Comparison of cell cycle distribution among different groups. aP < 0.05; bP < 0.01; cP < 0.001. NAM: Nicotinamide.
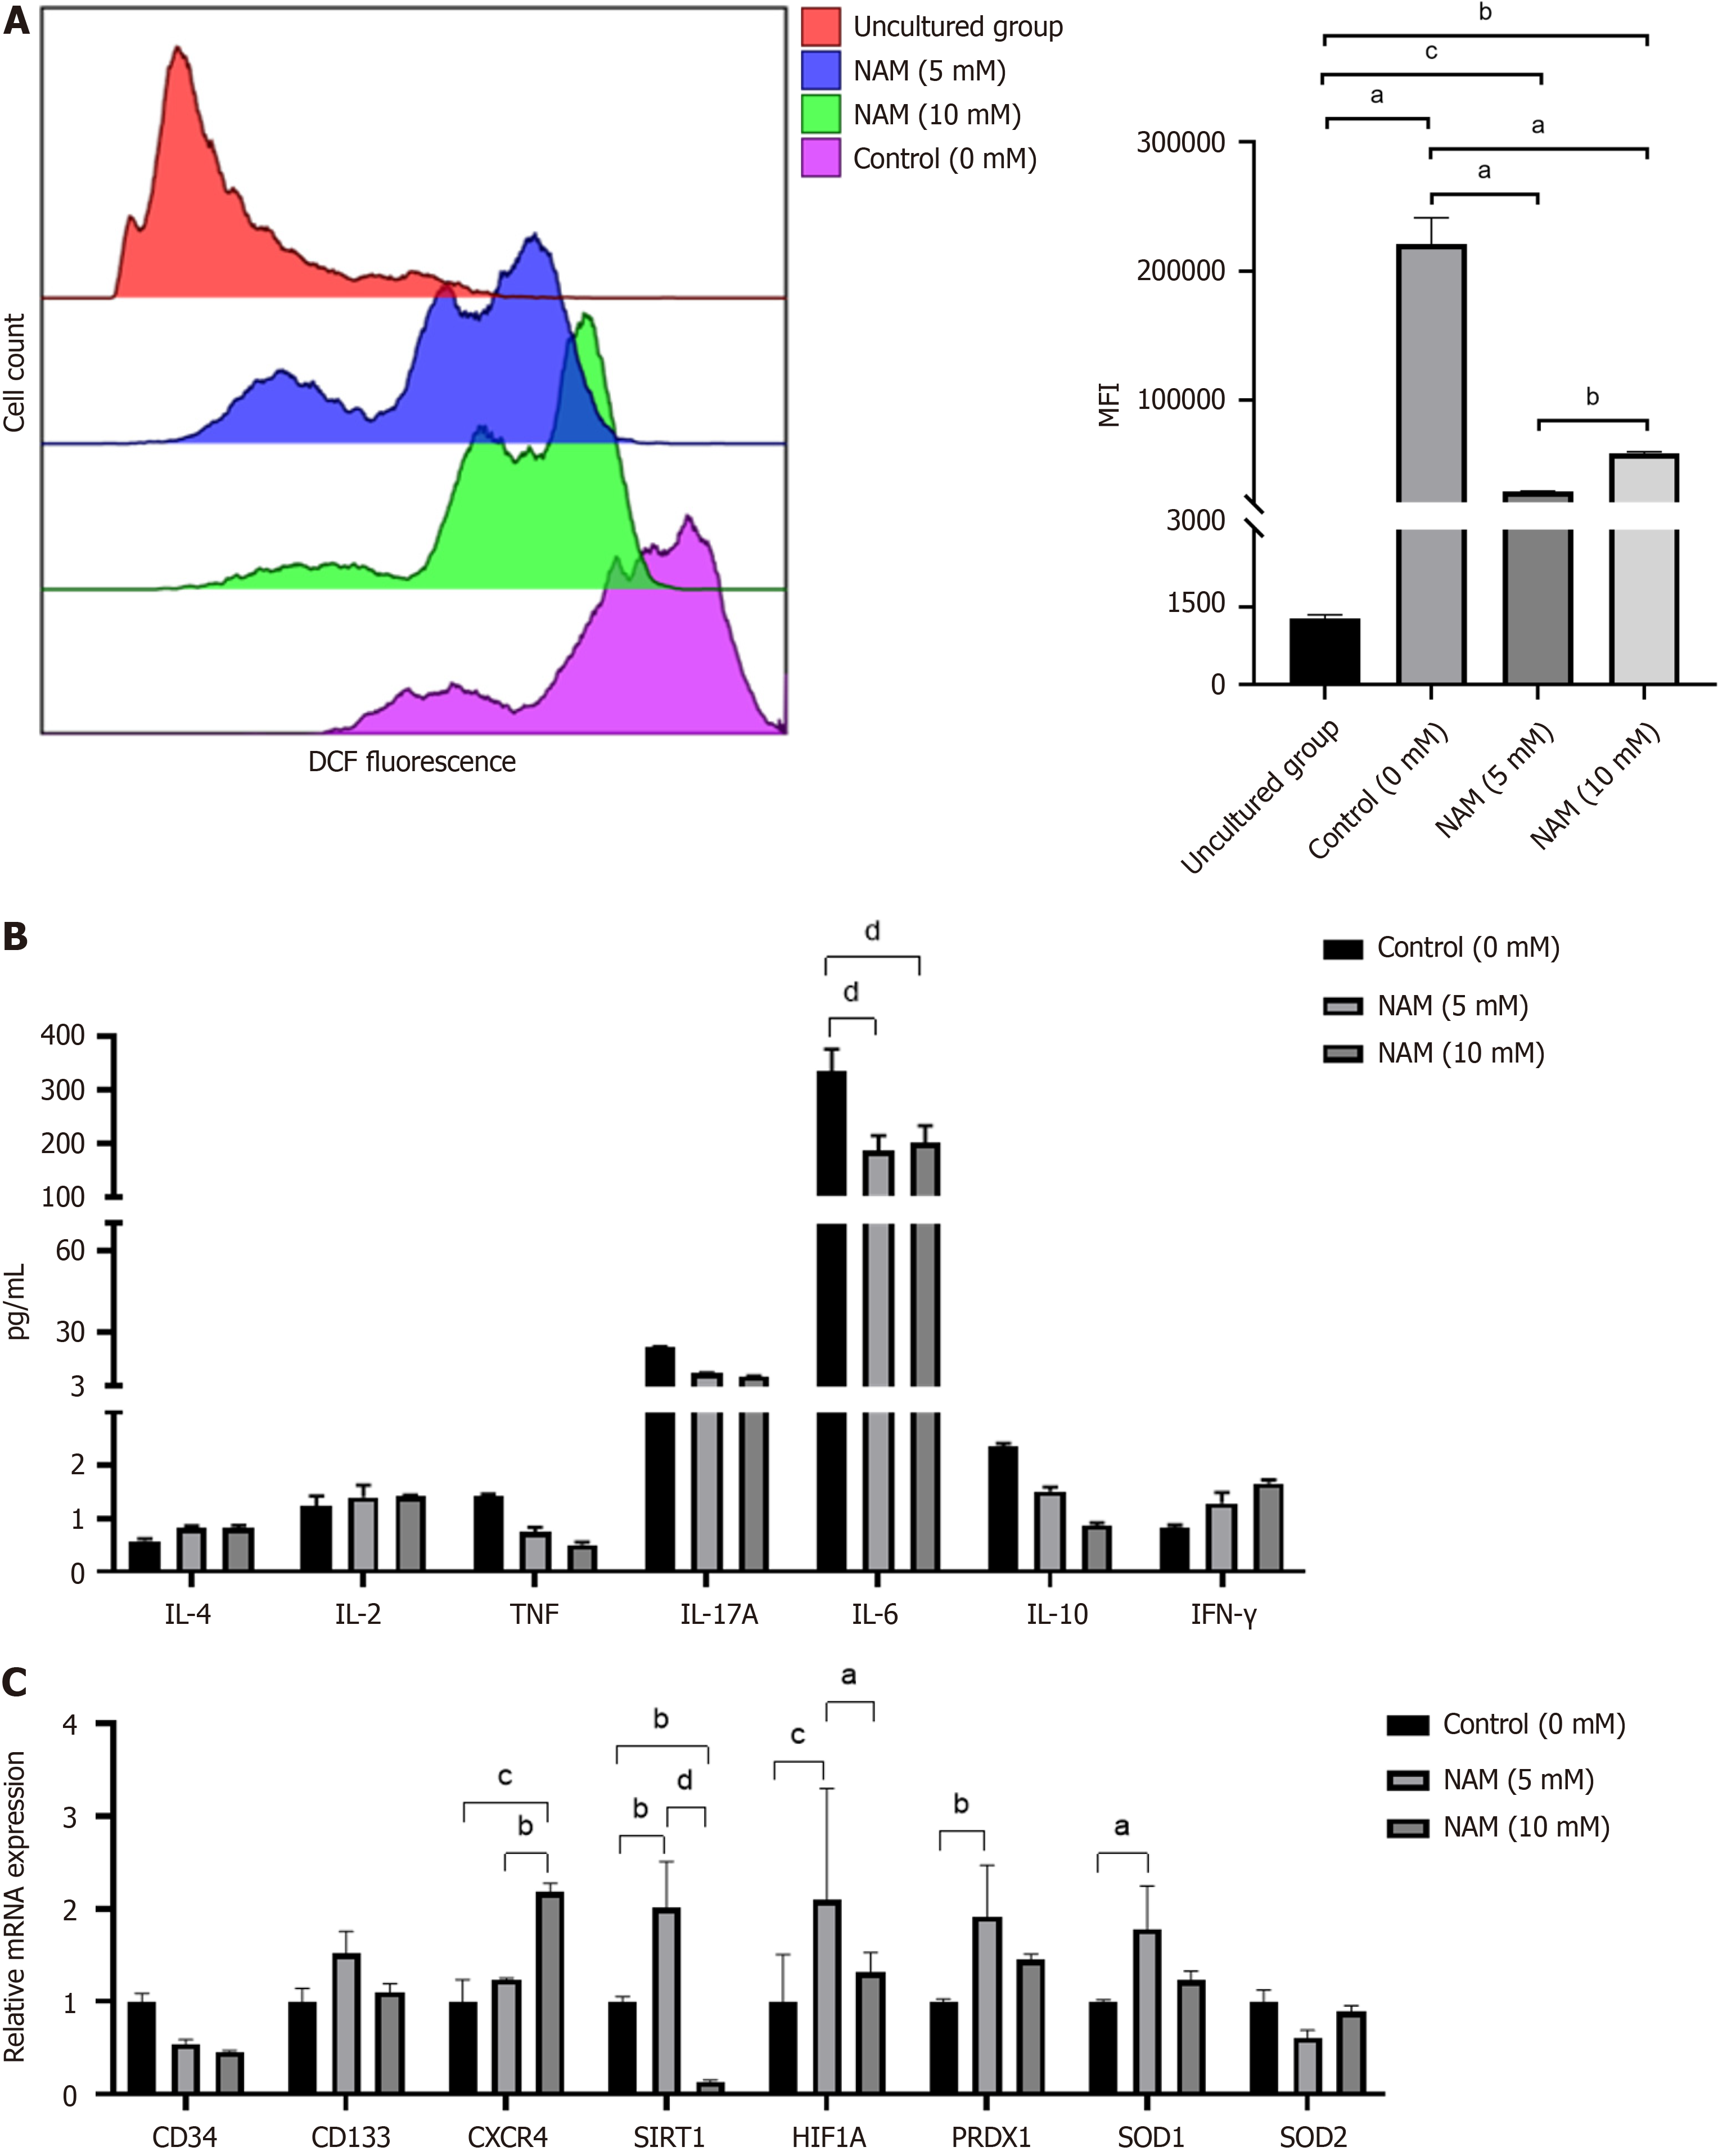
Figure 4 Effect of different concentrations of nicotinamide on reactive oxygen species content, cytokine levels, and gene expression in cultured hematopoietic stem cells.
A: Reactive oxygen species in different groups of cells determined by mean fluorescence intensity; B: Cytokine levels in the supernatant of cultured cells in each group; C: Comparison of expression of genes encoding stemness-related factors, chemokines, components of hypoxia pathways, and antioxidant enzymes among different groups. aP < 0.05; bP < 0.01; cP < 0.001; dP < 0.0001. NAM: Nicotinamide; PRDX1: Peroxiredoxin 1; SOD: Superoxide dismutase; IL: Interleukin; TNF: Tumor necrosis factor; IFN: Interferon.
- Citation: Ren Y, Cui YN, Wang HW. Effects of different concentrations of nicotinamide on hematopoietic stem cells cultured in vitro. World J Stem Cells 2024; 16(2): 163-175
- URL: https://www.wjgnet.com/1948-0210/full/v16/i2/163.htm
- DOI: https://dx.doi.org/10.4252/wjsc.v16.i2.163


