Copyright
©The Author(s) 2024.
World J Stem Cells. Jan 26, 2024; 16(1): 33-53
Published online Jan 26, 2024. doi: 10.4252/wjsc.v16.i1.33
Published online Jan 26, 2024. doi: 10.4252/wjsc.v16.i1.33
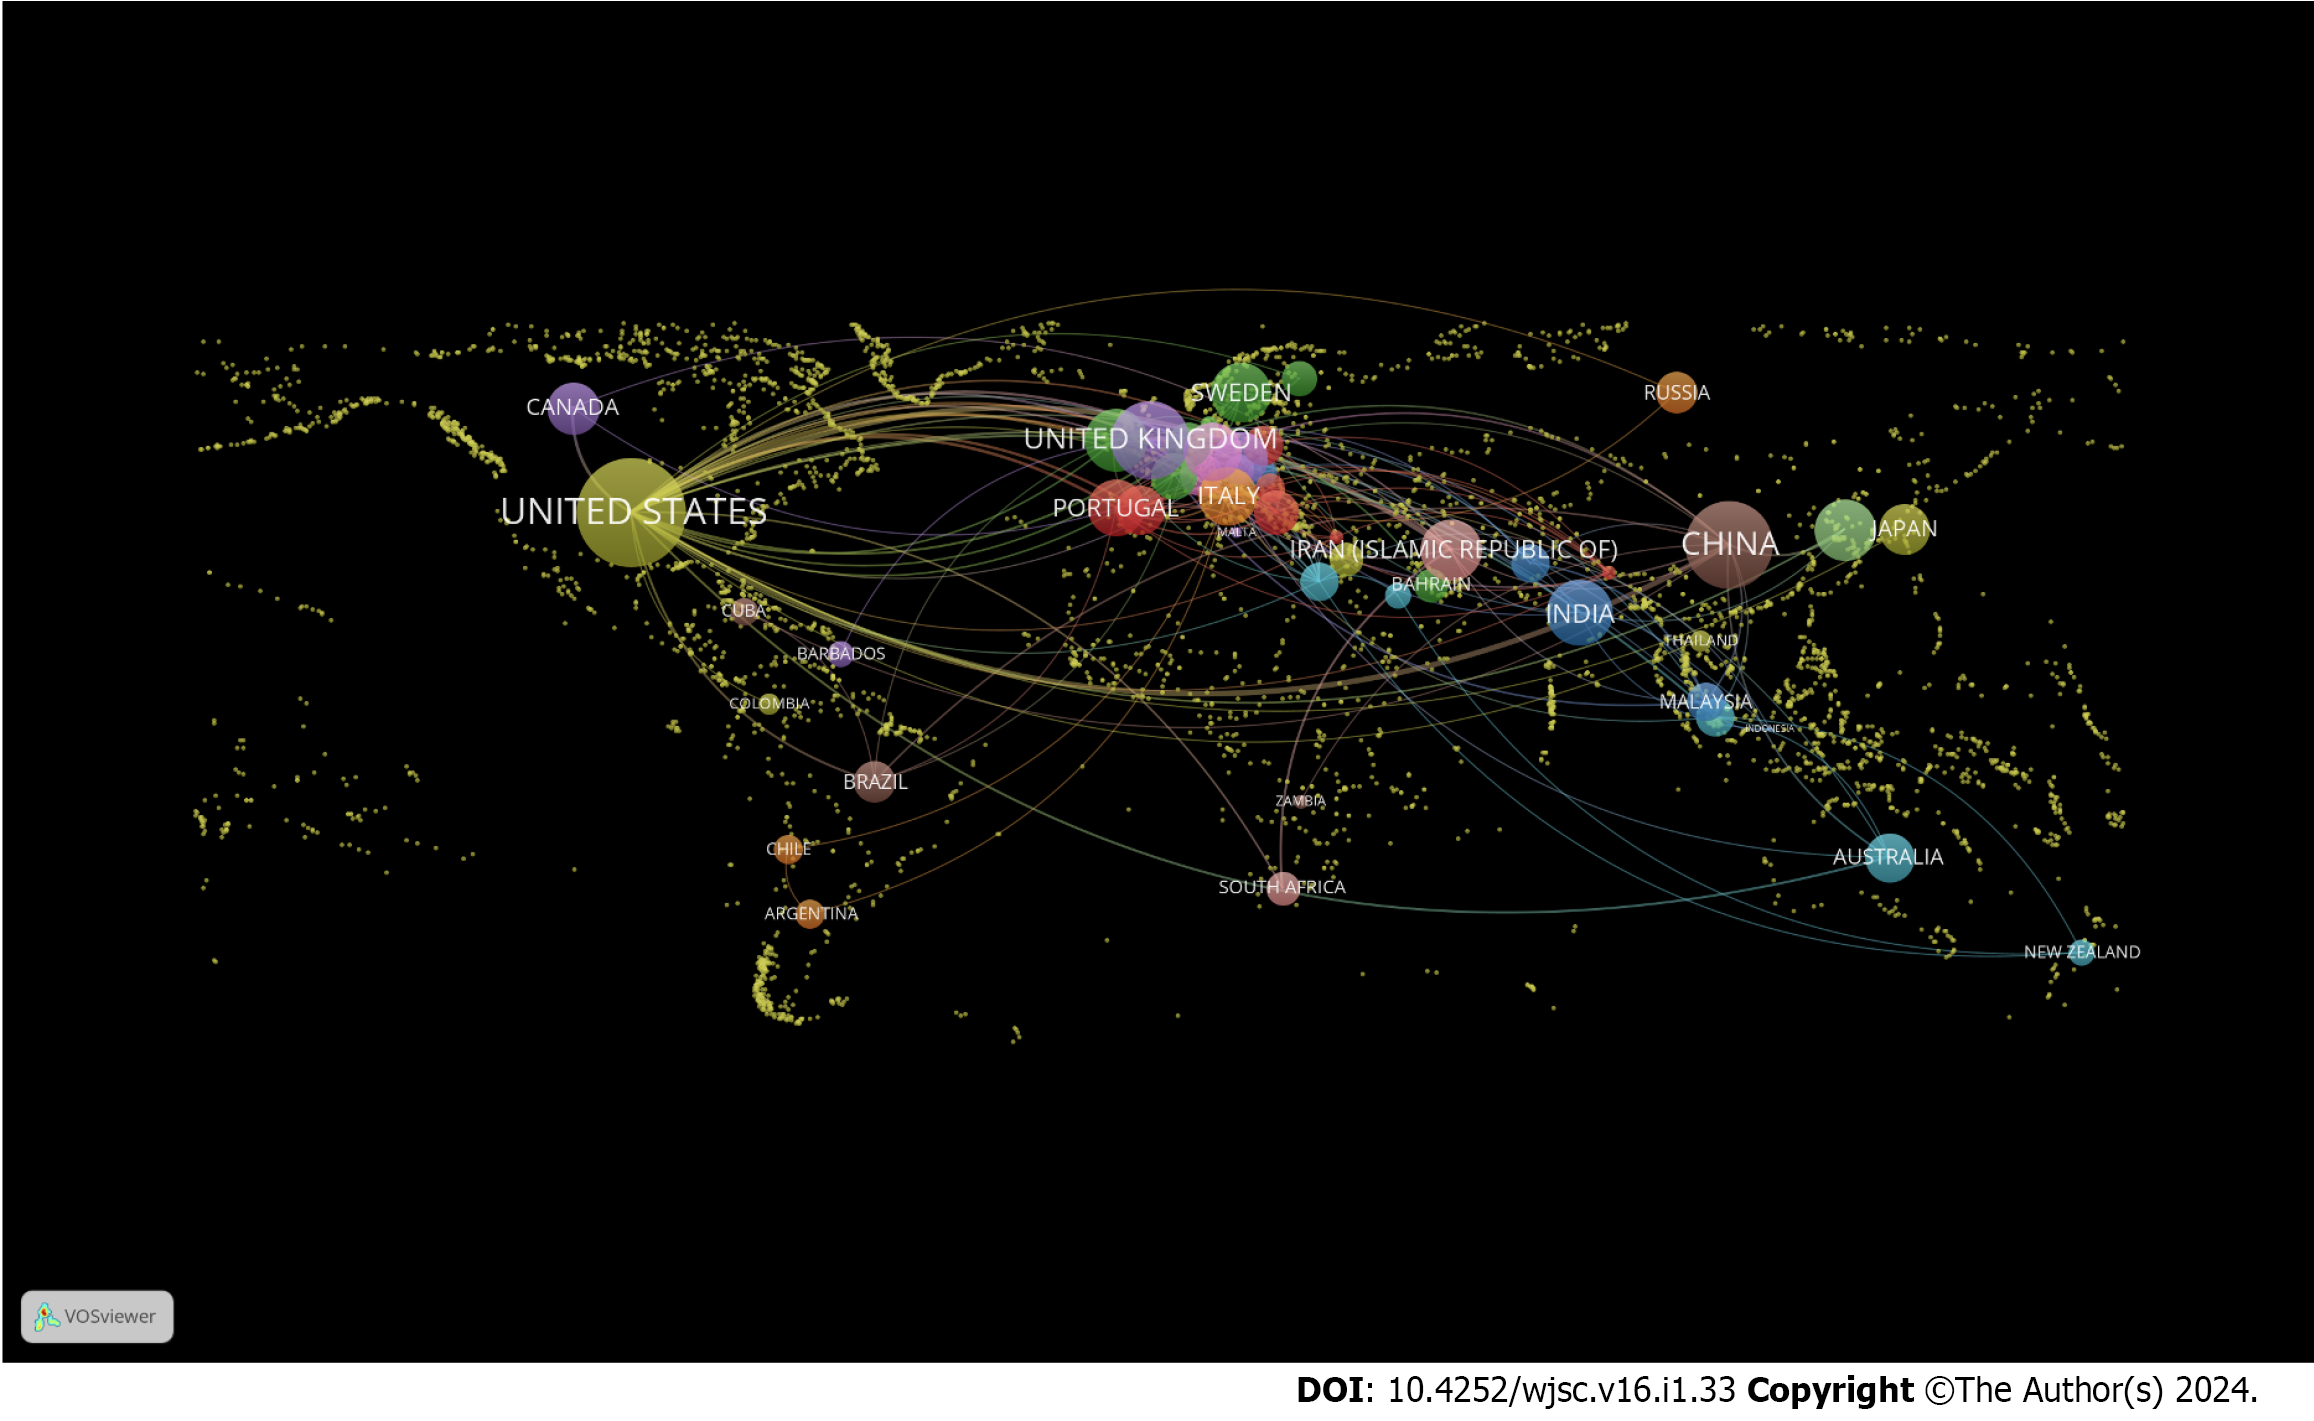
Figure 1 Geographical distribution of publications on stem cells in diabetic foot research.
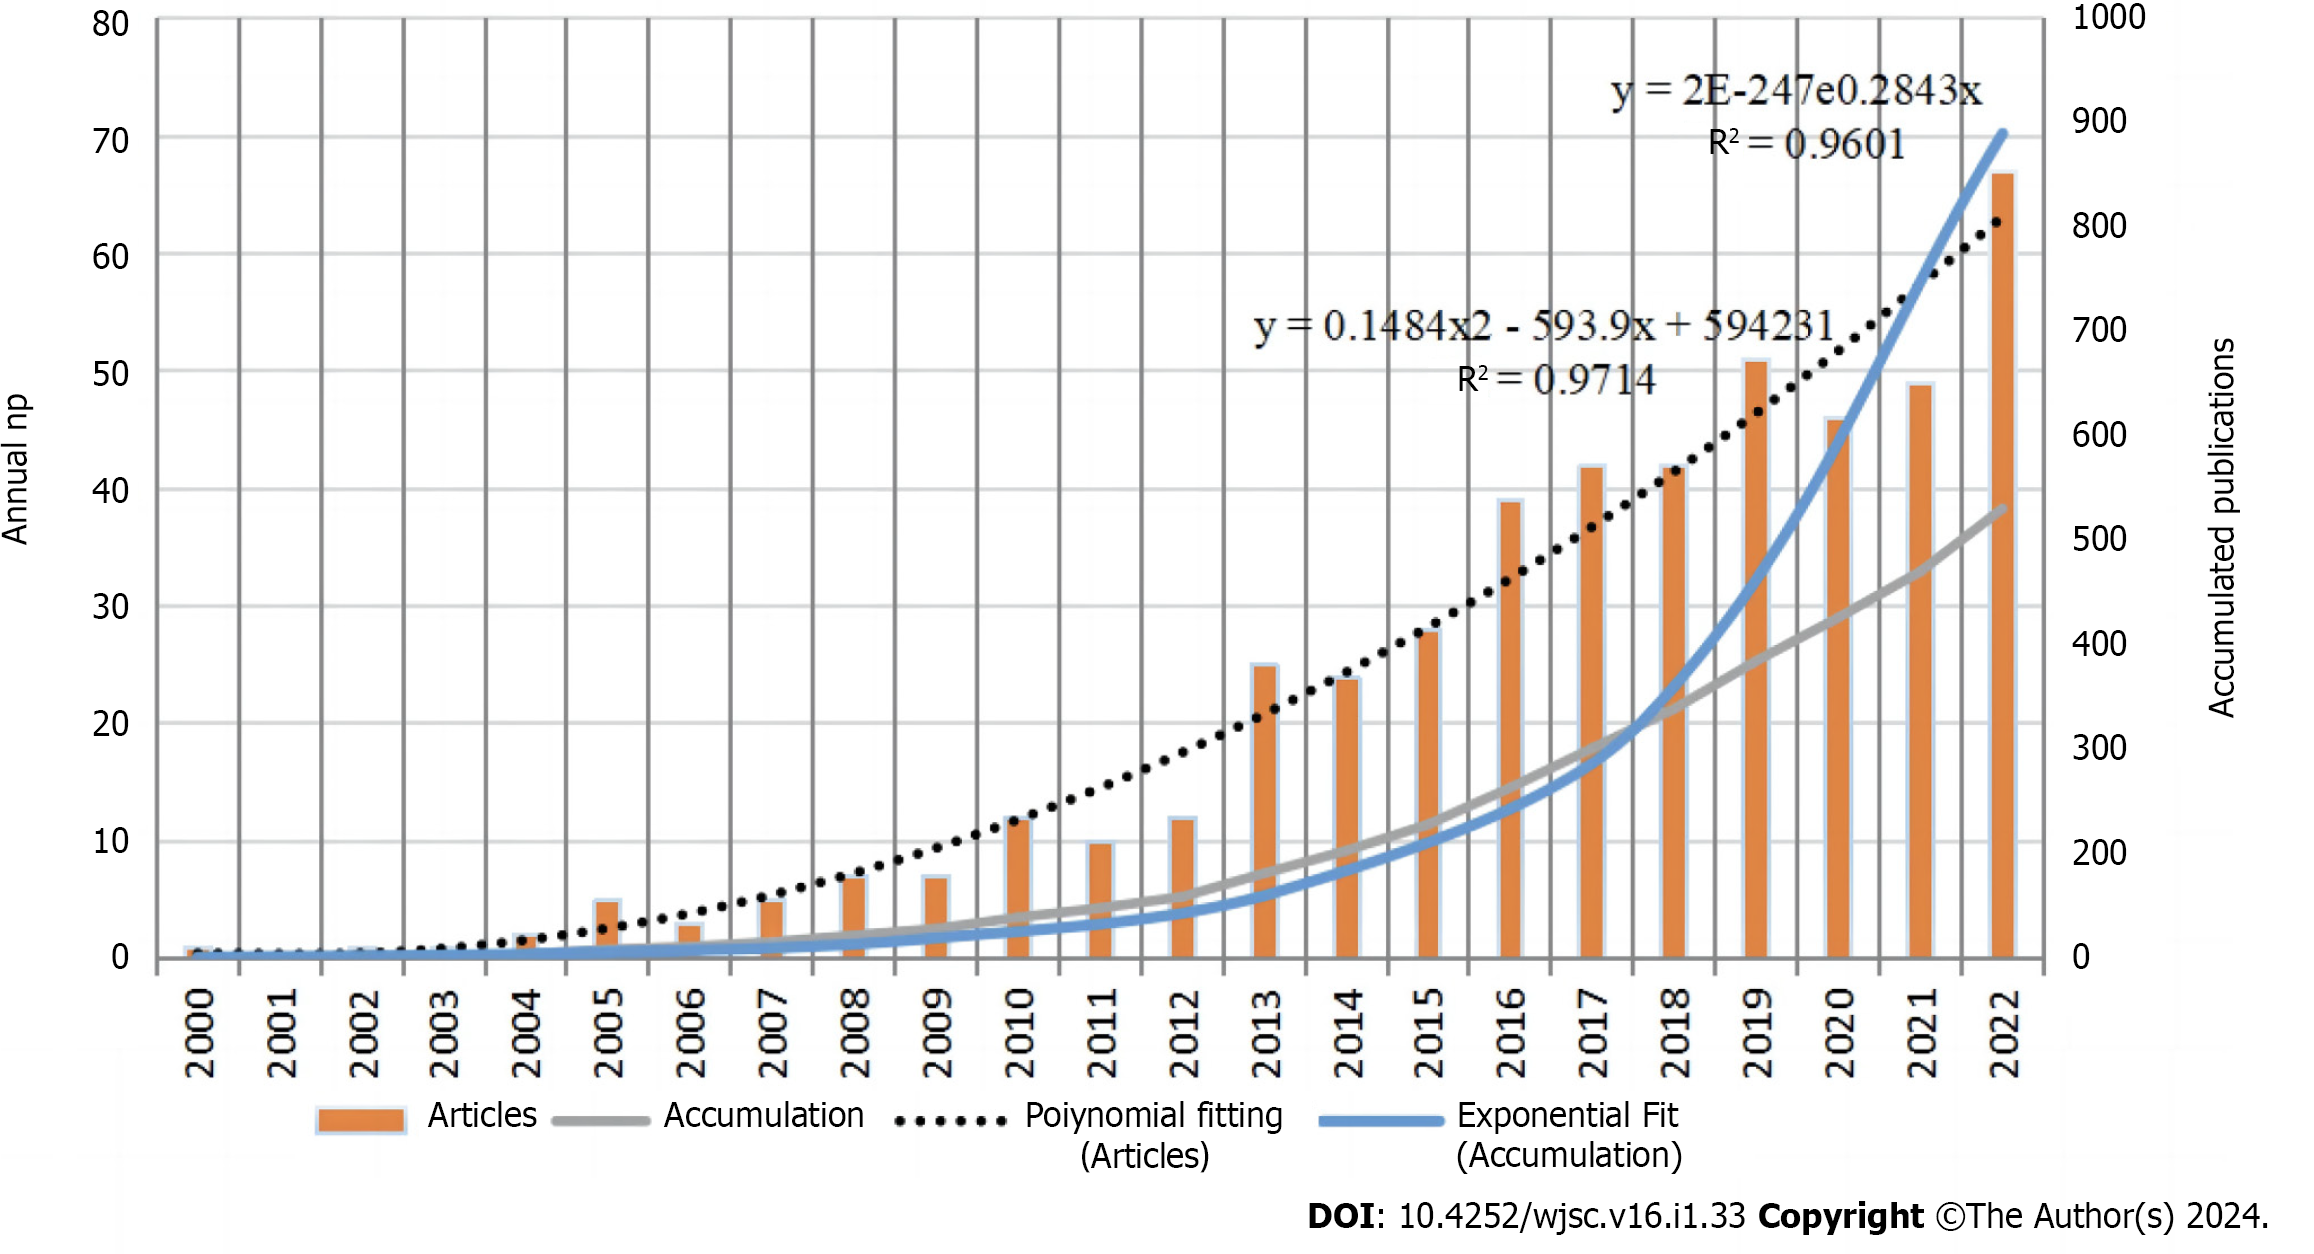
Figure 2 Publication count divided by year over the past 23 years.
Np: Number of publications.
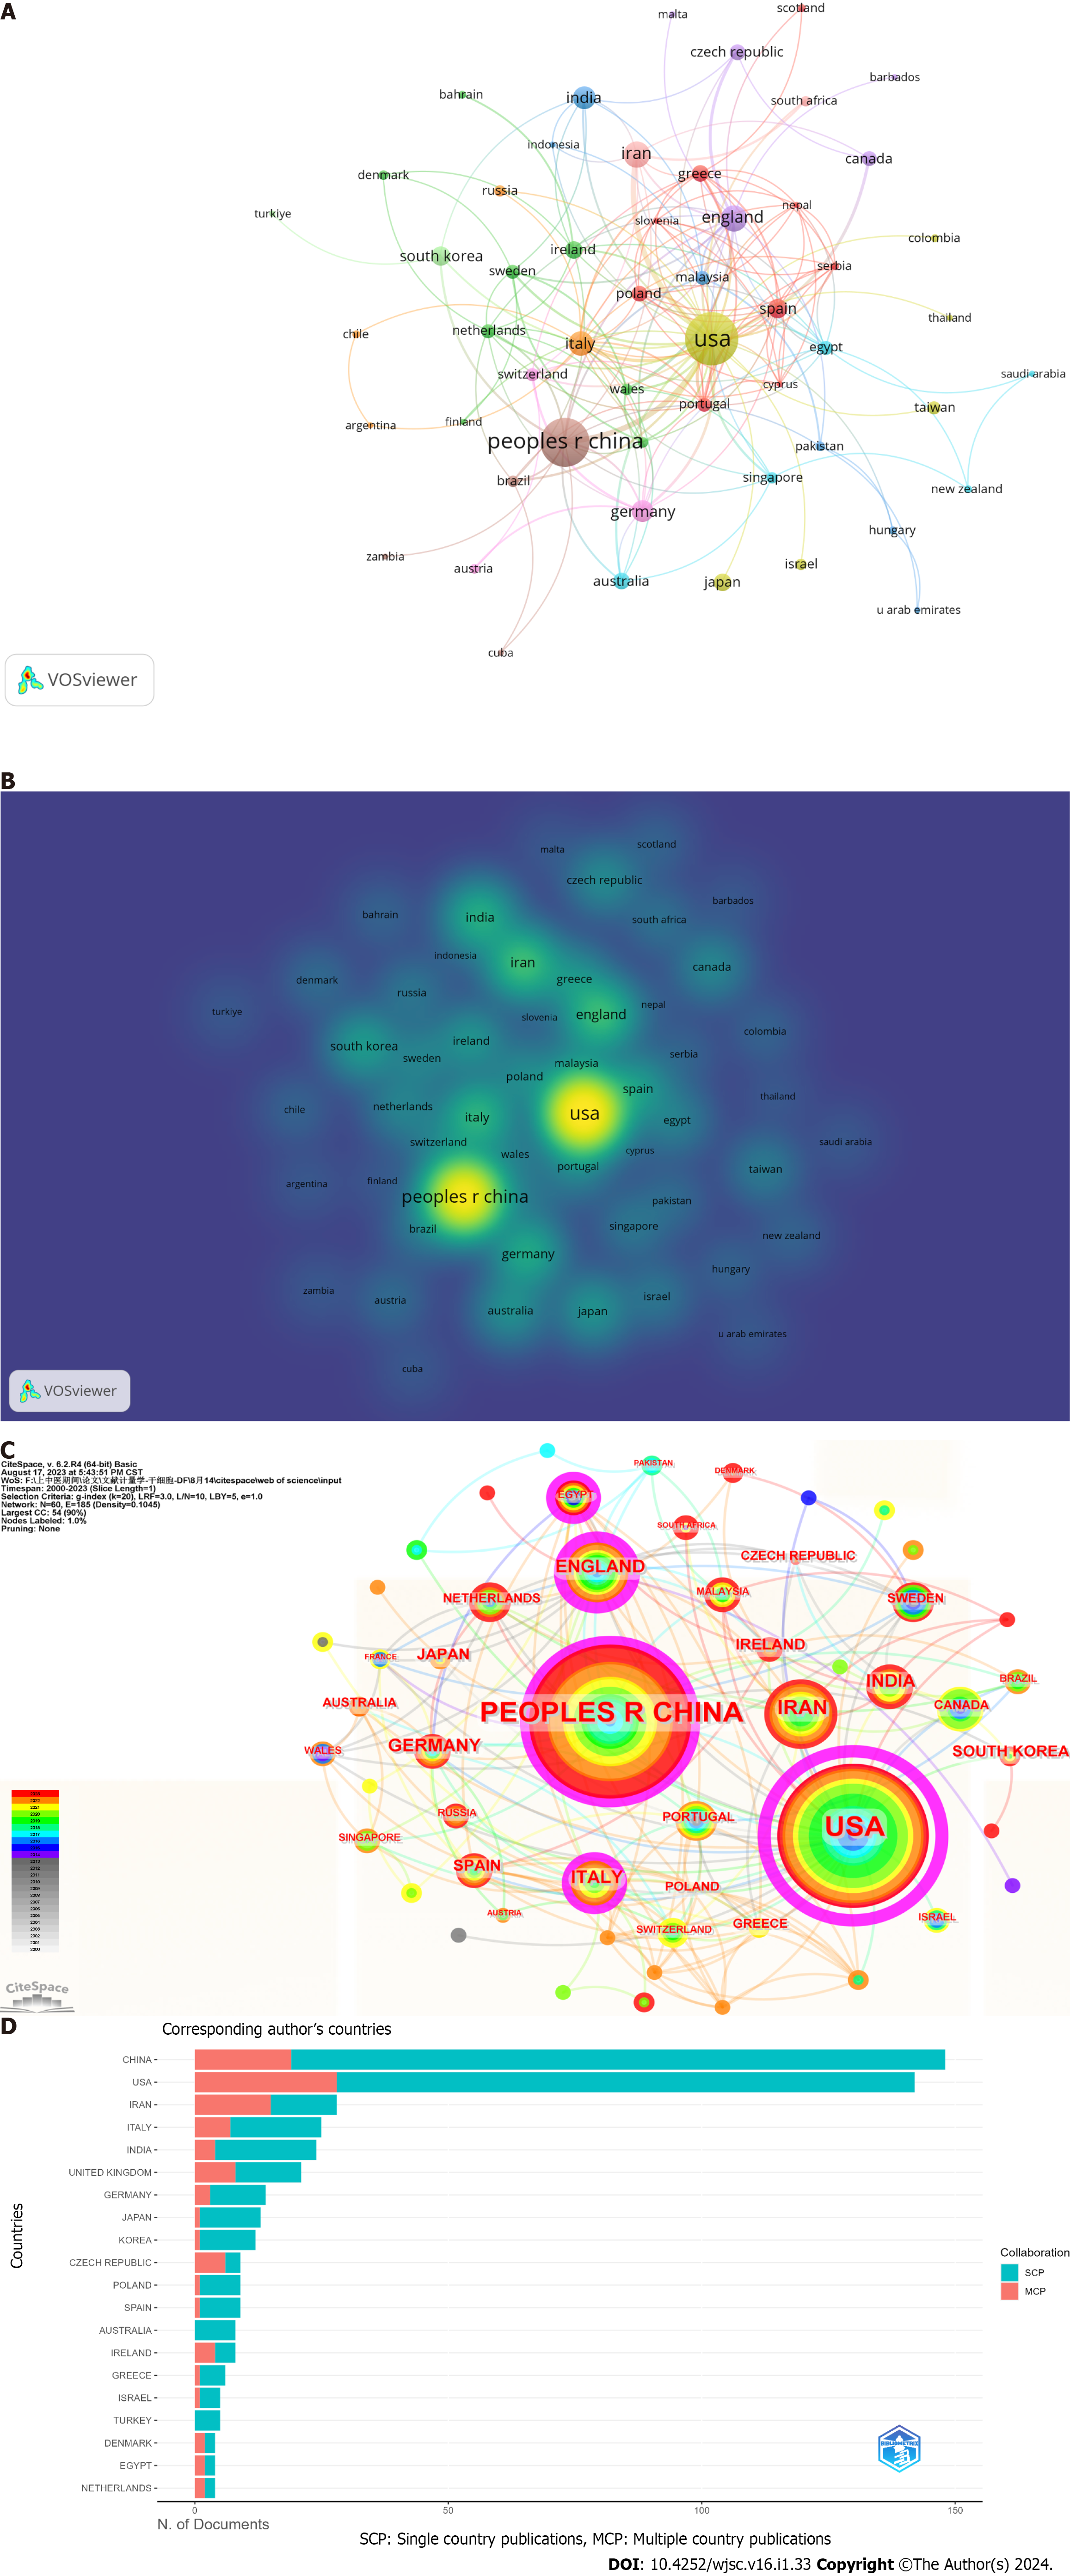
Figure 3 Contributions of different countries to research on stem cells in the diabetic foot field.
A: Network visualization of country collaboration; B: Density map of cooperation between countries; C: A network diagram showing international collaborations, with purple circles representing intermediation centrality; D: Top 20 countries for corresponding authors. MCP: Multiple-country publications; SCP: Single-country publications.
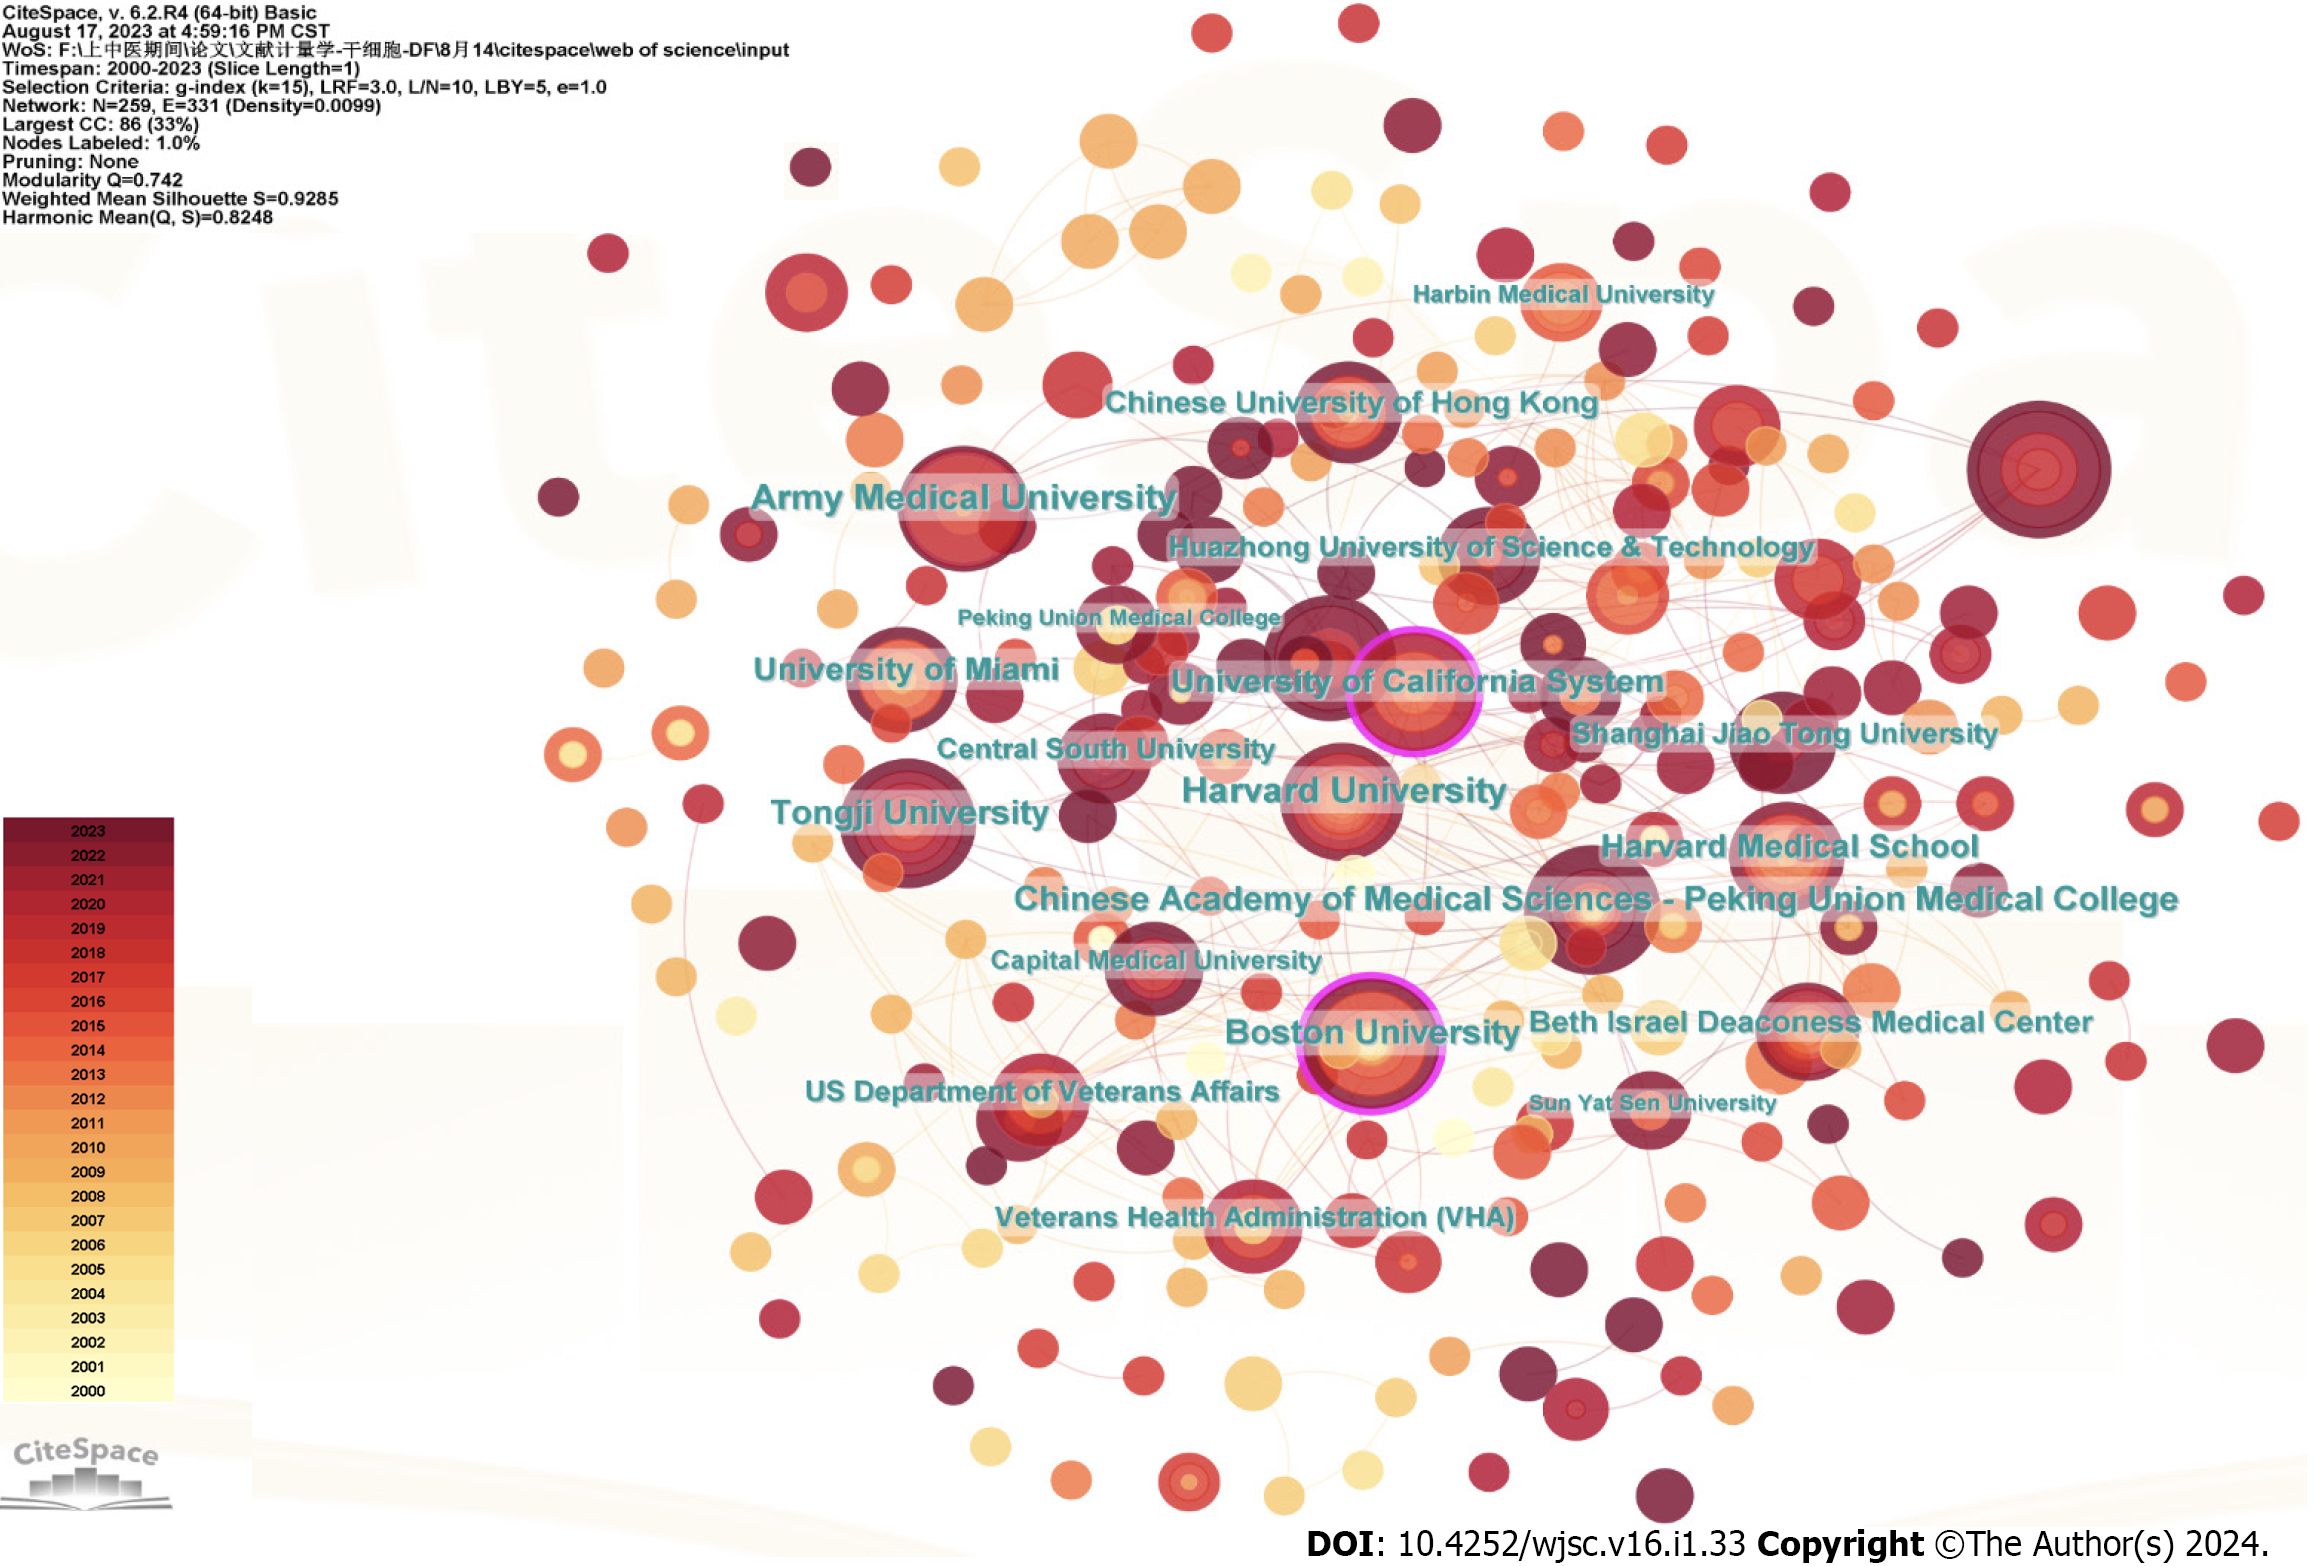
Figure 4 Institutional collaboration network diagram, with purple circles representing intermediation centrality.
Figure 5 Contributions of different authors to research on stem cells in the diabetic foot field.
A: Top 10 authors in terms of average publication count per year; B: Network visualization of country collaboration; C: Density map of cooperation between countries; D: Network diagram showing international collaborations, with purple circles representing intermediation centrality.
Figure 6 Contributions of different authors to research on stem cells in the diabetic foot field.
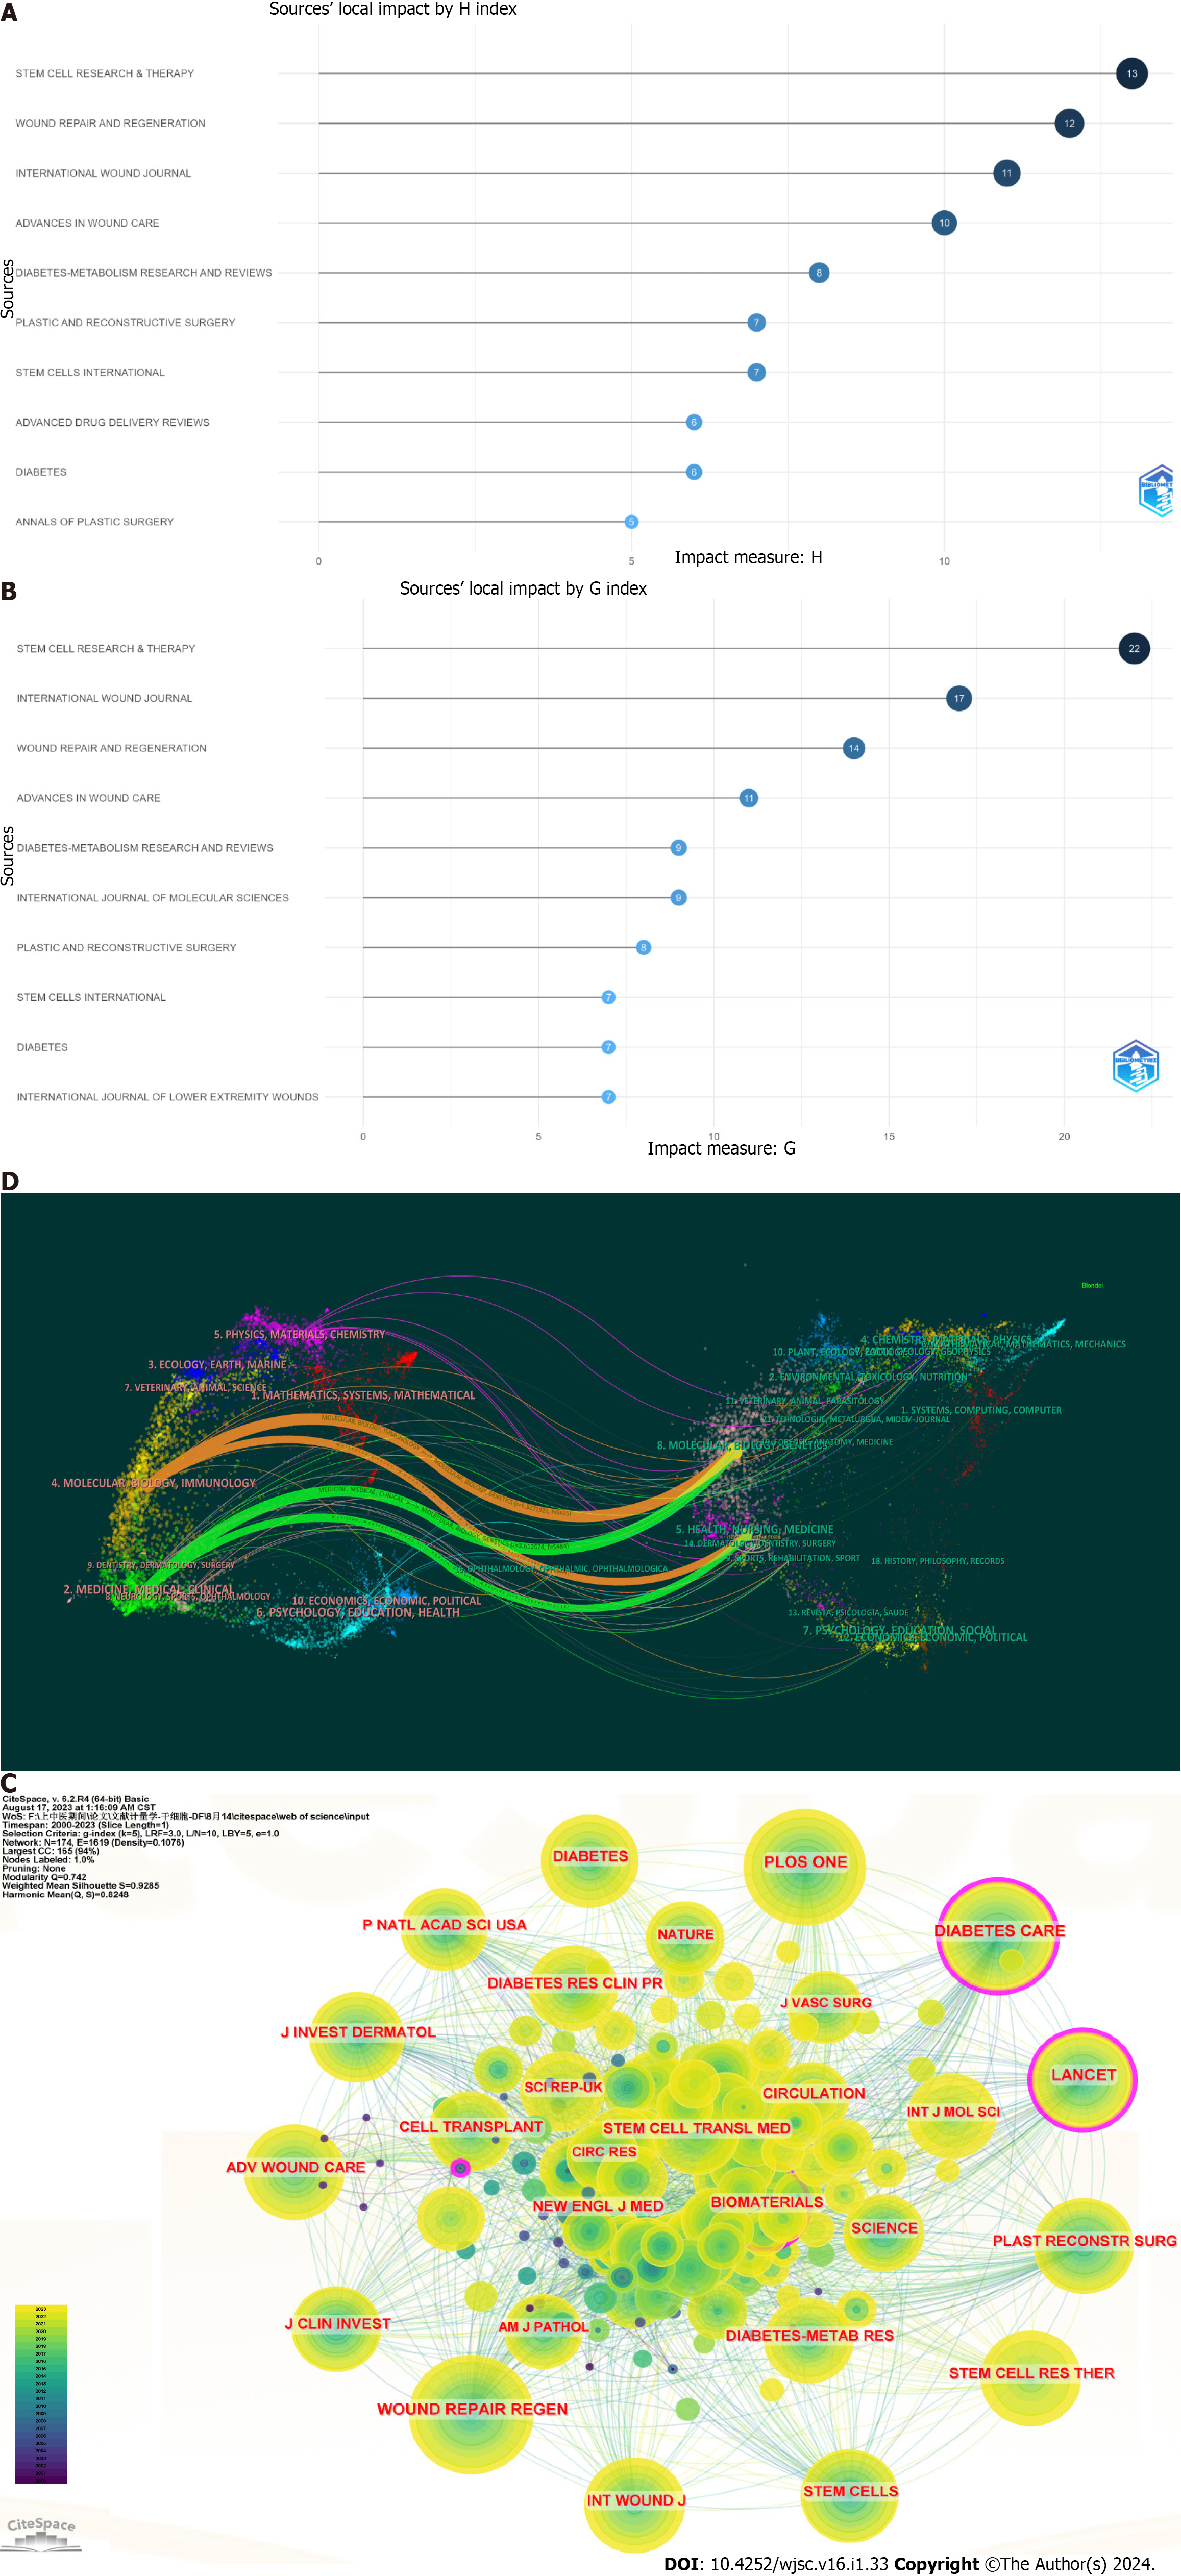
A: Top 10 journals in terms of h-index; B: Top 10 journals in terms of g-index; C: CiteSpace visualization of cocited journals; D: Biplot overlay of journals on stem cells in the diabetic foot field (left side represents areas covered by citing journals, and the right side represents areas covered by cited journals).
Figure 7 Analysis of cocited references.
A: Visualization of cocited references. Nodes represent cocited references, with red circles representing citation bursts references; B: Timeline graph of cluster analysis; C: Top 17 references with the strongest citation bursts.
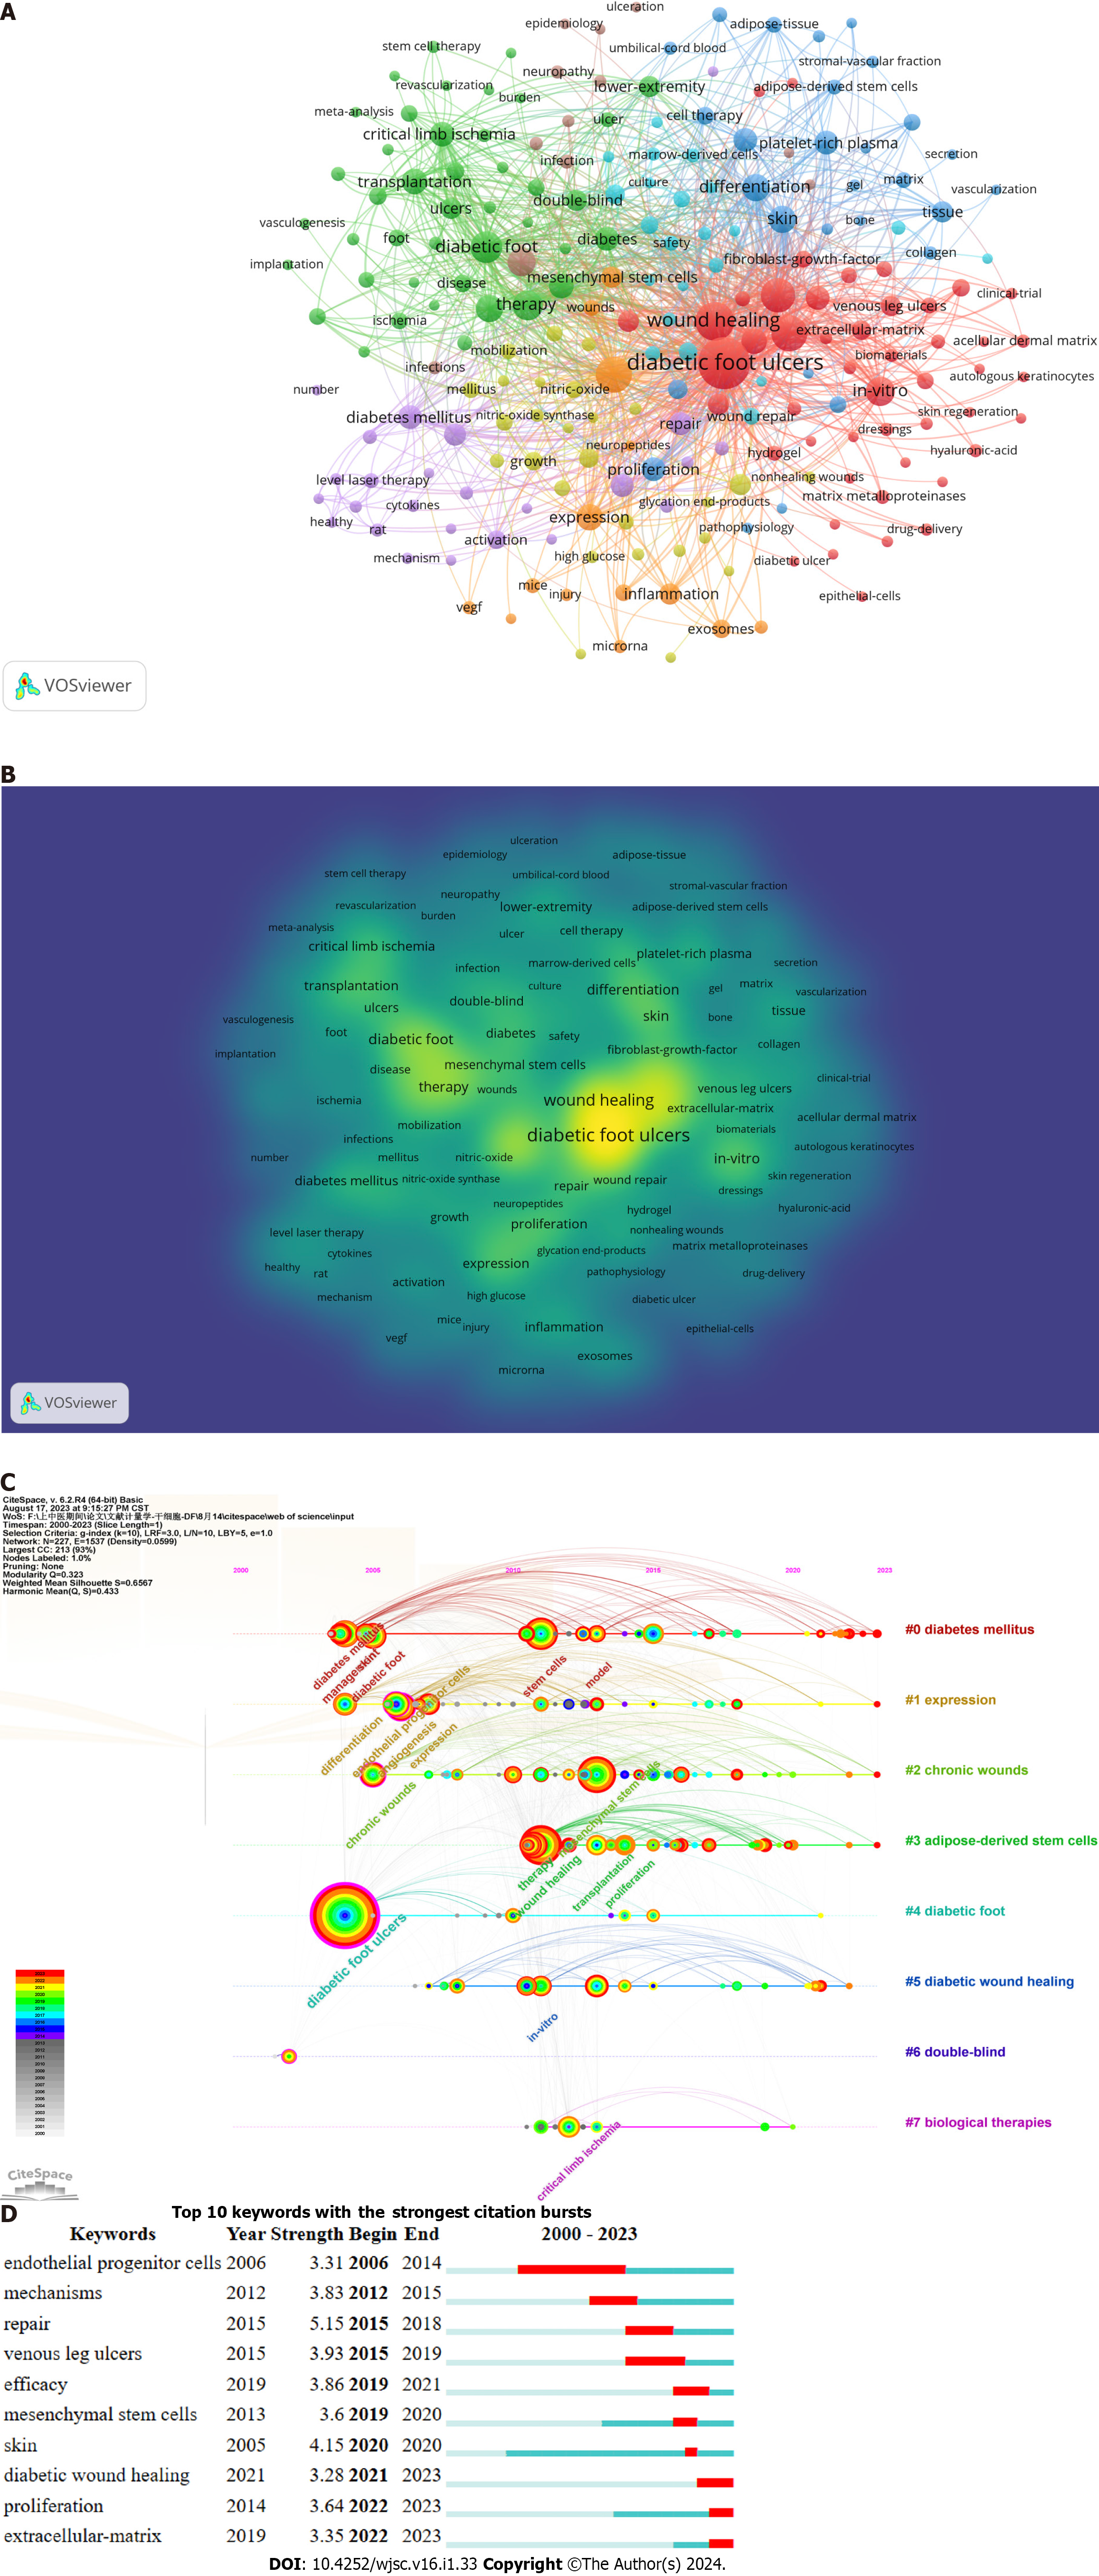
Figure 8 Analysis of keywords.
A: Co-occurrence and clustering of keywords; B: Density map of keywords co-occurrence; C: Top 8 cluster timeline distributions; D: Top 17 cocited references with the most citation burstiness.
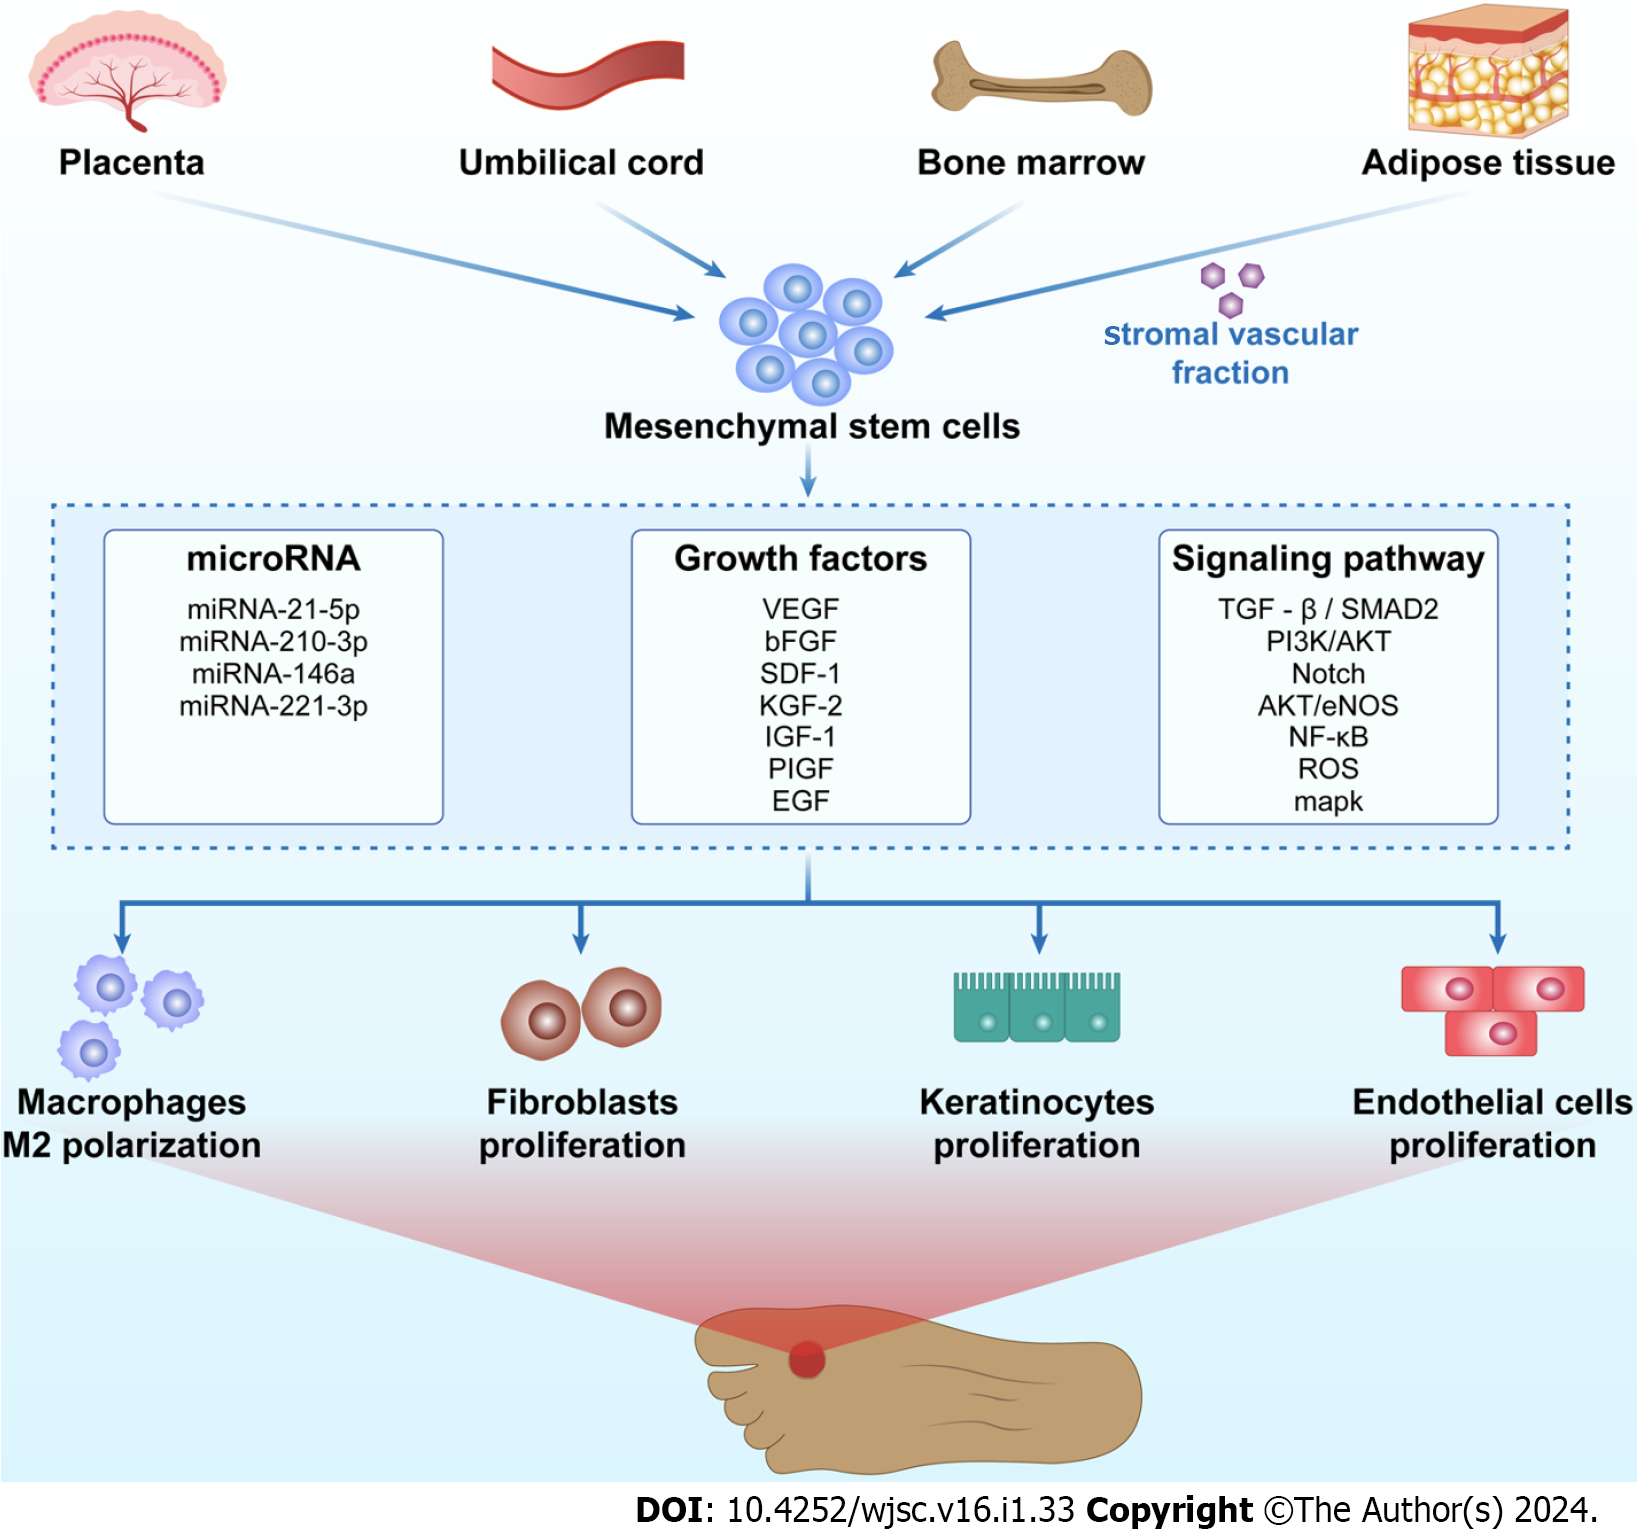
Figure 9 Mechanism diagram of stem cell research in the field of diabetic foot.
bFGF: Basic fibroblast growth factor; EGF: Epidermal growth factor; eNOS: Endothelial nitric oxide synthase; IGF: Insulin-like growth factor; KGF: Keratinocyte growth factor; NF-kB: Nuclear factor-kappa B; PI3K: Phosphatidylinositol 3-kinase; PIGF: Phosphorylated insulin-like growth factor; ROS: Reactive oxygen species; SDF: Stromal cell derived factor; TGF-β: Transforming growth factor-β; VEGF: Vascular endothelial growth factor.
- Citation: Shi HS, Yuan X, Wu FF, Li XY, Fan WJ, Yang X, Hu XM, Liu GB. Research progress and challenges in stem cell therapy for diabetic foot: Bibliometric analysis and perspectives. World J Stem Cells 2024; 16(1): 33-53
- URL: https://www.wjgnet.com/1948-0210/full/v16/i1/33.htm
- DOI: https://dx.doi.org/10.4252/wjsc.v16.i1.33


