Copyright
©The Author(s) 2023.
World J Stem Cells. Apr 26, 2023; 15(4): 268-280
Published online Apr 26, 2023. doi: 10.4252/wjsc.v15.i4.268
Published online Apr 26, 2023. doi: 10.4252/wjsc.v15.i4.268
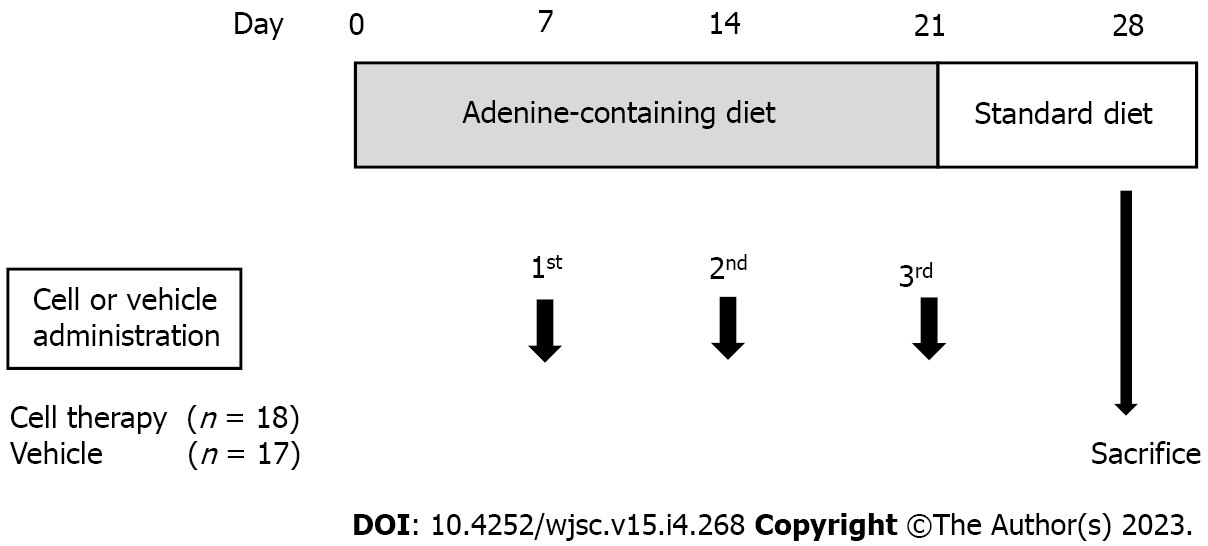
Figure 1 Experimental design.
The adenine-containing diet was fed from day 0 to day 21, and switched to a standard laboratory diet from day 22 to day 28. Vehicle (IMDM) or UCB-CD34+ cells in IMDM were administered on days 7, 14, and 21 via the tail vein in the control group and cell therapy group, respectively. IMDM: Iscove’s modified Dulbecco’s medium; UCB: Umbilical cord blood.
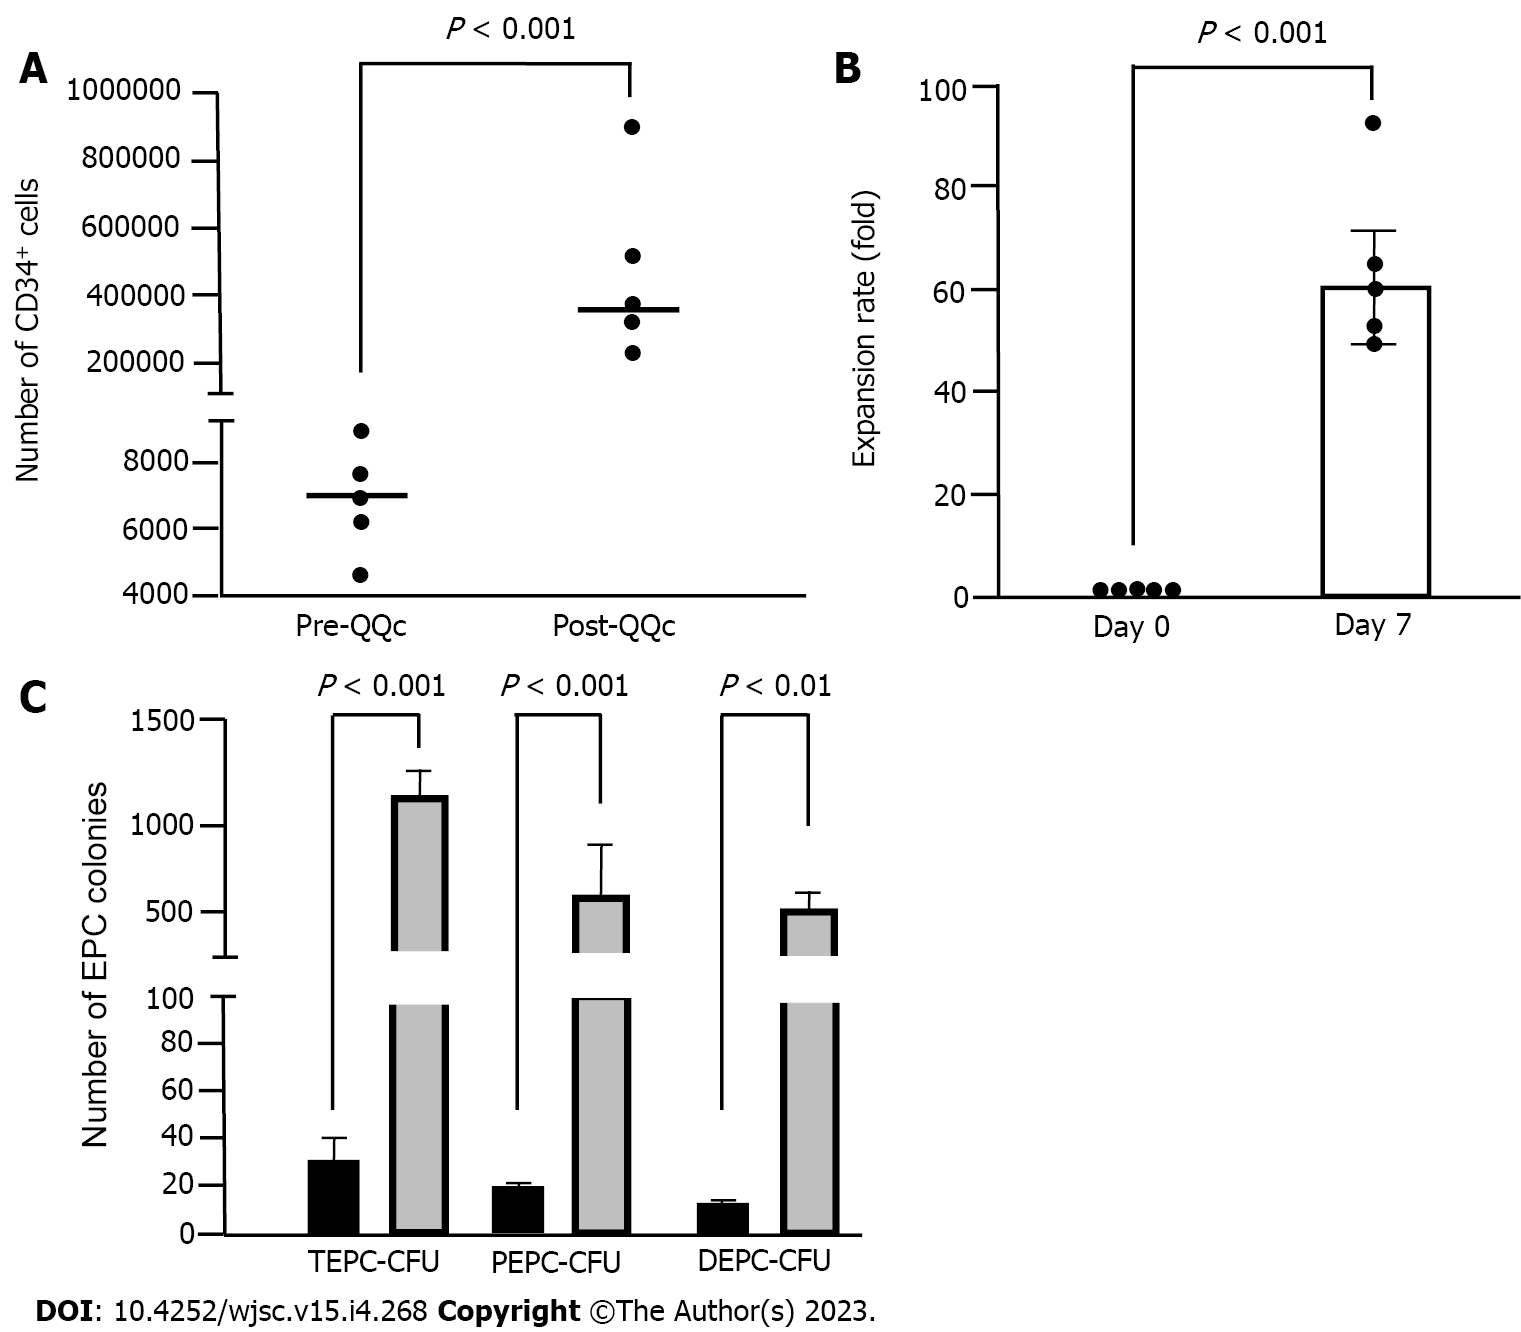
Figure 2 CD34+ cell and endothelial progenitor cell colony-forming units expansion by quality and quantity culture method.
A: Number of total CD34+ cells. The plot graph demonstrates CD34+ positivity per 1 × 10⁴ fresh UCB-CD34+ sample and post-culture CD34+ cell number per 1 × 10⁴ initially seeded cells; B: Expansion rate of CD34+ cells. The expansion rate of CD34+ cells from fresh CD34+ cells (day 0) to cultured CD34+ cells (day 7); C: Endothelial progenitor cells (EPC) colony-forming unit. The number of TEPC-CFUs, primitive EPC-CFUs, and definitive EPC-CFUs of post- quality and quantity culture (QQc) CD34+ cells. Gray column: Significantly increased compared with that of pre-QQc CD34+ cells; black column: Statistical significances in Figure 2A-C were determined using Mann-Whitney U test. UCB: Umbilical cord blood; EPC: Endothelial progenitor cell; CFU: Colony-forming unit; QQc: Quality and quantity culture; TEPC: Total endothelial progenitor cell; PEPC: Primitive endothelial progenitor cell; DEPC: Definite endothelial progenitor cell.
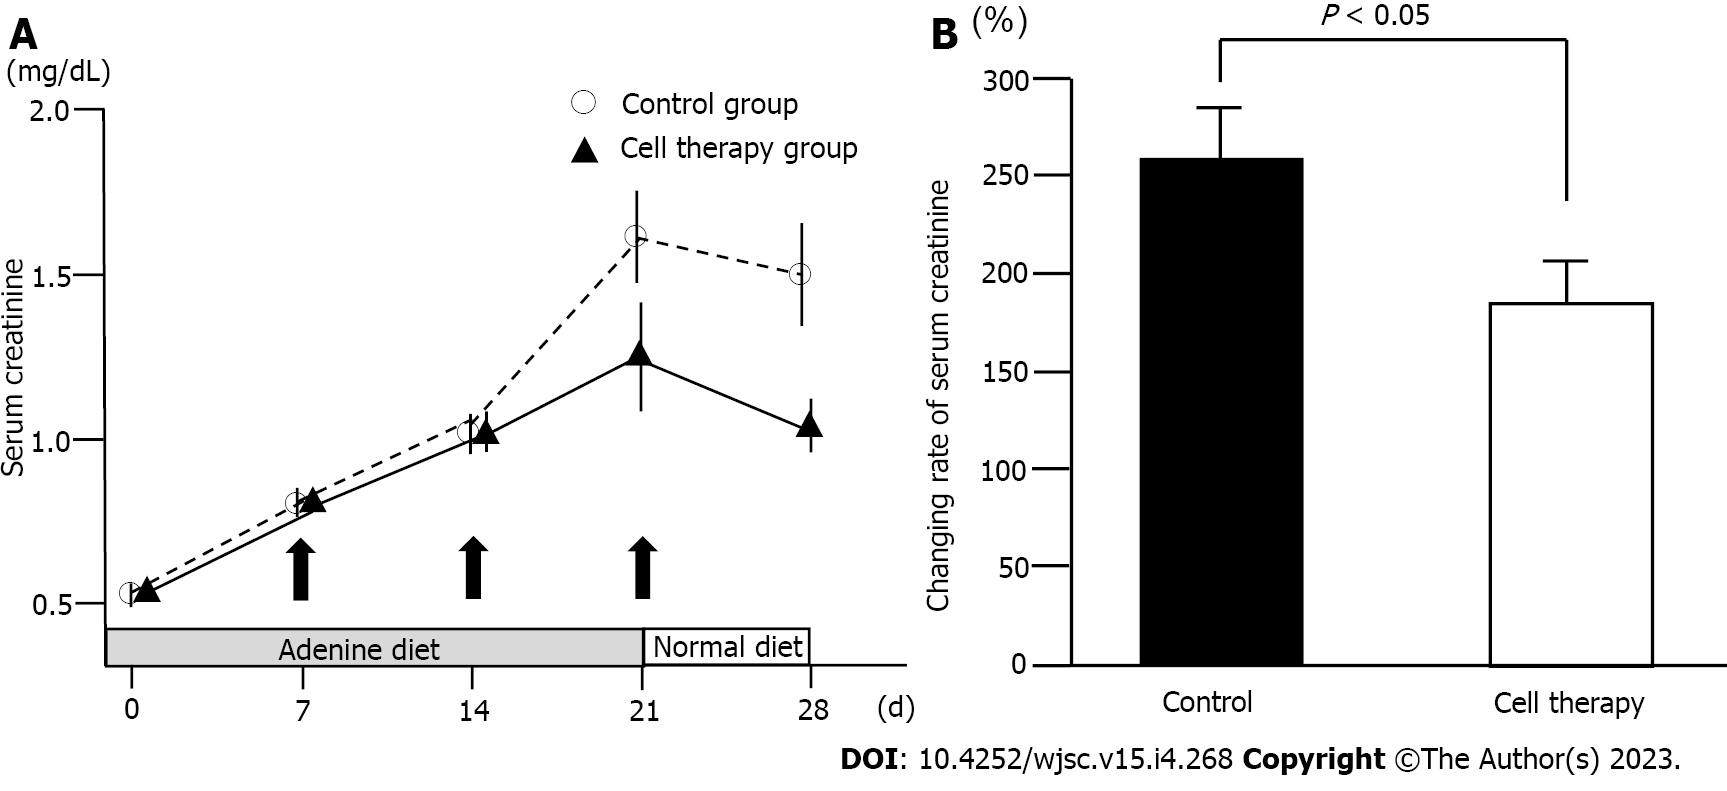
Figure 3 Changes in serum creatinine levels.
A: Time-course of serum creatinine levels in the control group (n = 17) and cell therapy group (n = 18). The P value between the control group and the cell therapy group on day 28 was 0.06; B: Change rate of serum creatinine levels from baseline to day 28 in the control and cell therapy groups. Statistical significance in Figure 3A was determined using repeated measures analysis of variance. Statistical significance in Figure 3B was determined using Mann-Whitney U test.
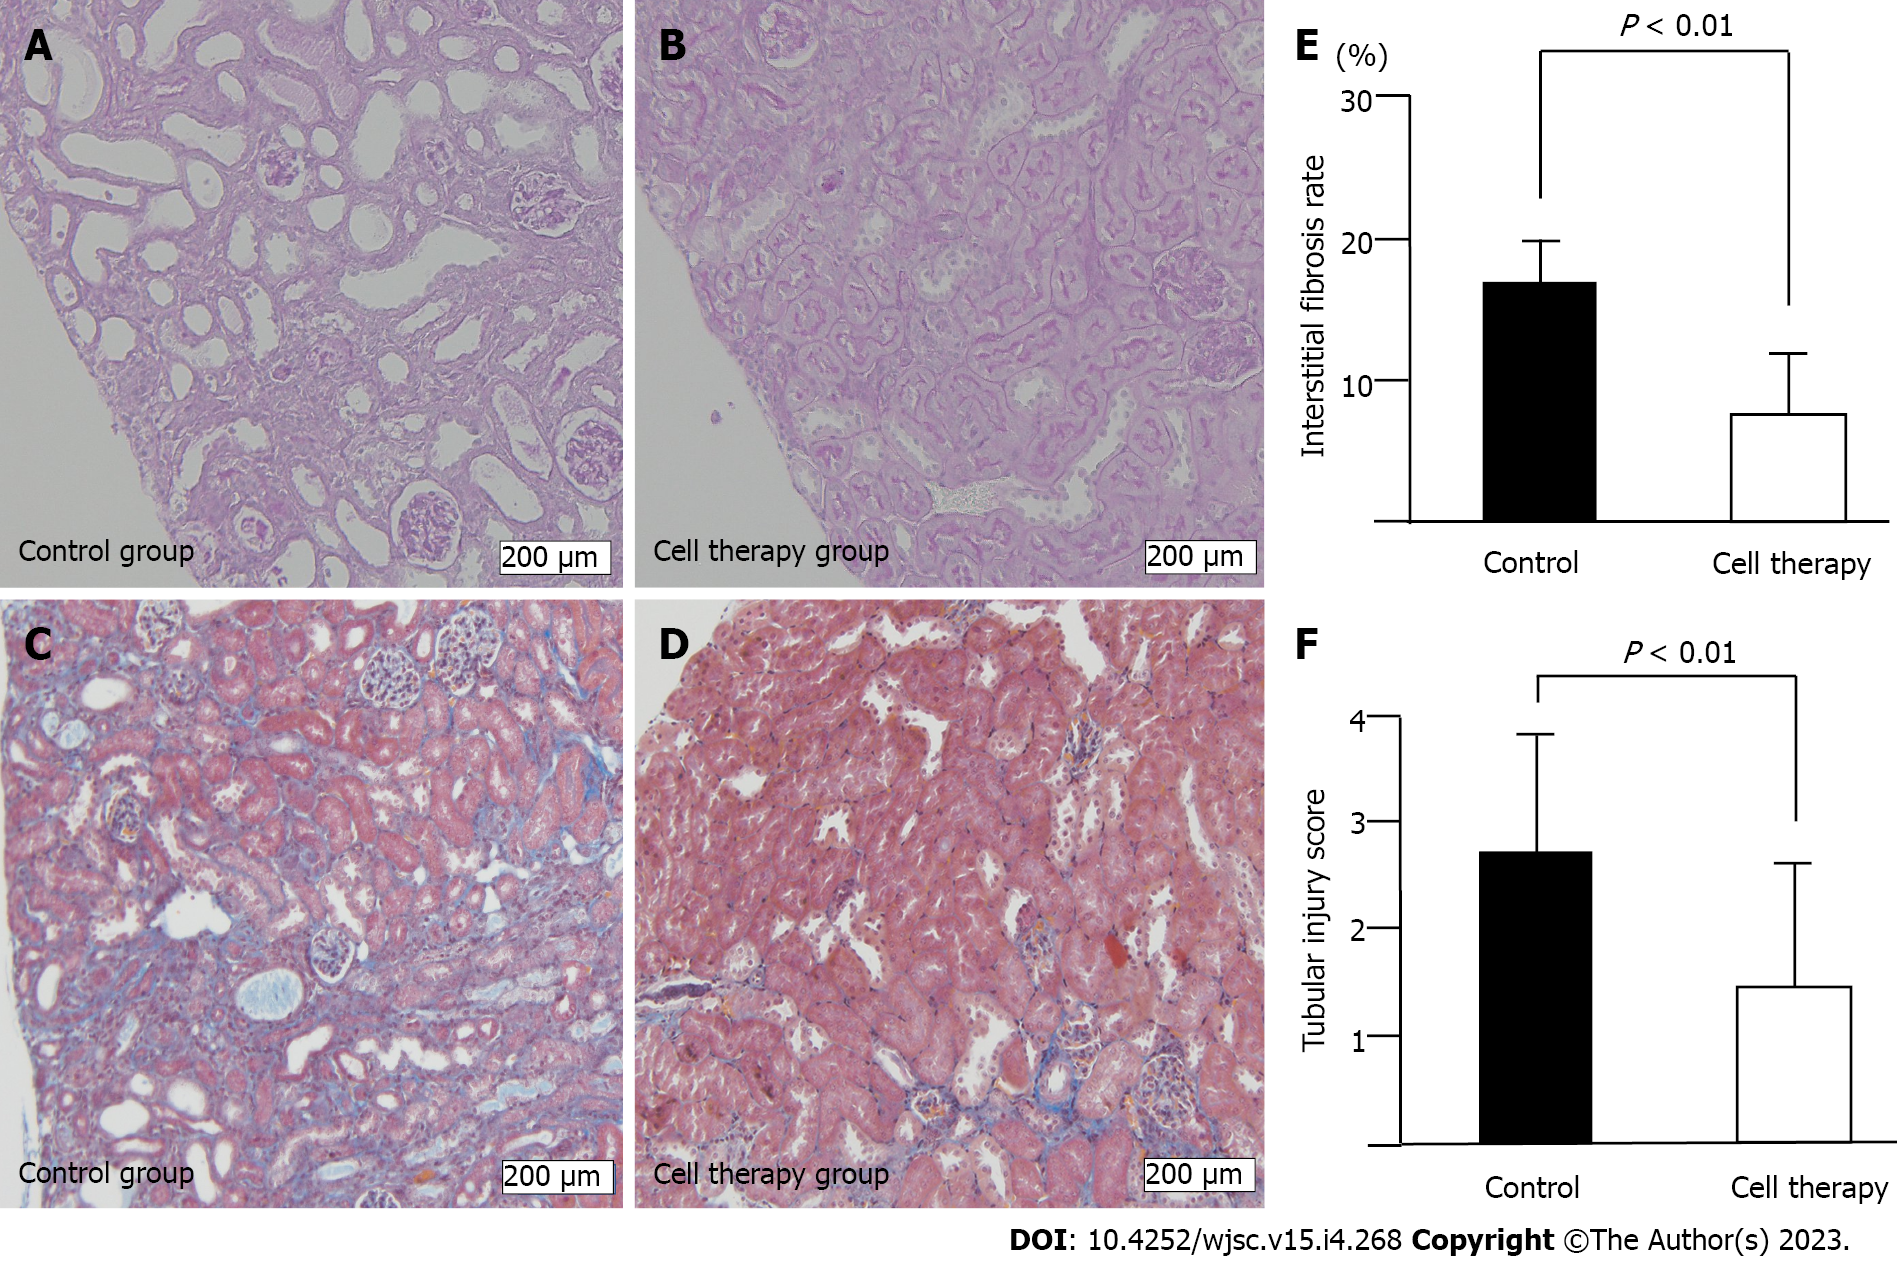
Figure 4 Histological analysis of renal injury.
A and B: Tubular injury including tubular dilatation, tubular epithelial atrophy, and tubular atrophy, evaluated using periodic acid-Schiff-stained renal tissue sections of control group (A) and cell therapy group (B); C and D: Interstitial fibrosis using Masson’s trichrome stained sections of control group (C) and cell therapy group (D). Scale bar: 200 μm; E: Quantitative analysis of interstitial fibrosis rate, and F: semi-quantitative analysis of tubular injury score. Statistical significance of Figure 4E and F were determined using Mann-Whitney U test.
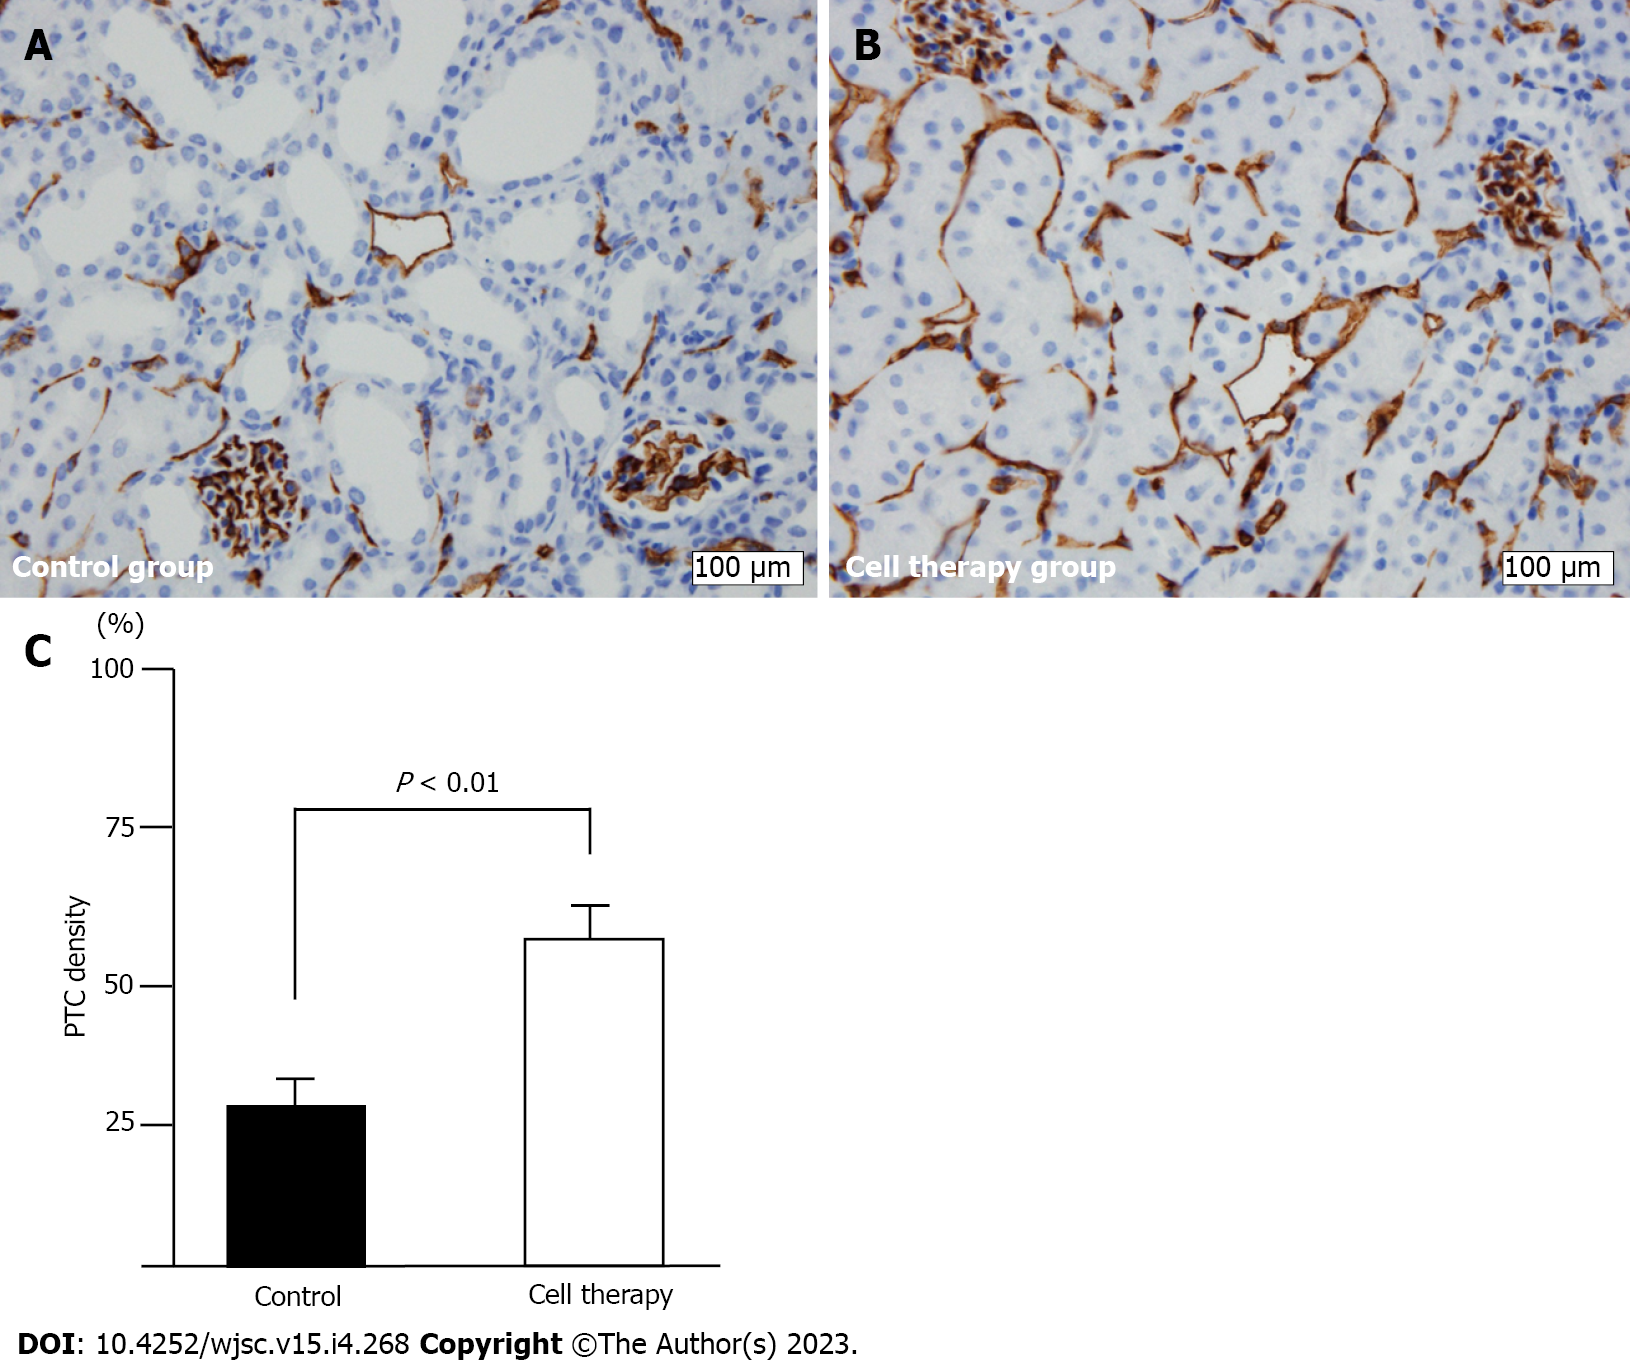
Figure 5 Peritubular capillary density evaluation using CD31+ staining.
A and B: CD31+ immunostaining of peritubular capillary (PTC) in control group (A) and cell therapy group (B); original magnification (× 400). Scale bar: 100 μm; C: Quantitative analysis of PTC density. Statistical significance in Figure 5C was determined using Mann-Whitney U test.
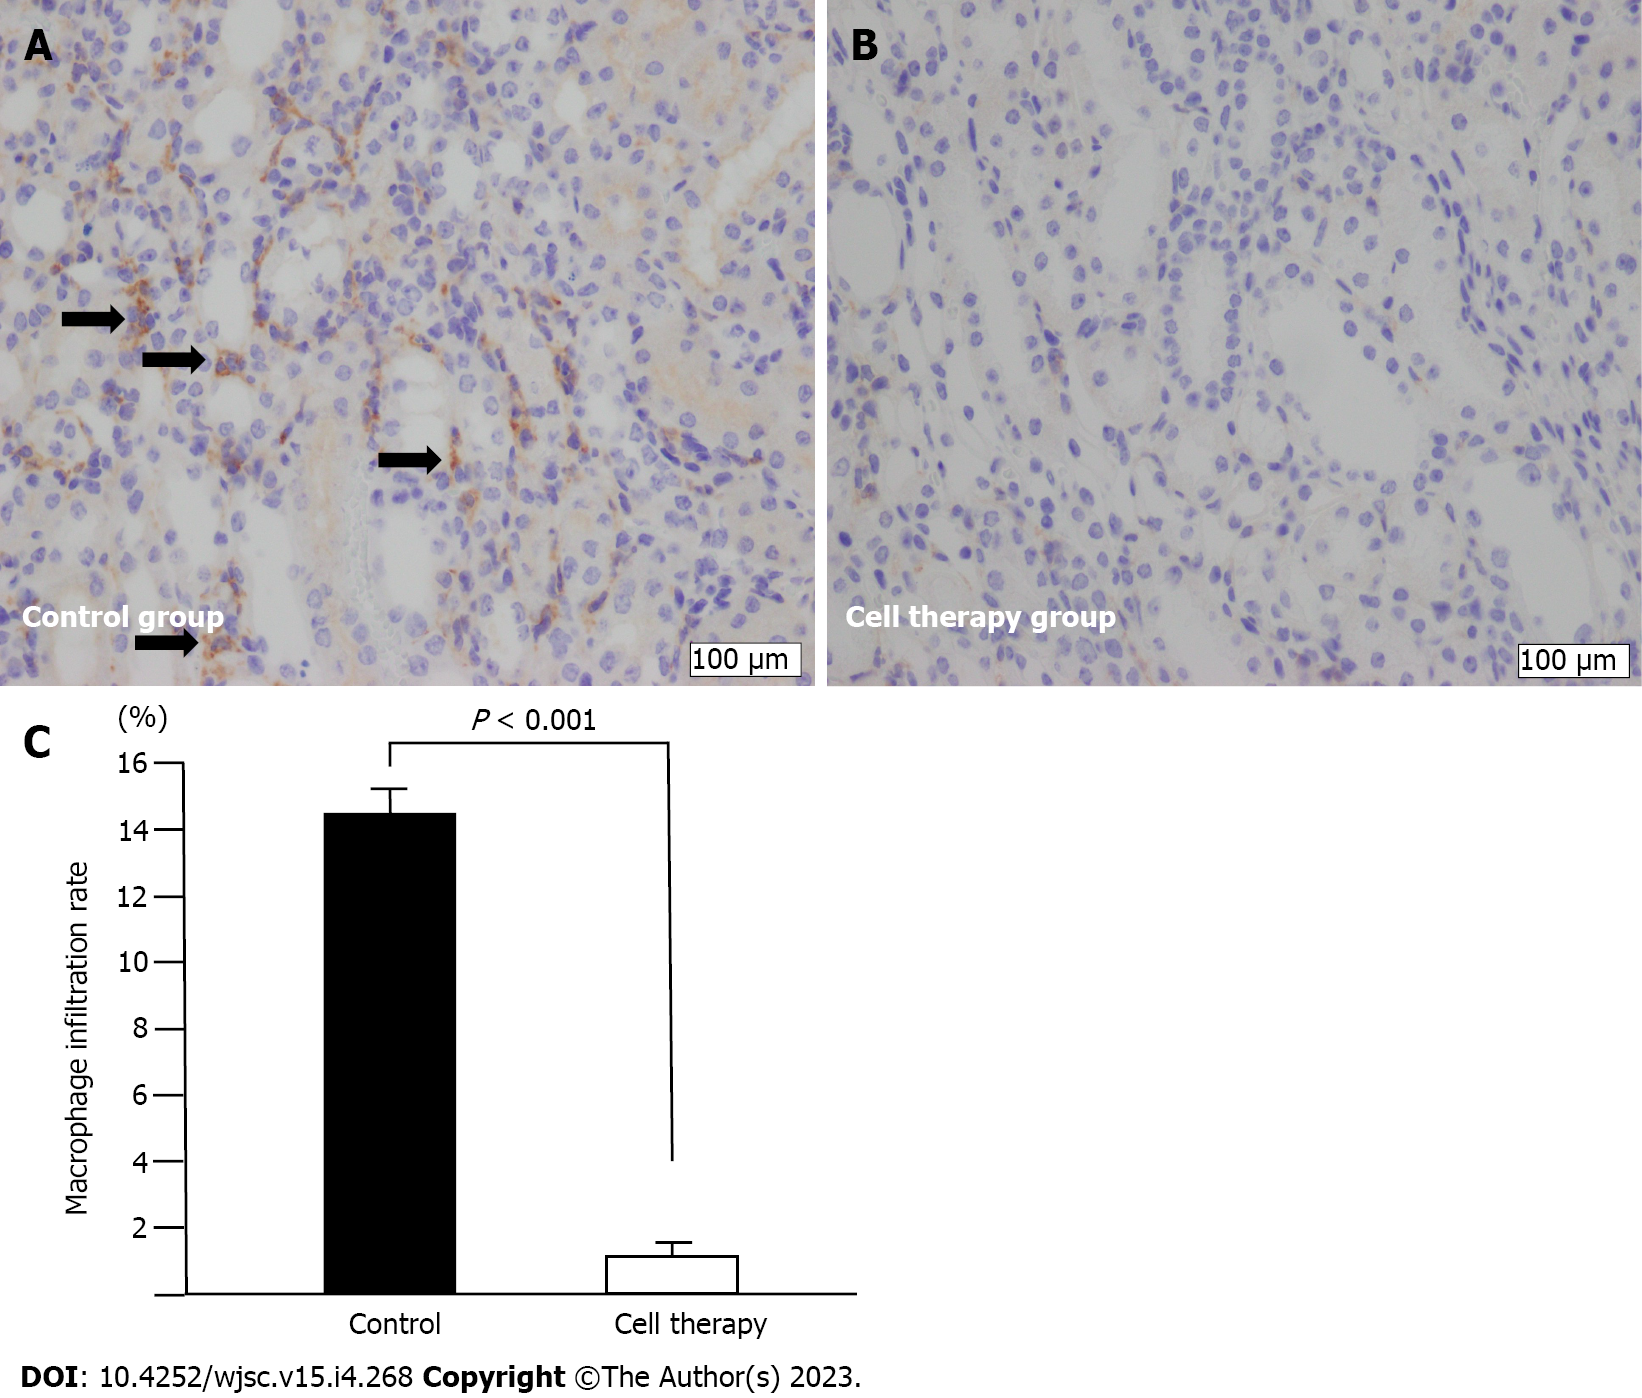
Figure 6 Macrophage infiltration analysis.
A and B: F4/80+ macrophage immunostaining (arrows) in control group (A) and cell therapy group (B); original magnification (× 400). Scale bar: 100 μm; C: Quantitative analysis of the rate of macrophage infiltration area. Statistical significance in Figure 6C was determined using Mann-Whitney U test.
- Citation: Ohtake T, Itaba S, Salybekov AA, Sheng Y, Sato T, Yanai M, Imagawa M, Fujii S, Kumagai H, Harata M, Asahara T, Kobayashi S. Repetitive administration of cultured human CD34+ cells improve adenine-induced kidney injury in mice. World J Stem Cells 2023; 15(4): 268-280
- URL: https://www.wjgnet.com/1948-0210/full/v15/i4/268.htm
- DOI: https://dx.doi.org/10.4252/wjsc.v15.i4.268


