Copyright
©The Author(s) 2023.
World J Stem Cells. Apr 26, 2023; 15(4): 248-267
Published online Apr 26, 2023. doi: 10.4252/wjsc.v15.i4.248
Published online Apr 26, 2023. doi: 10.4252/wjsc.v15.i4.248
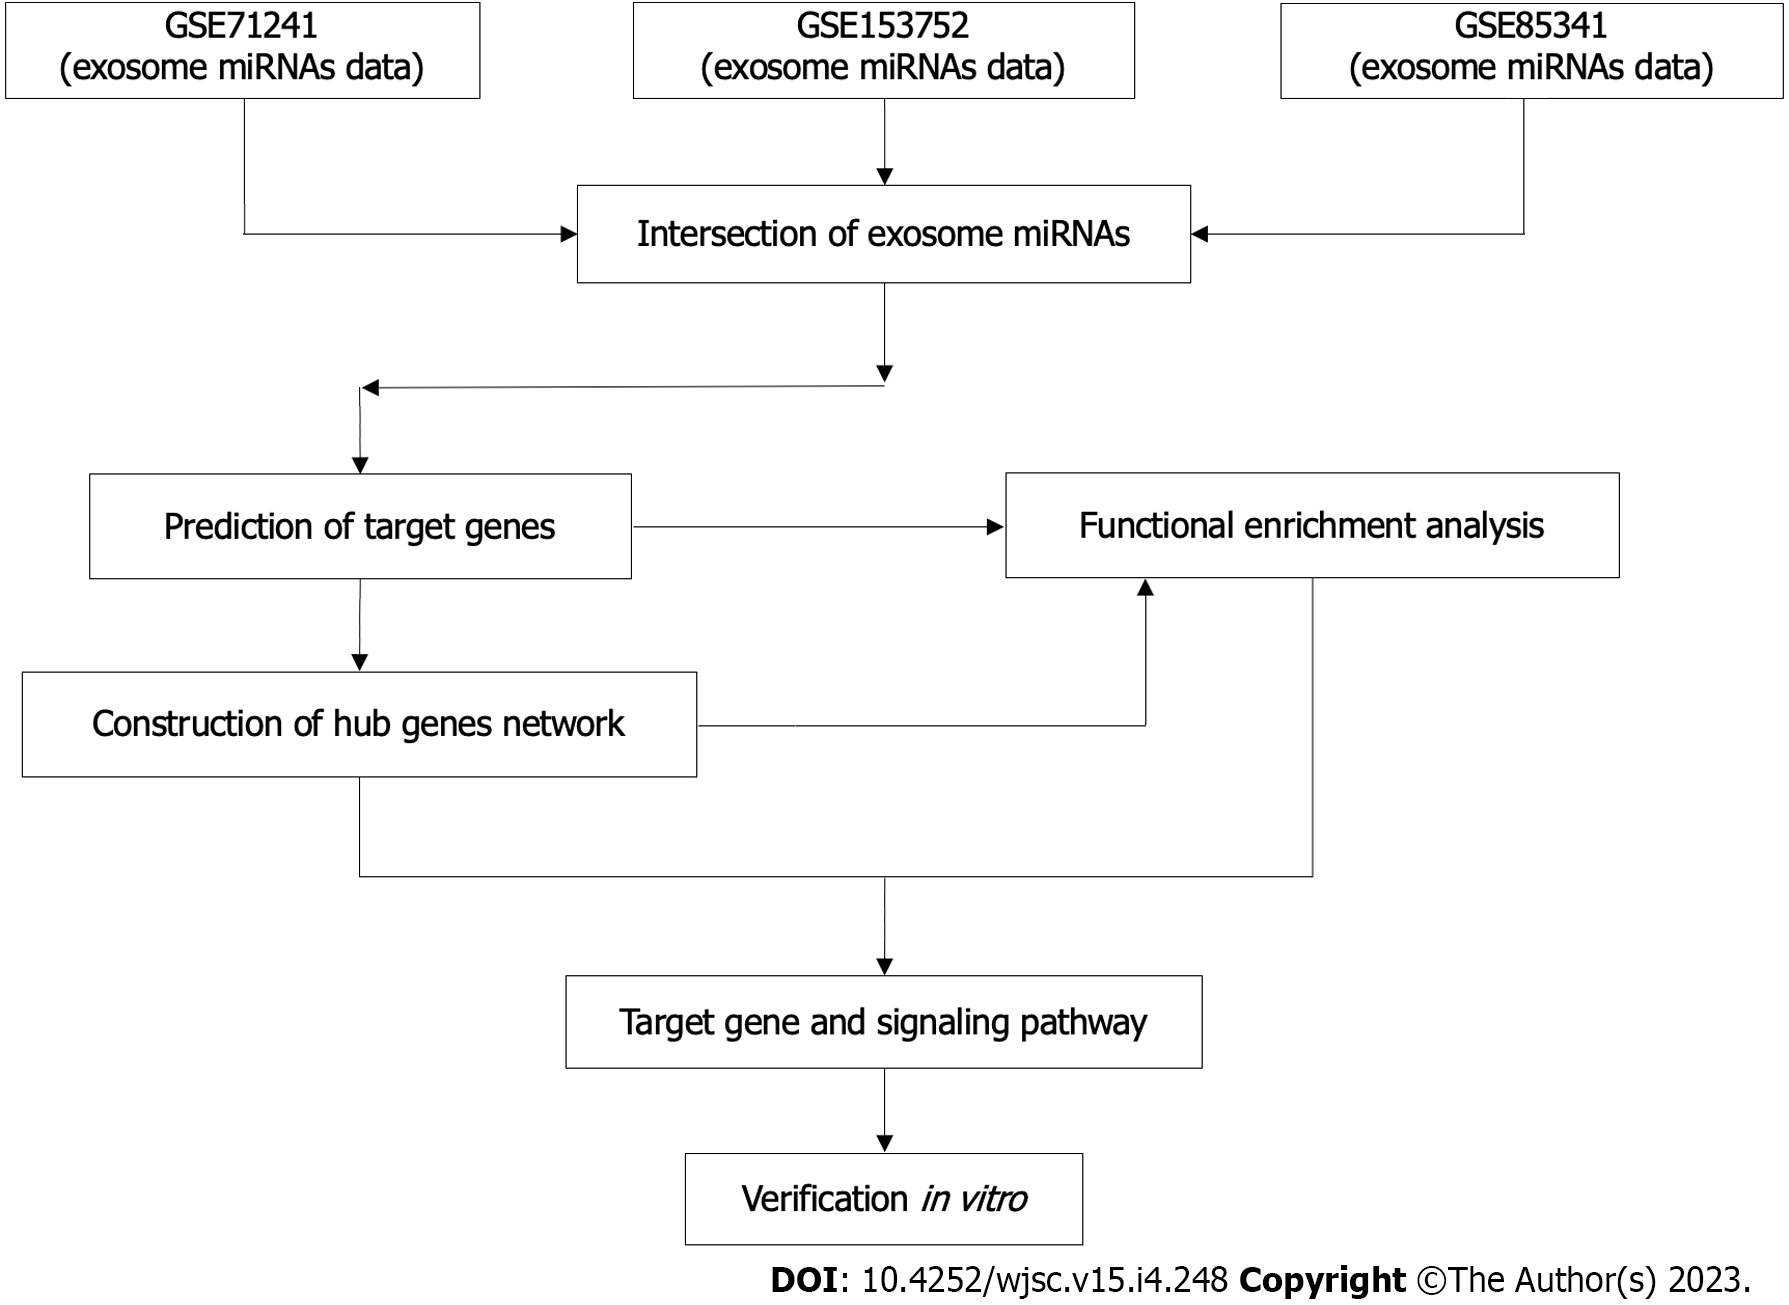
Figure 1 The flowchart of this study.
miRNAs: MicroRNAs.
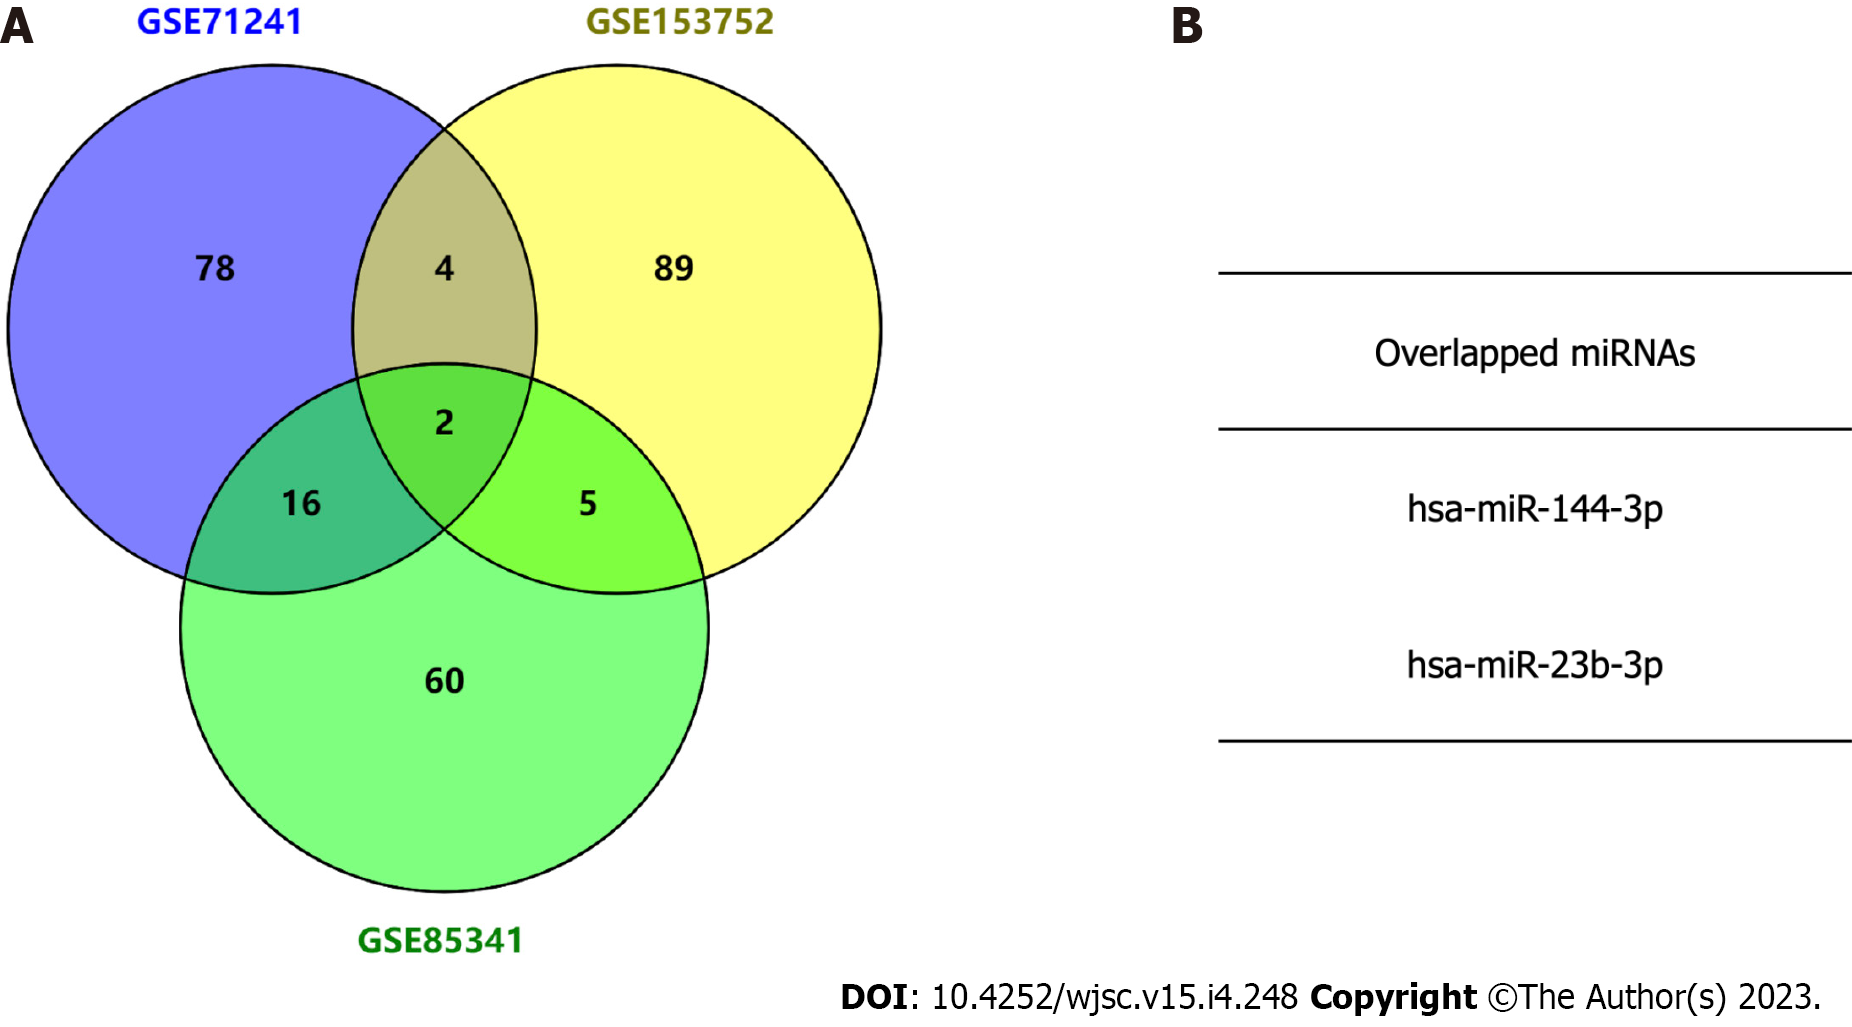
Figure 2 Identification of candidate microRNAs by intersecting three exosome microRNA expression microarray datasets.
A: Venn diagram analysis showing the top 100 exosome microRNAs (miRNAs) in the three Gene Expression Omnibus (GEO) datasets; B: Identification of two miRNAs overlapping between the three GEO datasets. miRNAs: MicroRNAs.
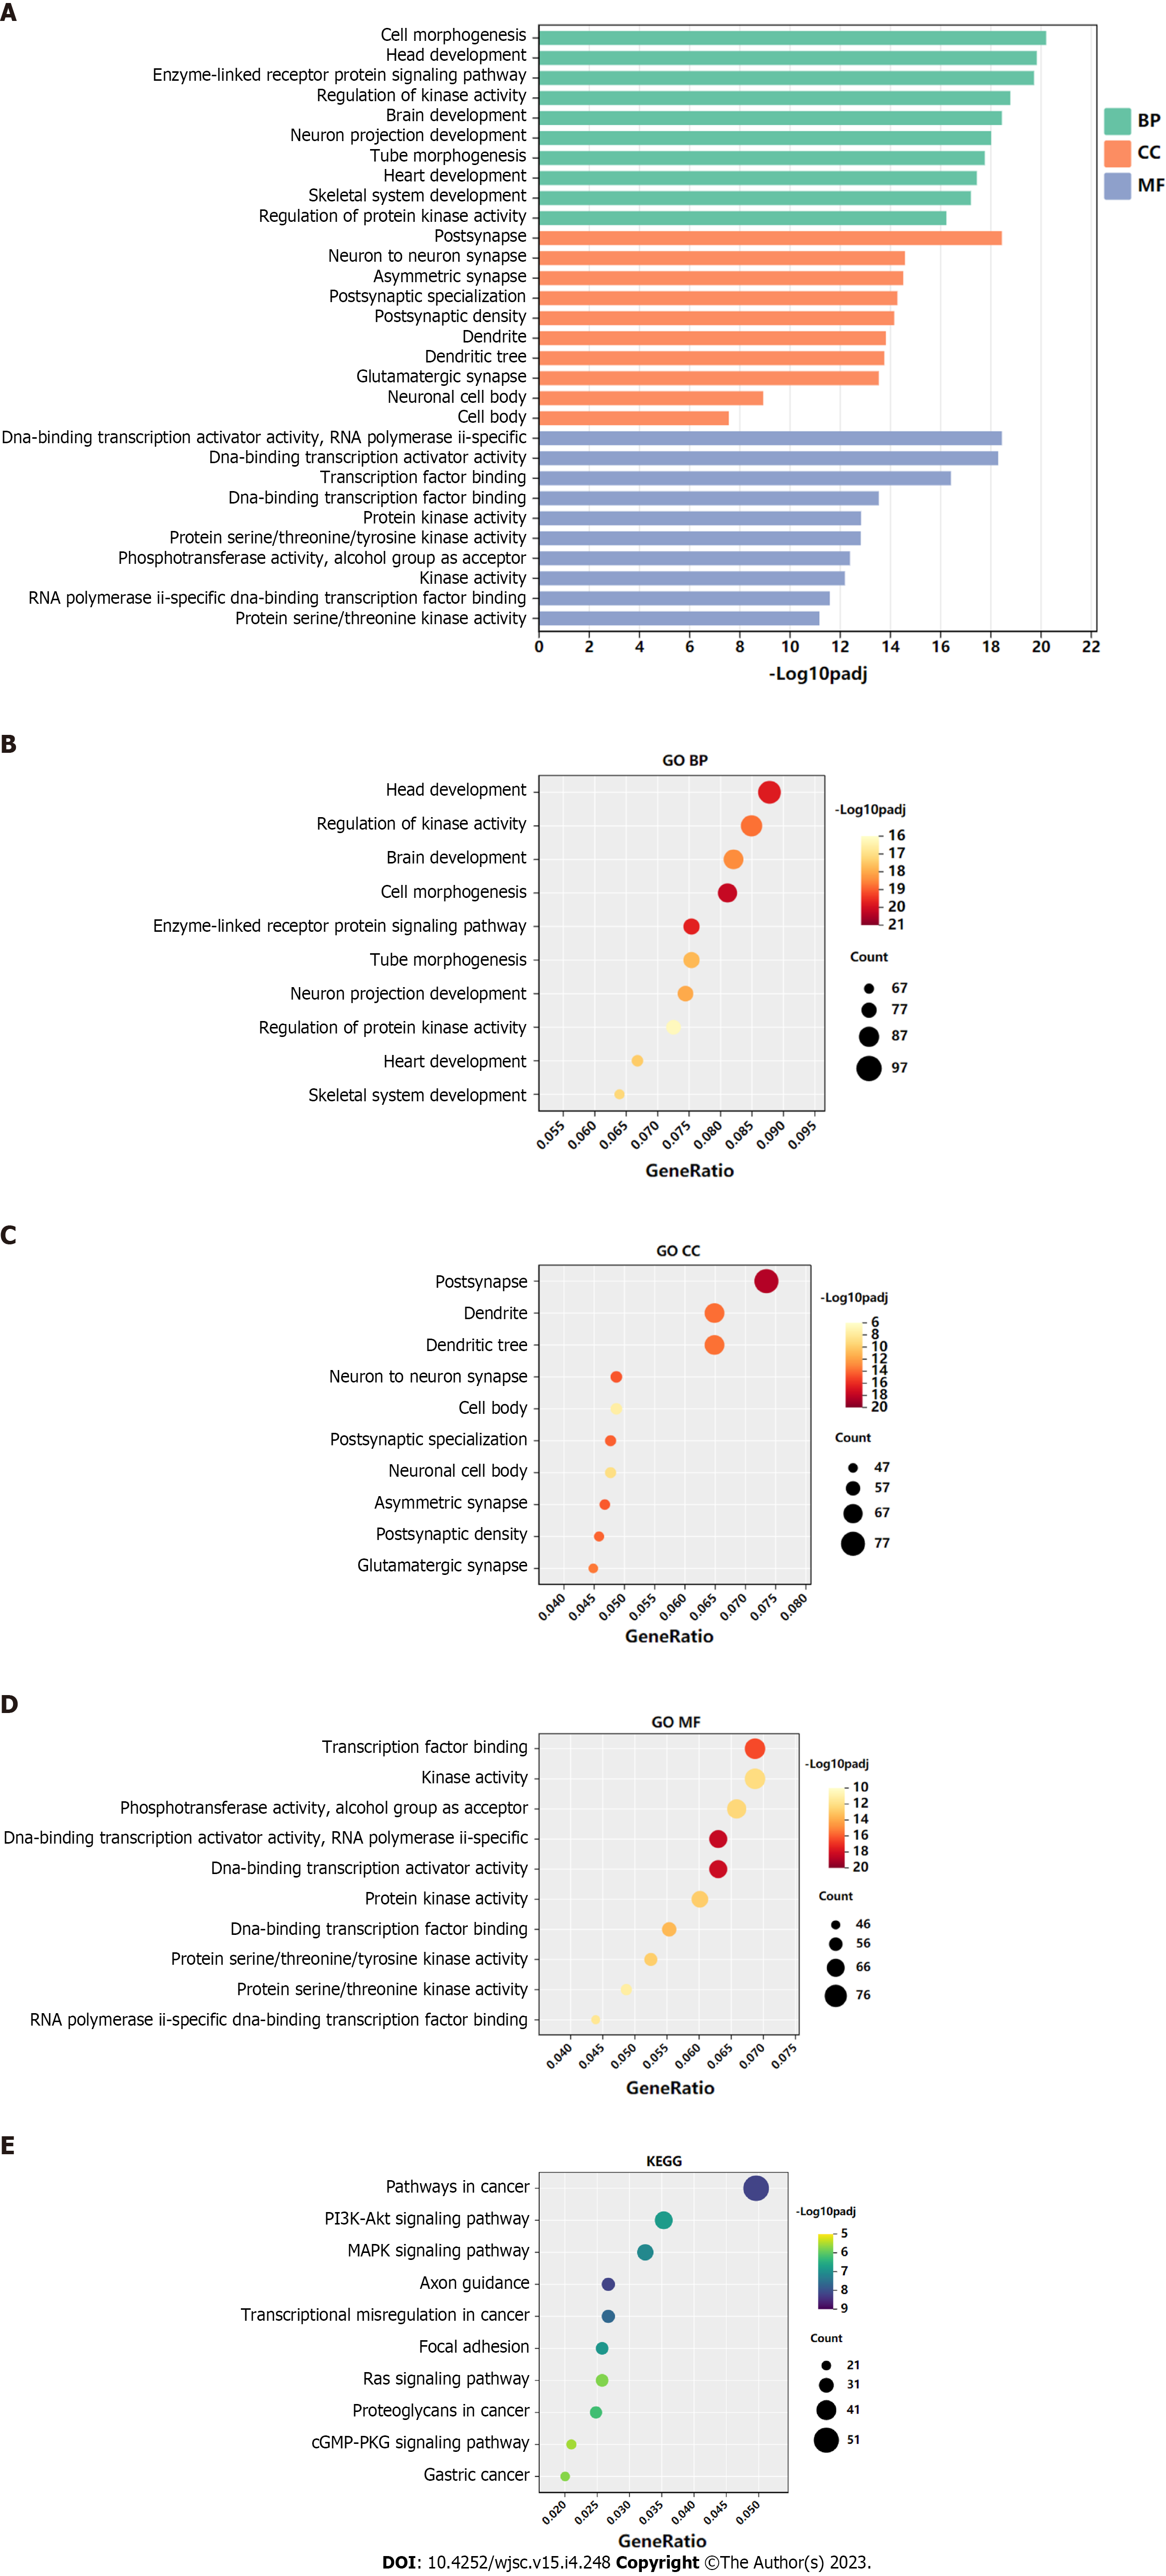
Figure 3 Gene Ontology and Kyoto Encyclopedia of Genes and Genomes analysis of genes targeted by hsa-miR-144-3p.
A-D: Top 10 Gene Ontology biological process, cellular component, and molecular function terms enriched in target genes of hsa-miR-144-3p; E: Top 10 Kyoto Encyclopedia of Genes and Genomes pathways enriched in target genes of hsa-miR-144-3p. BP: Biological process; CC: Cellular component; MF: Molecular function; GO: Gene Ontology; KEEG: Kyoto Encyclopedia of Genes and Genomes.
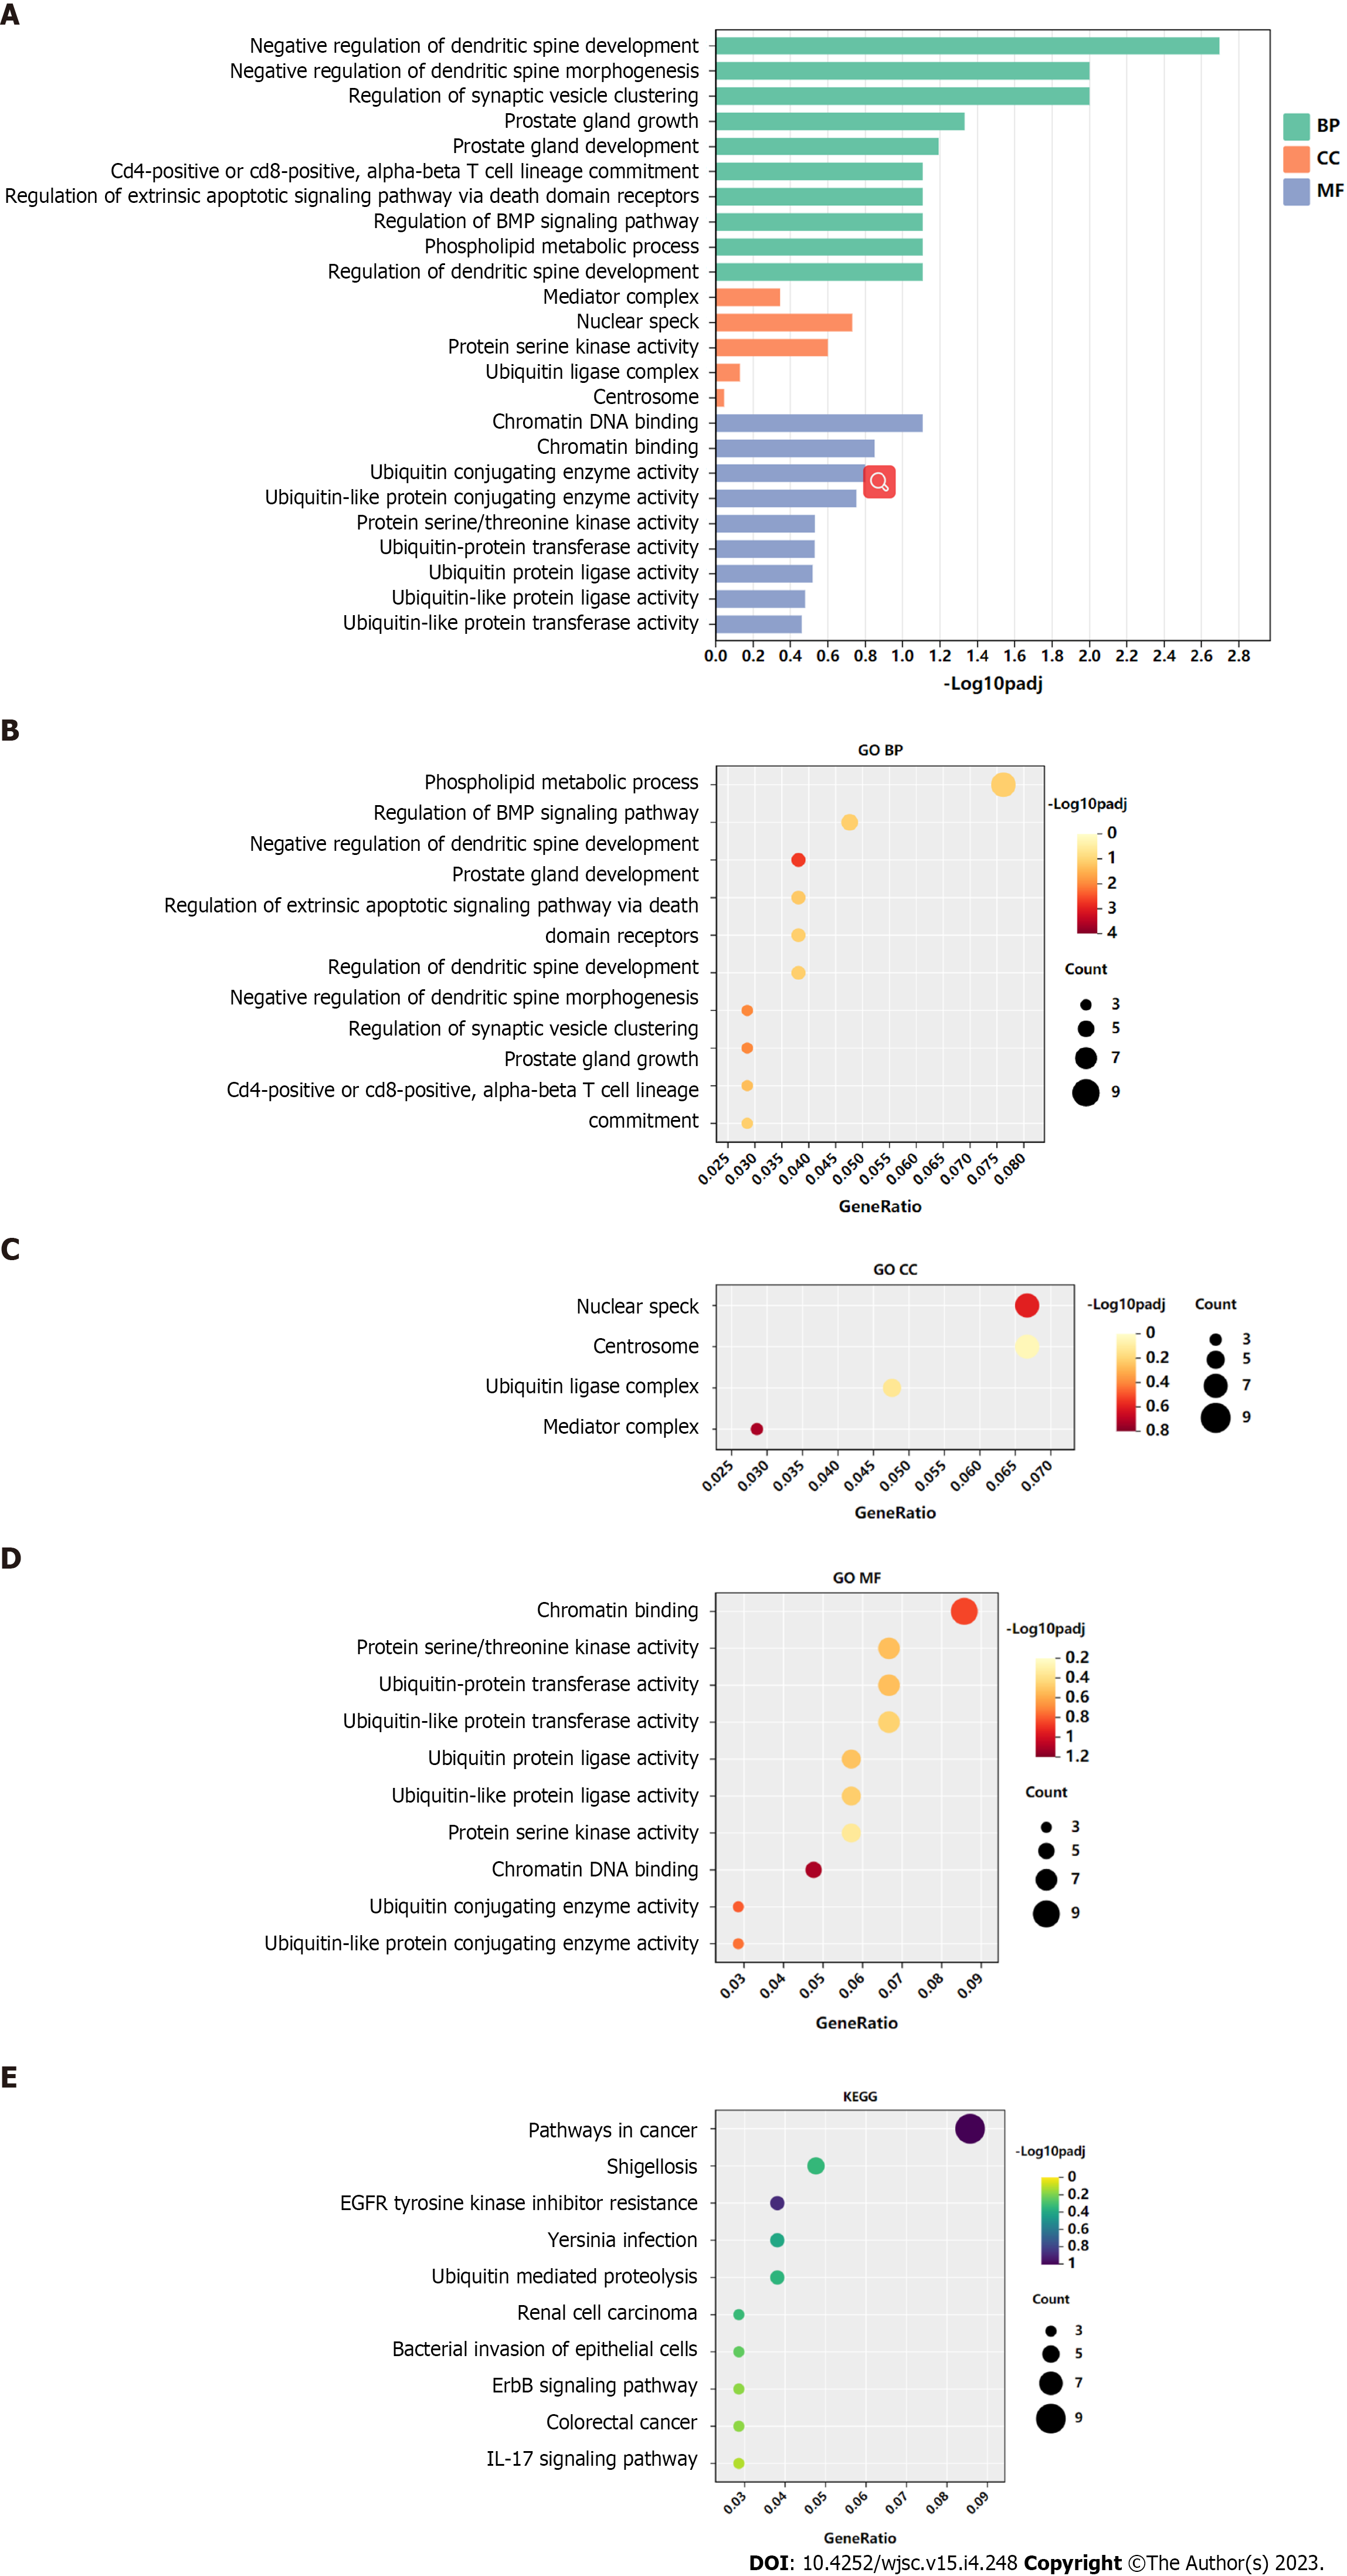
Figure 4 Gene Ontology and Kyoto Encyclopedia of Genes and Genomes analysis of genes targeted by hsa-miR-23b-3p.
A-D: Top 10 Gene Ontology biological process, cellular component, and molecular function terms enriched in target genes of hsa-miR-23b-3p; E: Top 10 Kyoto Encyclopedia of Genes and Genomes pathways enriched in target genes of hsa-miR-23b-3p. BP: Biological process; CC: Cellular component; MF: Molecular function; GO: Gene Ontology; KEEG: Kyoto Encyclopedia of Genes and Genomes.
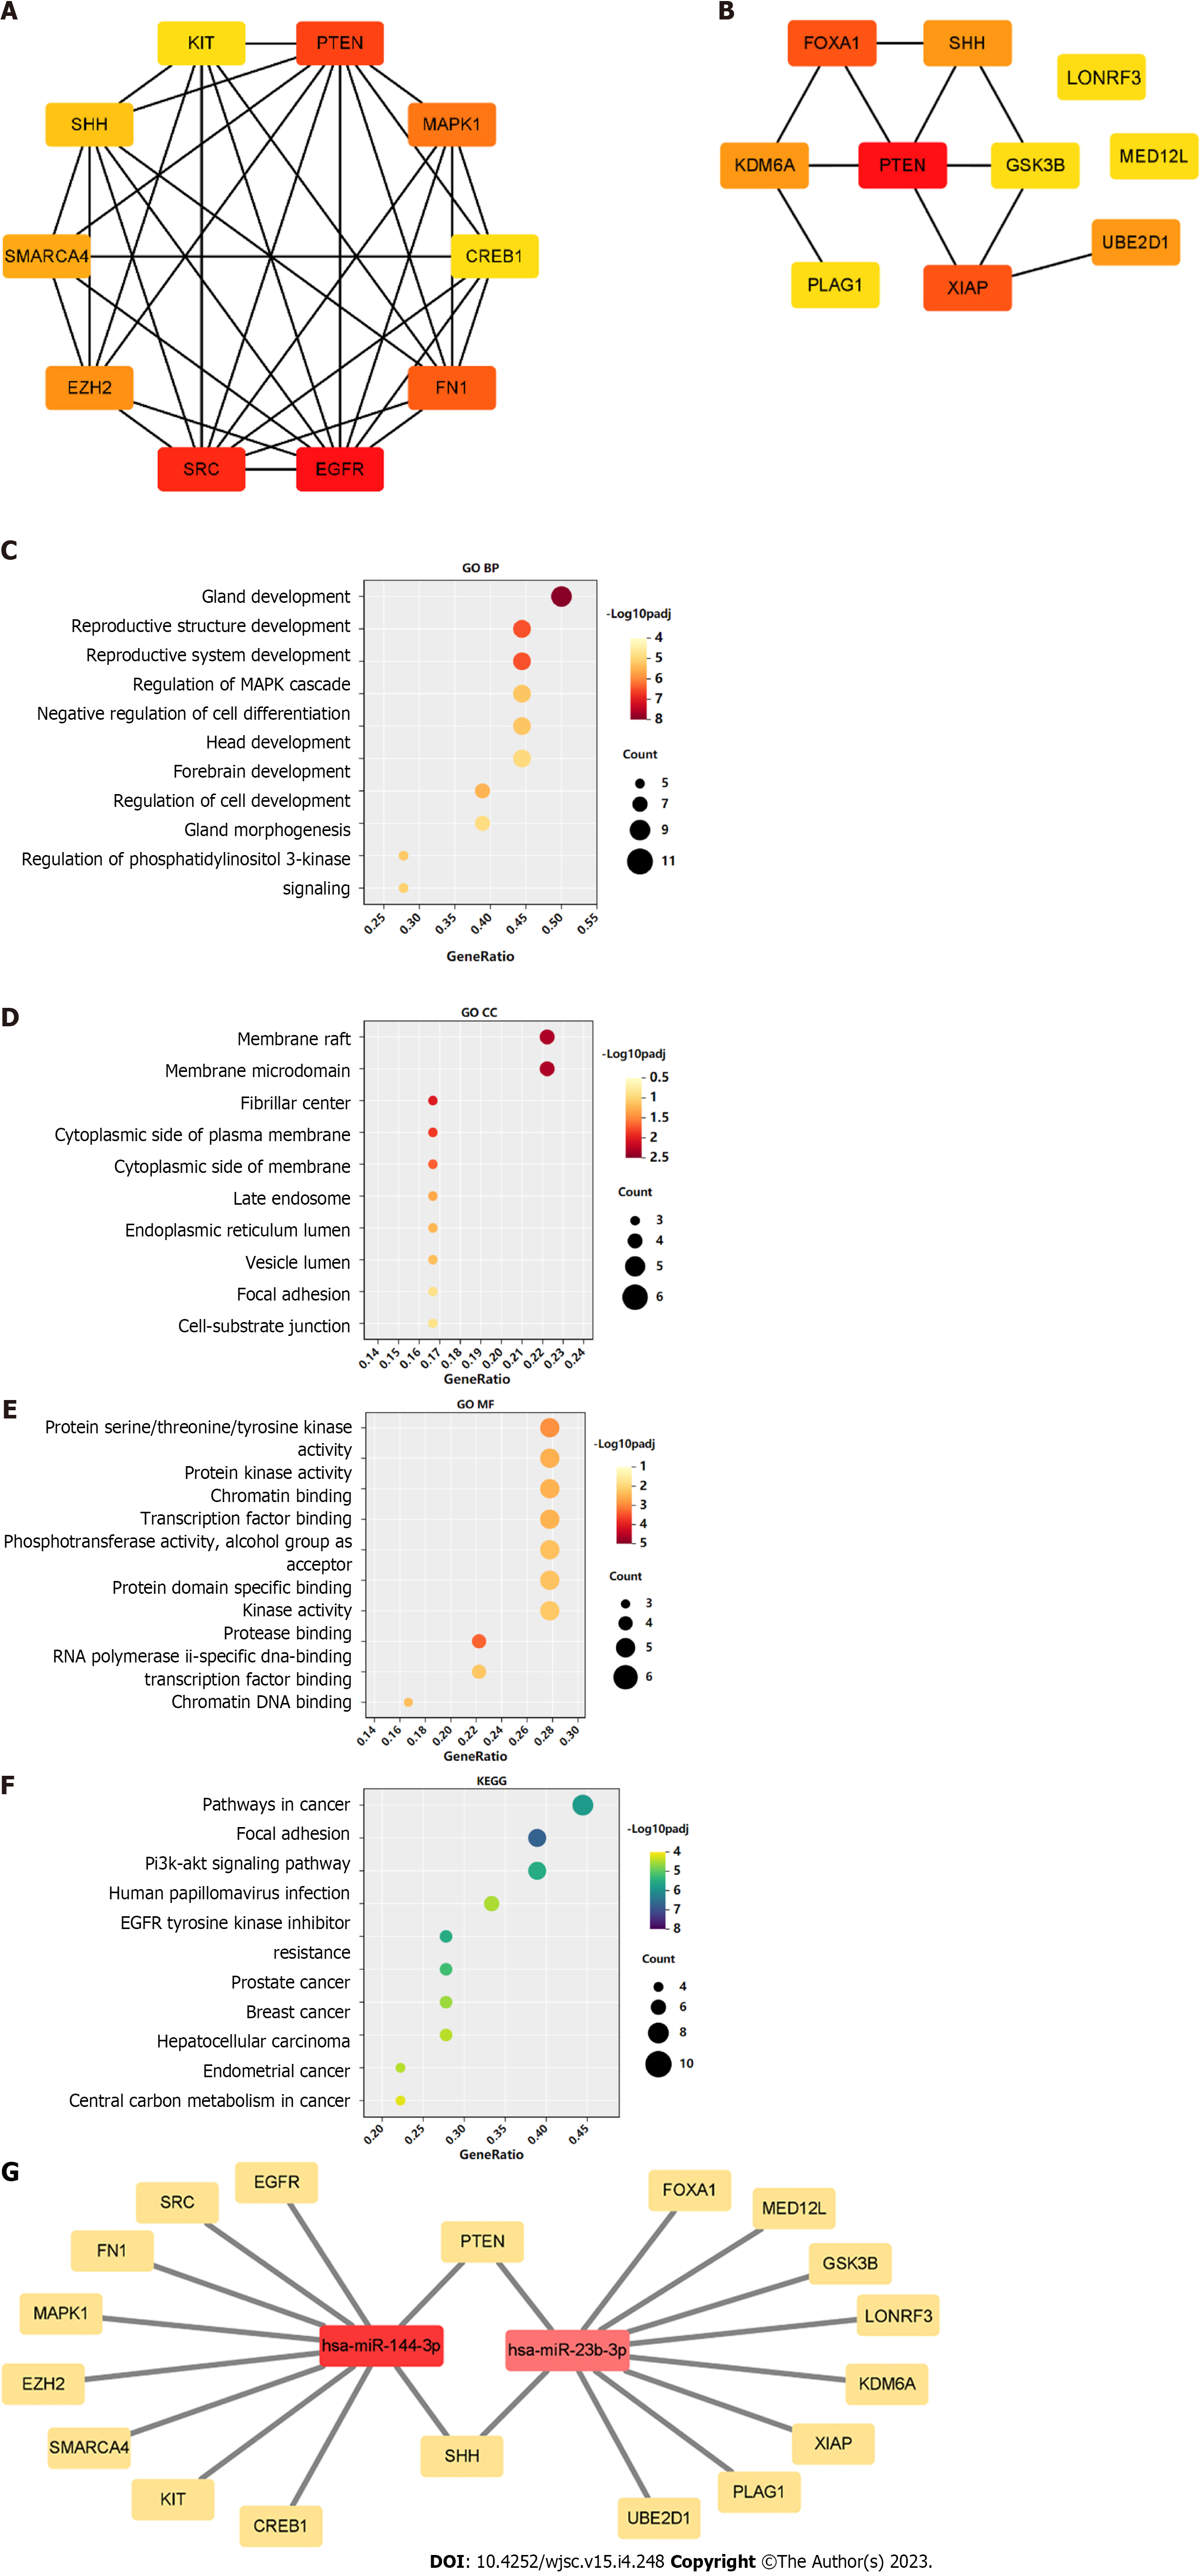
Figure 5 Gene Ontology and Kyoto Encyclopedia of Genes and Genomes analysis of hub-gene targets.
A: Top 10 hub-gene targets for hsa-miR-144-3p; B: Top 10 hub-gene targets for hsa-miR-23b-3p; C-E: Top 10 Gene Ontology biological process, cellular component, and molecular function terms enriched in the top 20 hub-gene targets; F: Top 10 Kyoto Encyclopedia of Genes and Genomes pathways enriched in the 20 hub-gene targets; G: Interaction network of the two microRNAs and their hub-gene targets.
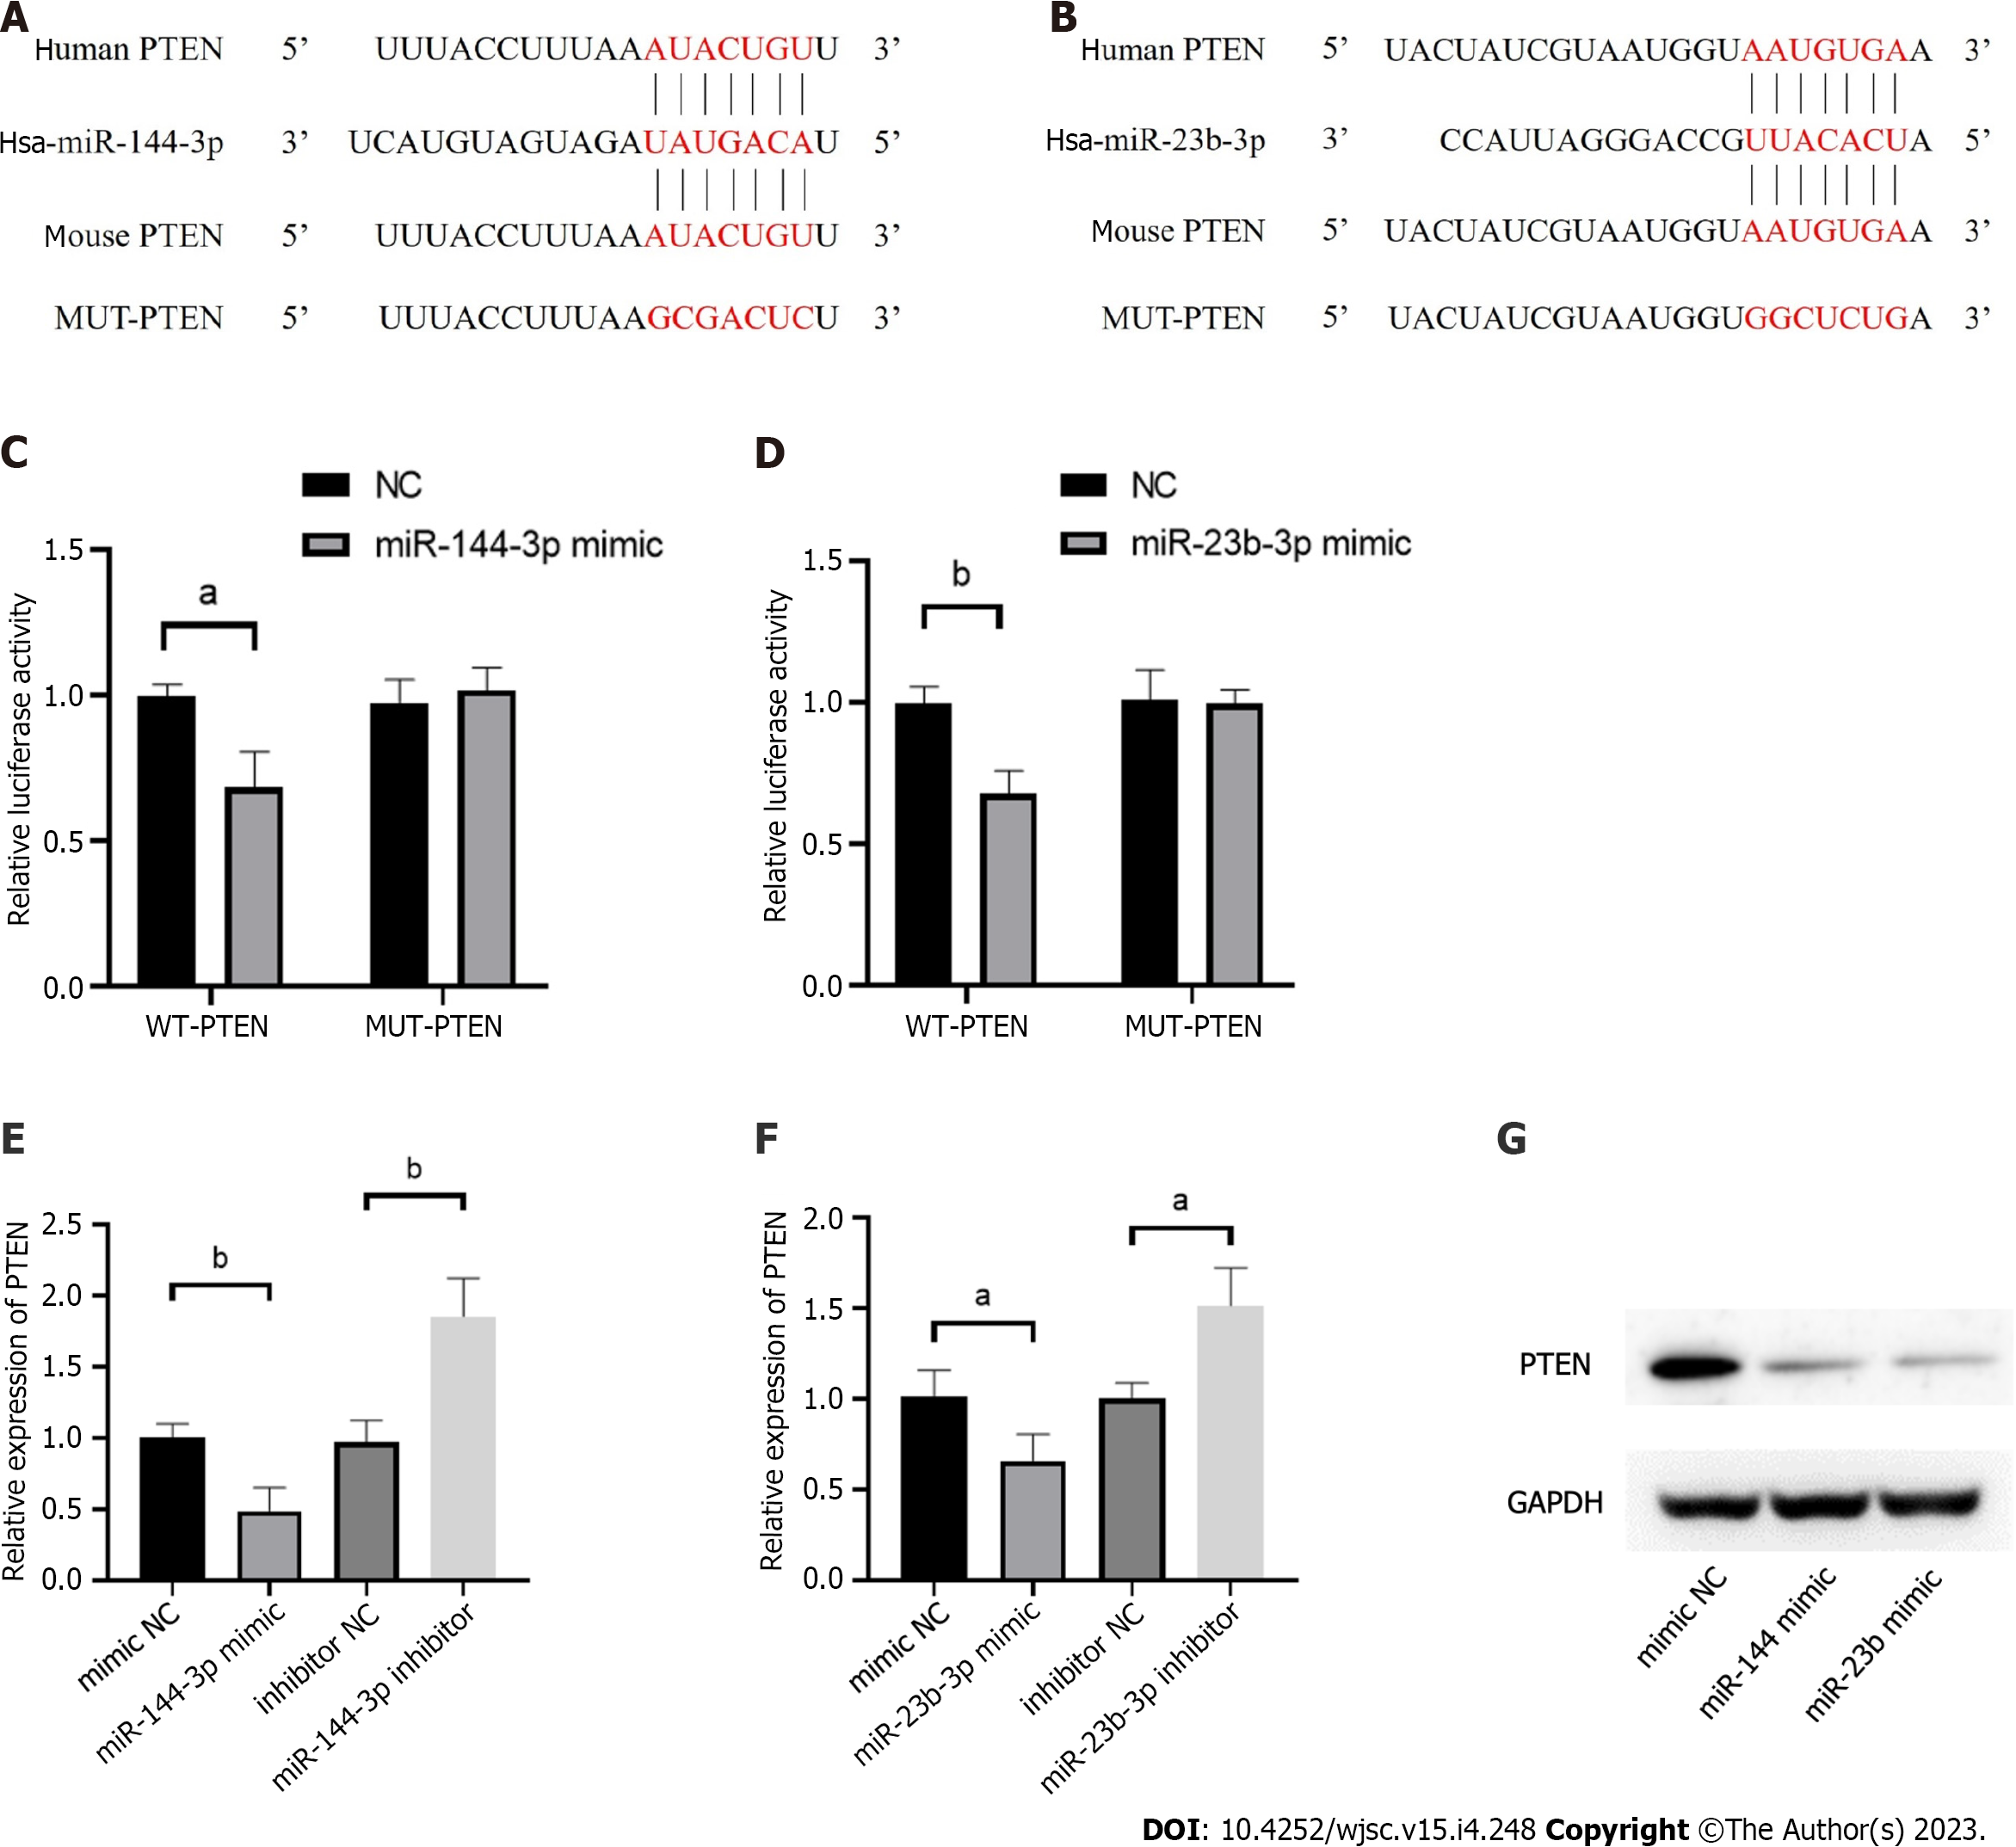
Figure 6 Phosphatase and tensin homolog is verified as the targets of miR-144-3p and miR-23b-3p.
A: Human and mouse sequence of phosphatase and tensin homolog (PTEN) for miR-144-3p binding site; B: Human and mouse sequence of PTEN for miR-23b-3p binding site; C: The relative luciferase activity was tested after co-transfection of WT/MUT pmirGLO-PTEN-3’UTR and miR-144-3p mimics or their control groups in NIH3T3 cells; D: The relative luciferase activity was tested after co-transfection of WT/MUT pmirGLO-PTEN-3’UTR and miR-23b-3p mimics or their control groups in NIH3T3 cells; E: The mRNA levels of PTEN in NIH3T3 cells transfected with miR-144-3p mimics or miR-144-3p inhibitors; F: The mRNA levels of PTEN in NIH3T3 cells transfected with miR-23b-3p mimics or miR-23b-3p inhibitors; G: Western blot showing the PTEN expression levels after transfected with miR-144-3p mimics and miR-23b-3p mimics. n = 3 per groups. Data are shown as mean ± SD. aP < 0.05, bP < 0.01.
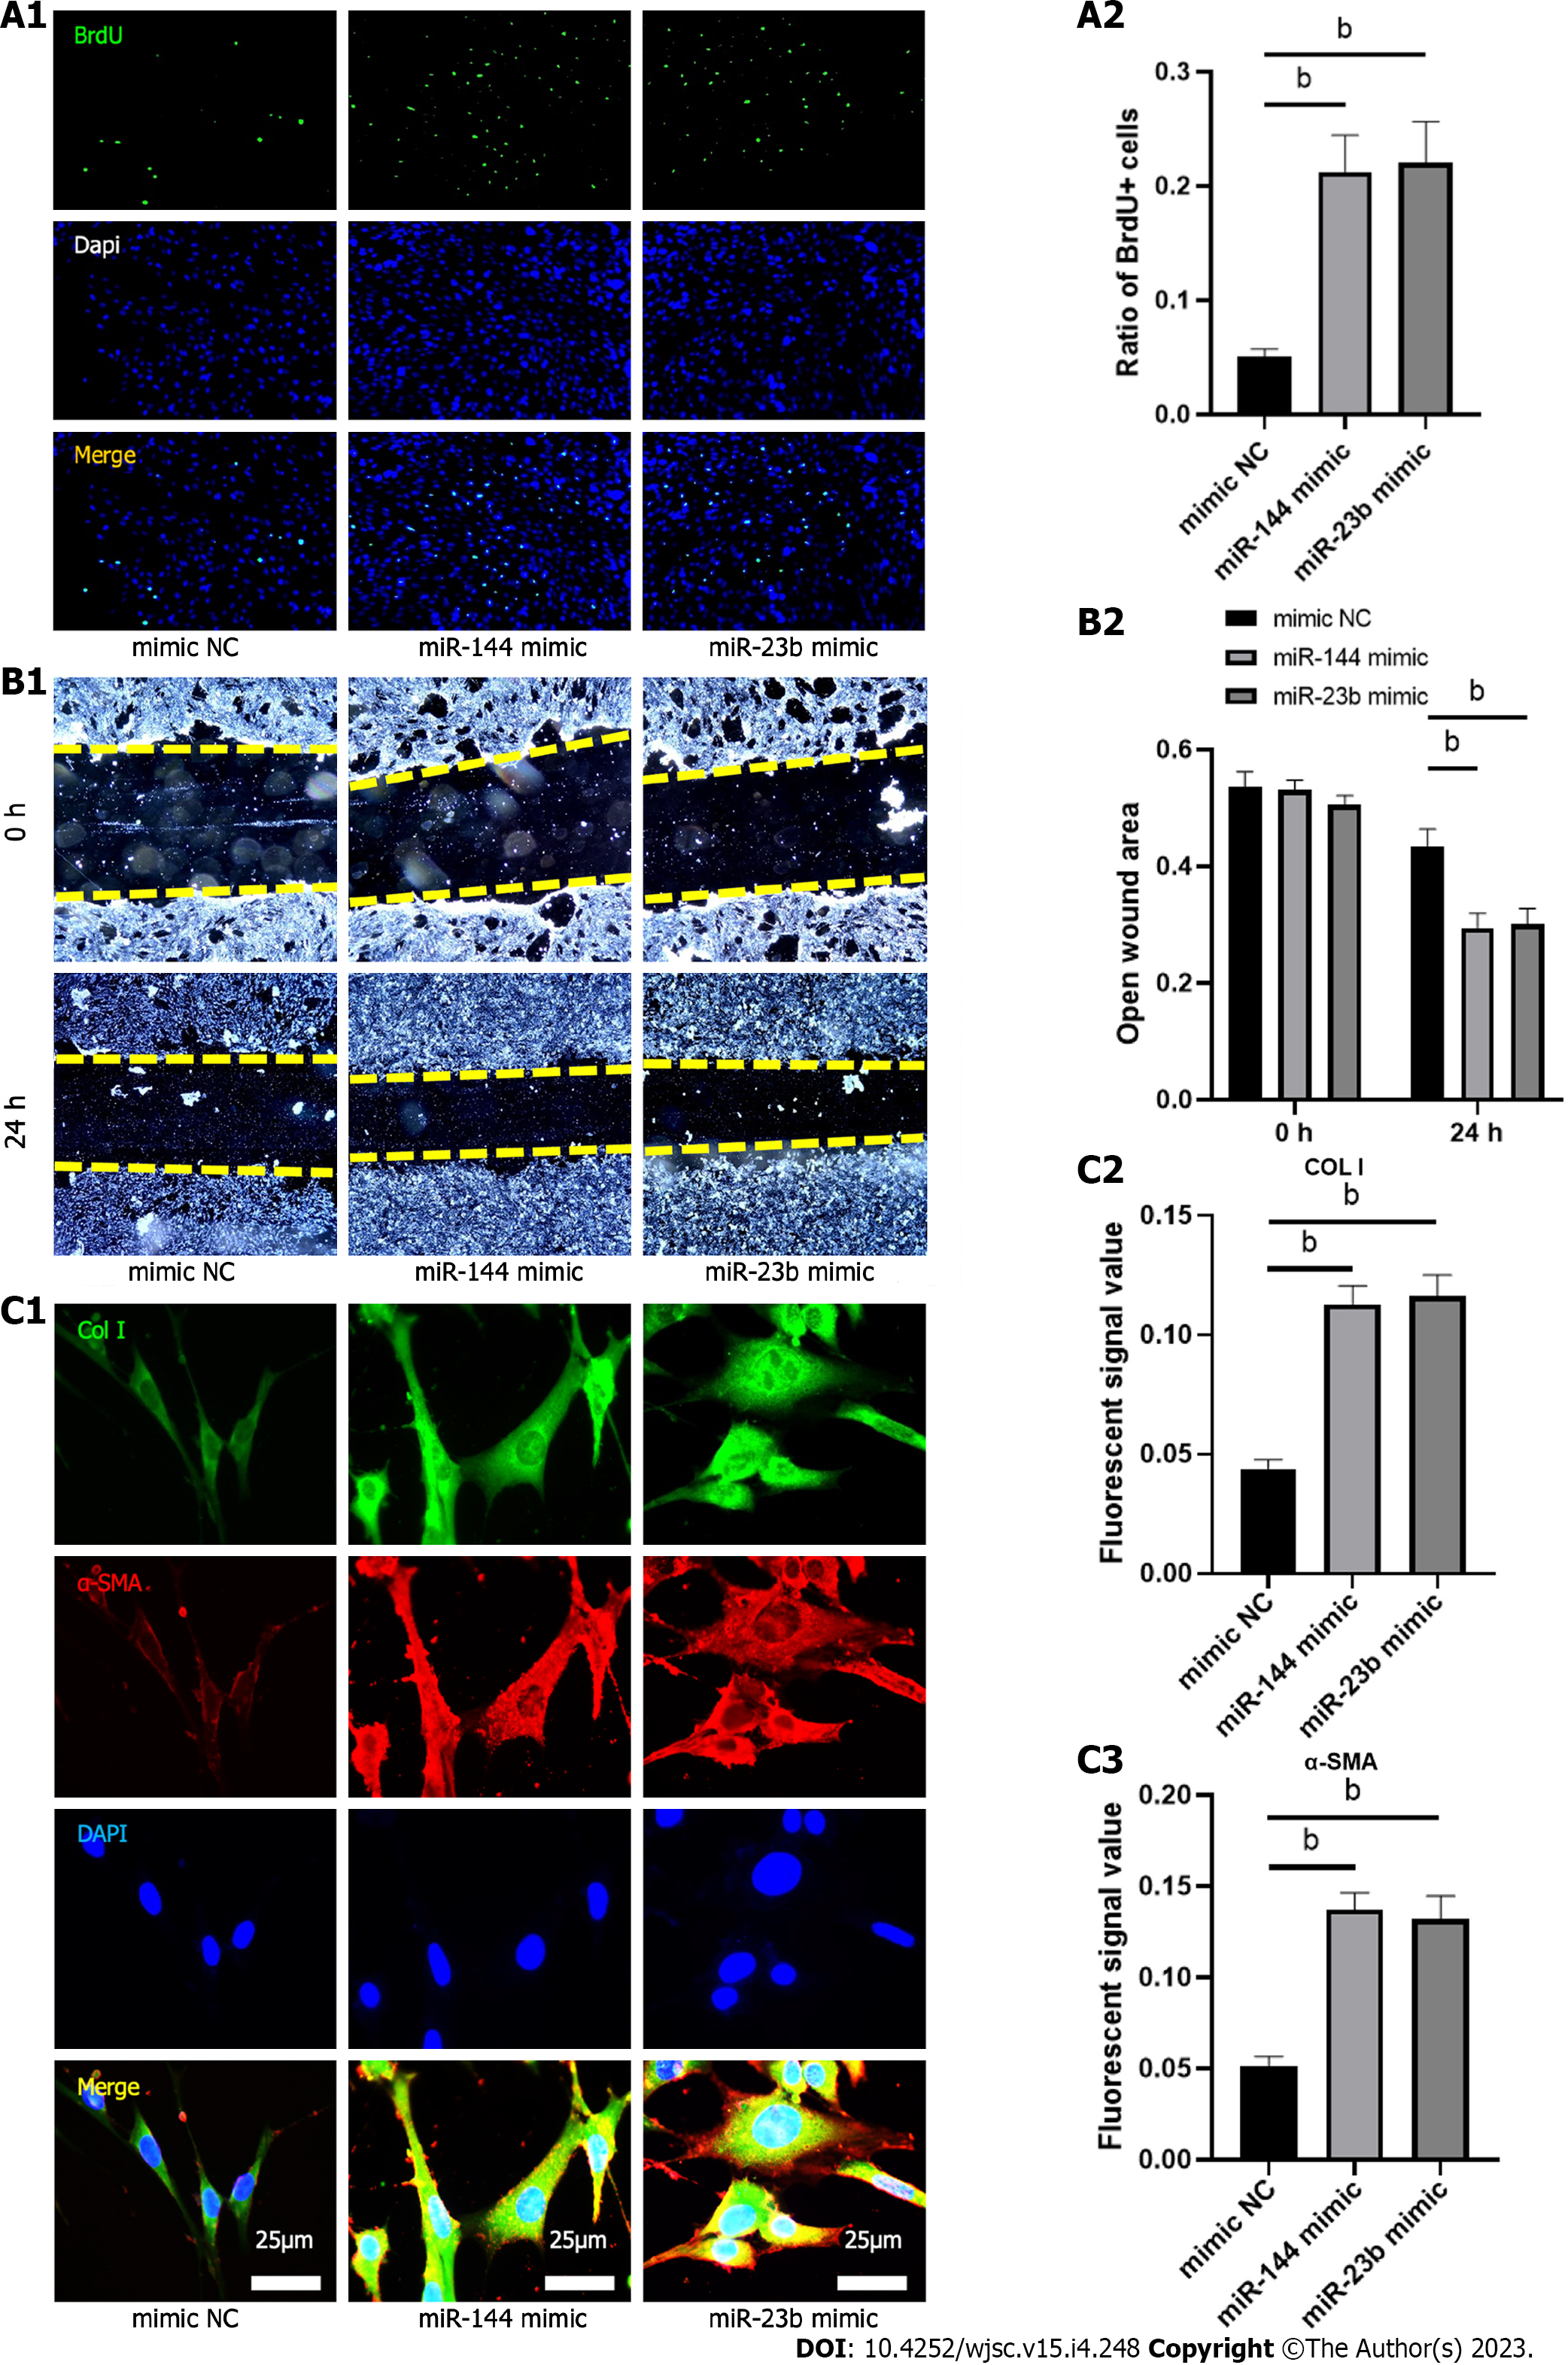
Figure 7 MiR-144-3p and miR-23b-3p regulate the proliferation, migration and collagen synthesis of NIH3T3 fibroblasts.
A: Bromodeoxyuridine assay was performed to measure the proliferation ability; B: Wound healing assay was performed to measure the migratory capability; C: Immunofluorescence was performed to determine the effects of miR-144-3p and miR-23b-3p on COL I and α-smooth muscle actin expression. n = 3 per groups. Data are shown as mean ± SD. aP < 0.05, bP < 0.01. α-SMA: α-smooth muscle actin.
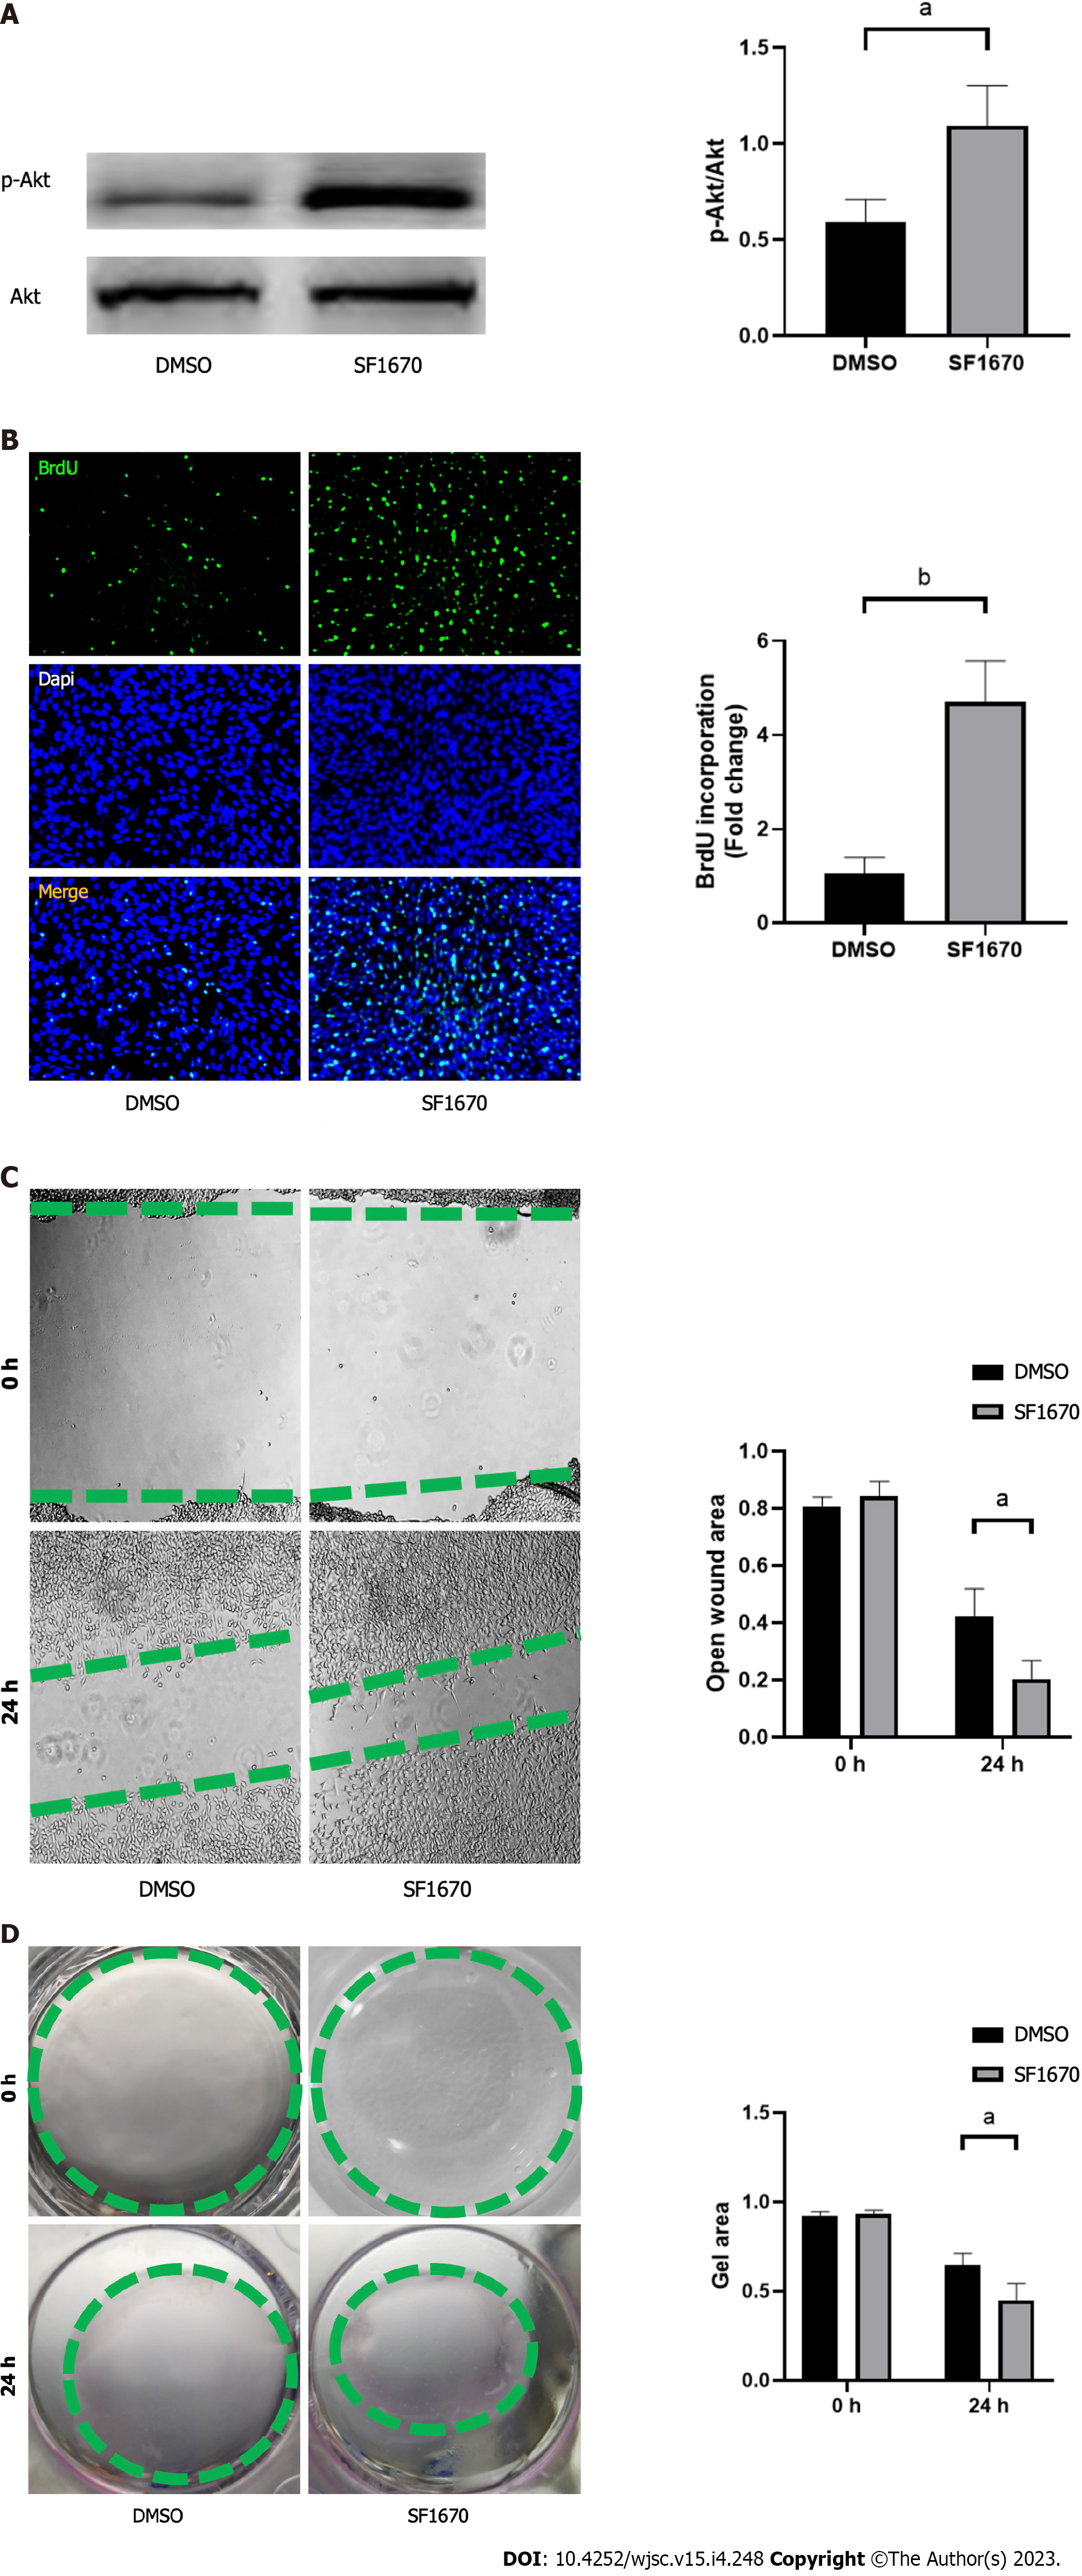
Figure 8 Inhibition of phosphatase and tensin homolog promoted cell proliferation, migration, and collagen synthesis.
A: The protein levels of p-Akt and Akt in NIH3T3 cells were determined by western blot; B: Bromodeoxyuridine assay was performed to measure the proliferation ability; C: Wound healing assay was performed to measure the migratory capability; D: Collagen contraction assay was performed to evaluate the cell contractility. n = 3 per groups. Data are shown as mean ± SD. aP < 0.05, bP < 0.01.
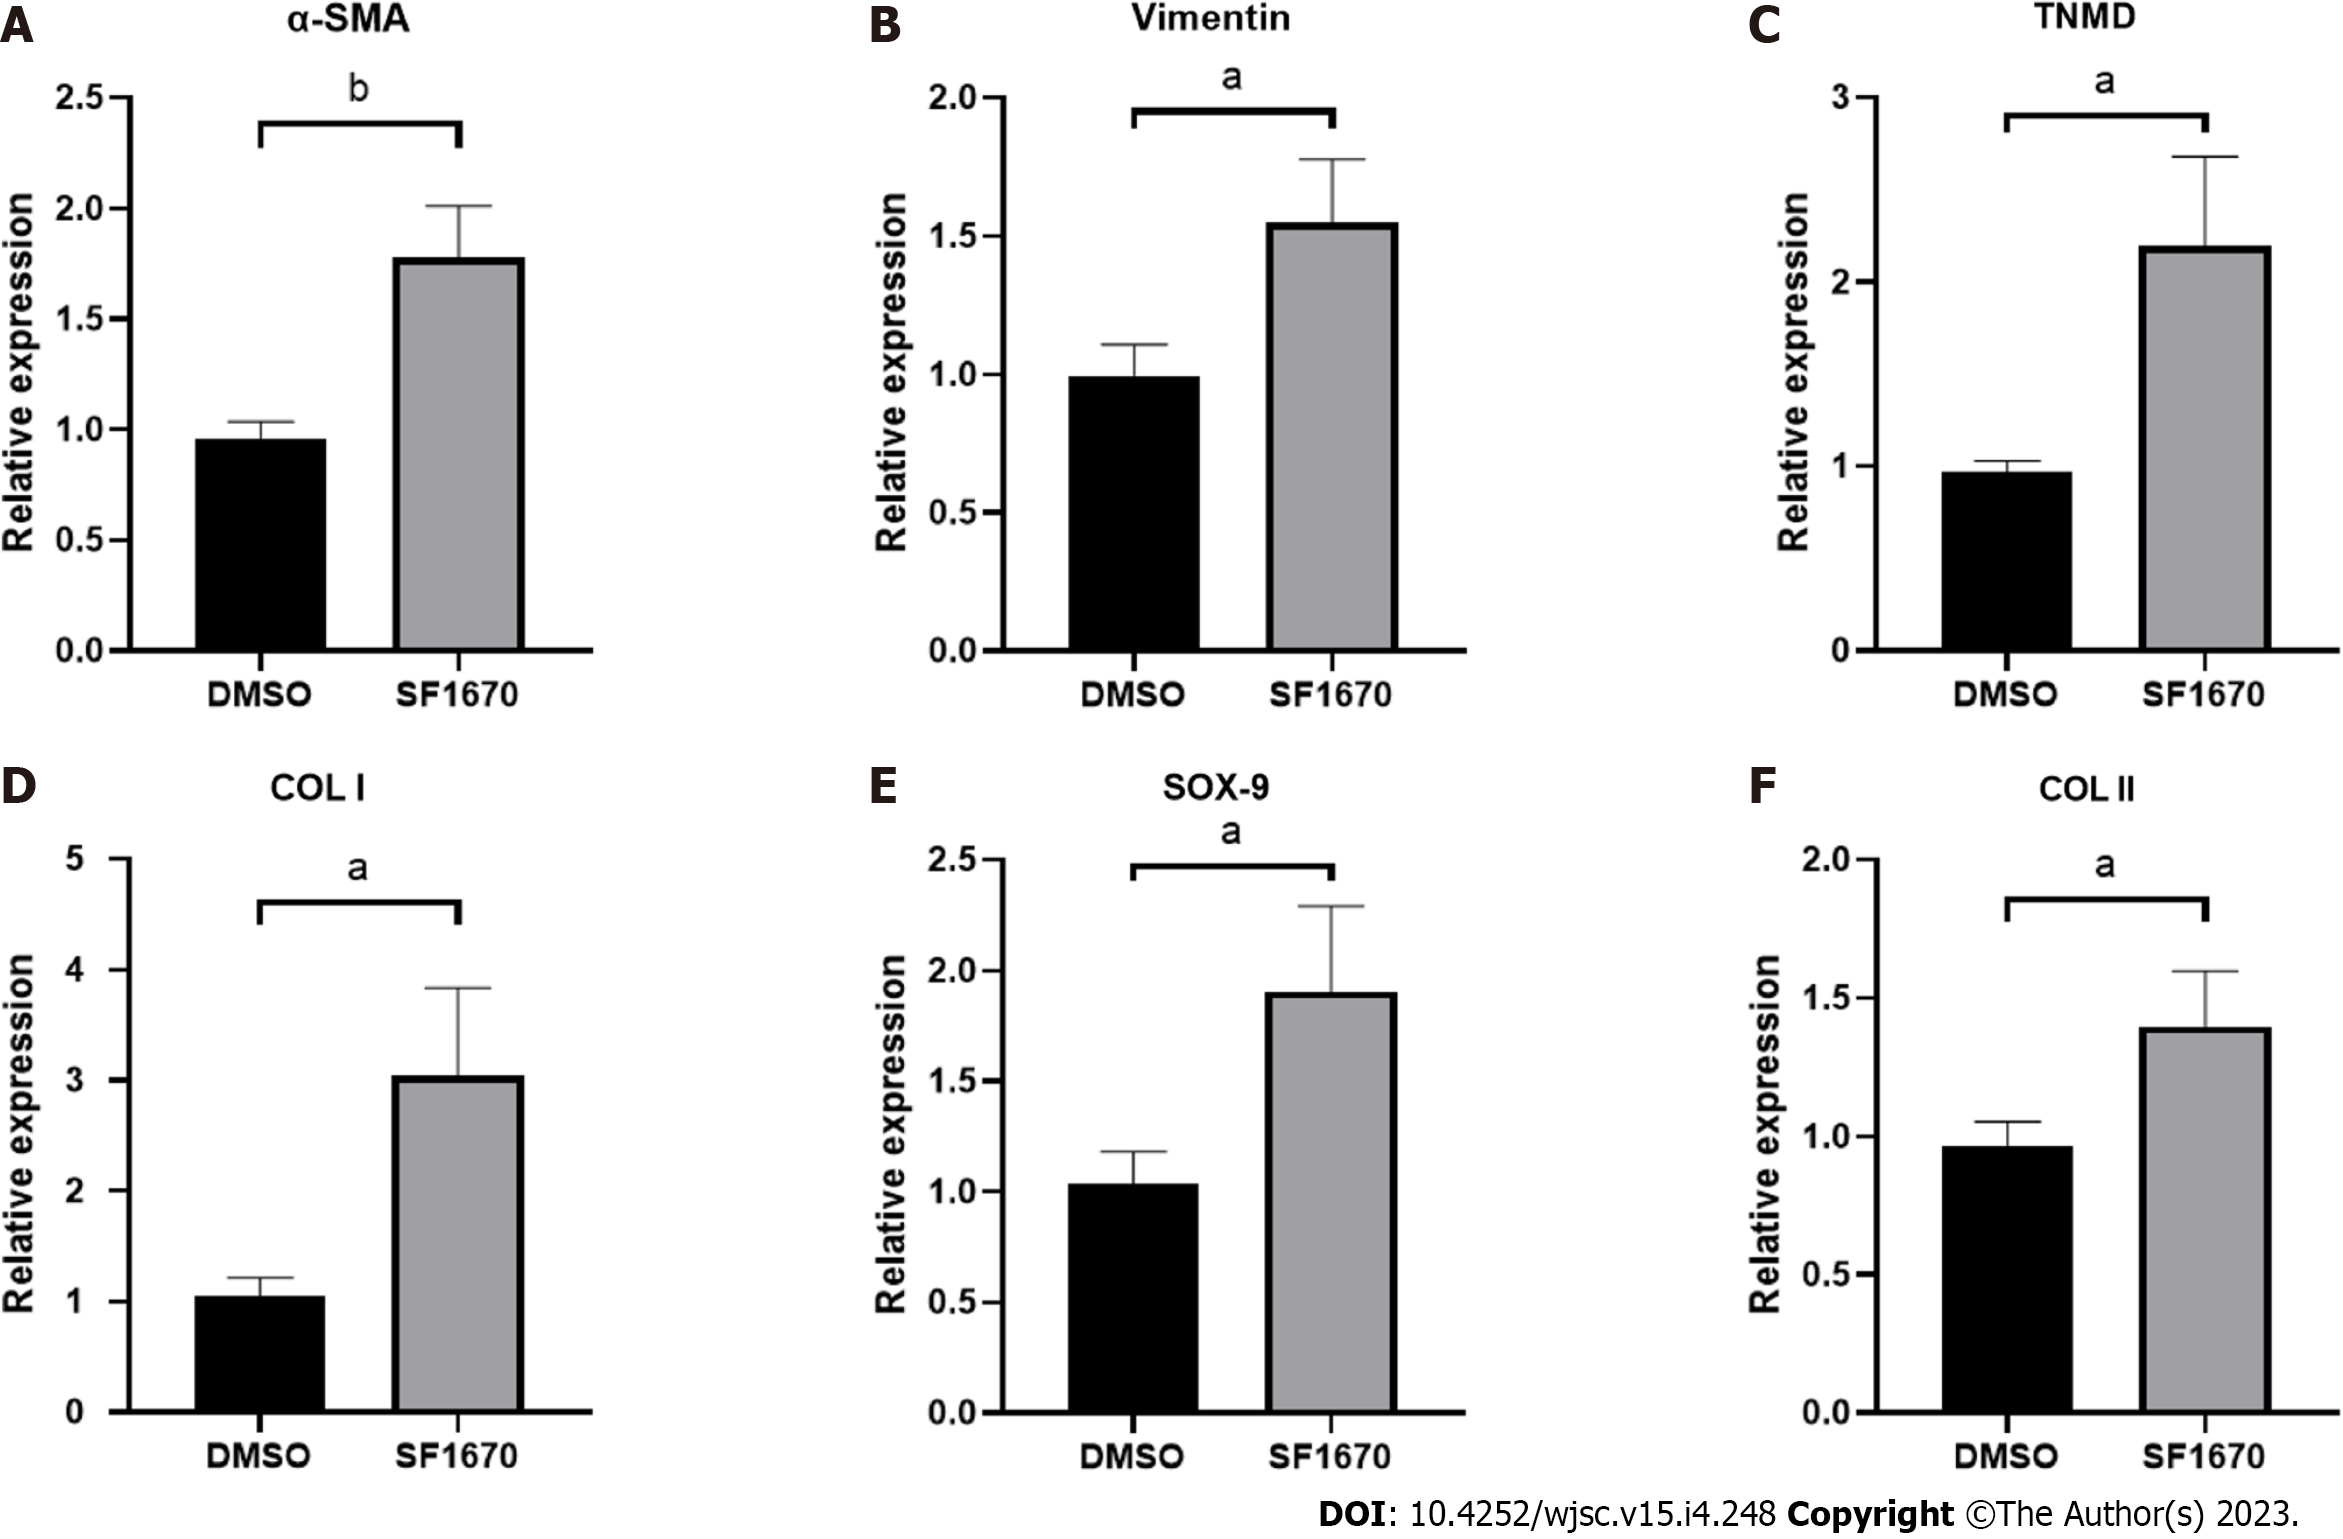
Figure 9 Inhibition of phosphatase and tensin homolog change the gene expression of fibroblastic-, tenogenic-, and chondrogenic-related factors in NIH3T3 cells.
The mRNA level of α-smooth muscle actin, vimentin, TNMD, Col I, Sox-9, and Col II in NIH3T3 cells treated with or without SF1670 was determined by quantitative real-time reverse transcription polymerase chain reaction. Data are shown as mean ± SD. aP < 0.05, bP < 0.01. α-SMA: α-smooth muscle actin.
- Citation: Li FQ, Chen WB, Luo ZW, Chen YS, Sun YY, Su XP, Sun JM, Chen SY. Bone marrow mesenchymal stem cell-derived exosomal microRNAs target PI3K/Akt signaling pathway to promote the activation of fibroblasts. World J Stem Cells 2023; 15(4): 248-267
- URL: https://www.wjgnet.com/1948-0210/full/v15/i4/248.htm
- DOI: https://dx.doi.org/10.4252/wjsc.v15.i4.248


