Copyright
©The Author(s) 2022.
World J Stem Cells. Dec 26, 2022; 14(12): 822-838
Published online Dec 26, 2022. doi: 10.4252/wjsc.v14.i12.822
Published online Dec 26, 2022. doi: 10.4252/wjsc.v14.i12.822
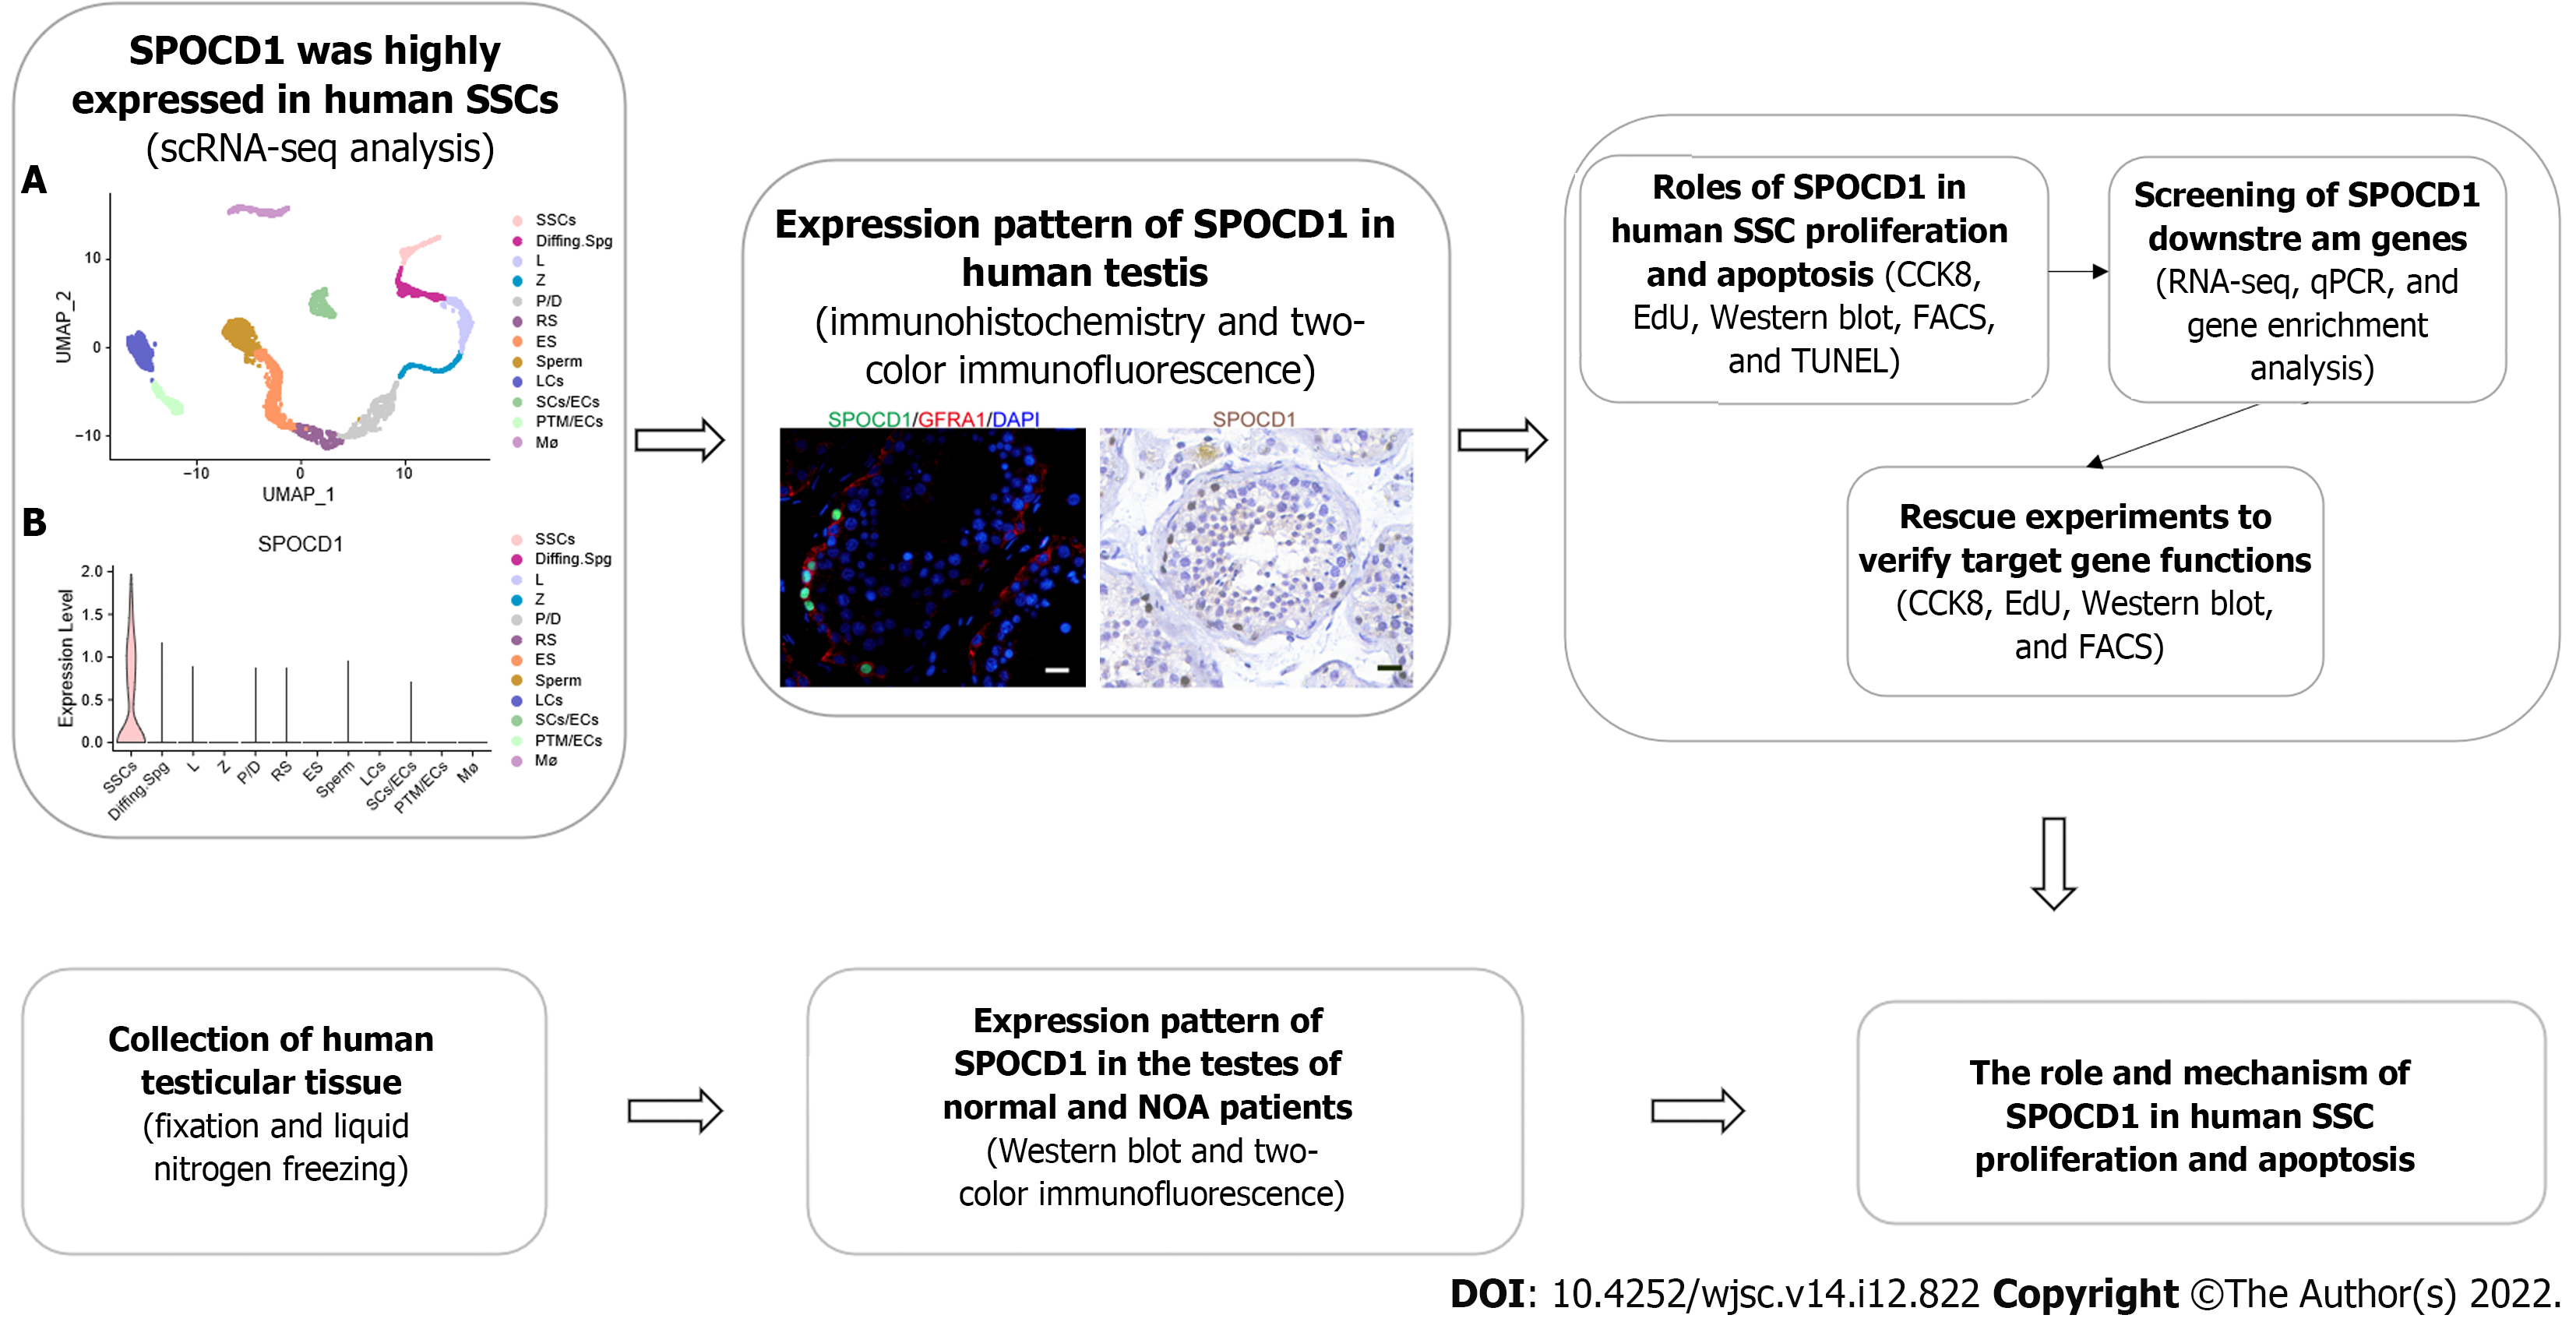
Figure 1 Flow chart of this study’s design.
NOA: Non-obstructive azoospermia; scRNA-seq: Single-cell RNA sequencing; SPOCD1: SPOC domain-containing protein 1; SSCs: Spermatogonial stem cells.
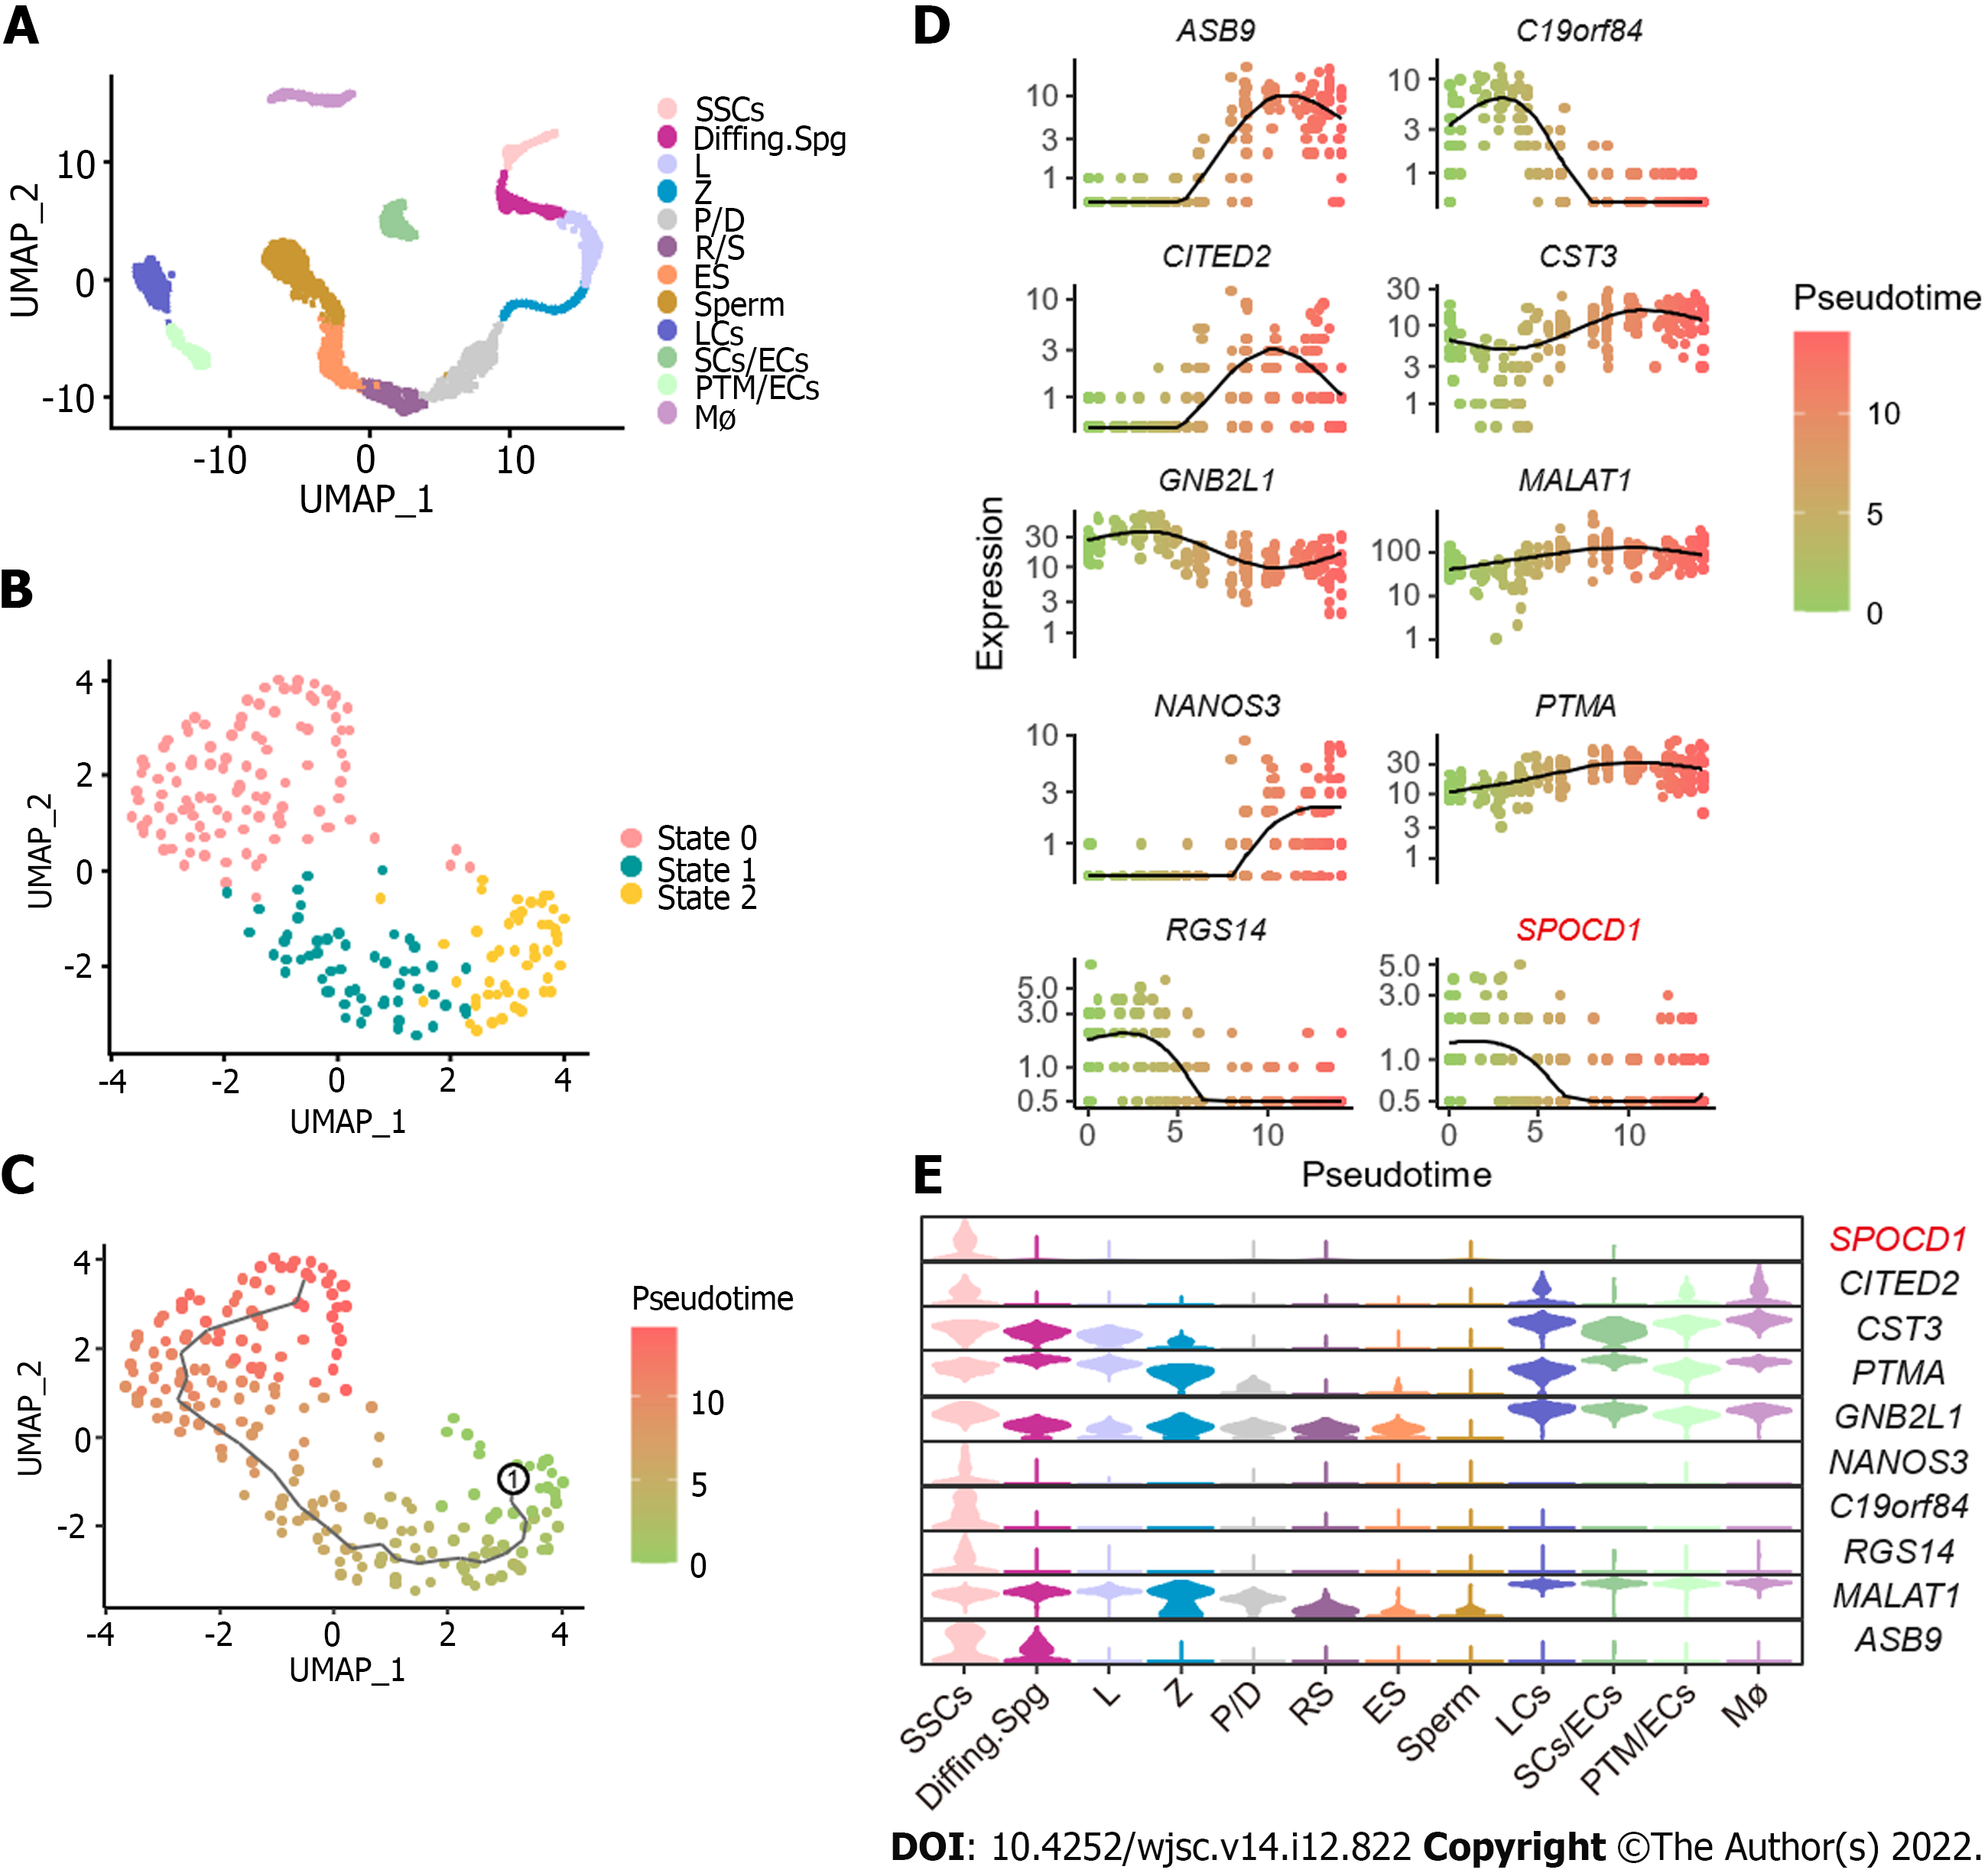
Figure 2 Integrated analysis of human testes single-cell sequencing datasets (GSE149512 and GSE112013).
A: Uniform manifold approximation and projection (UMAP) and clustering analyses of combined single-cell transcriptomic data from human testes; B: UMAP and re-clustering analysis of spermatogonial stem cell (SSC) clusters, each dot represents a single cell and is colored according to legends; C: Pseudo-time analysis of SSC cluster showing three discrete cellular states (states 0, 1, and 2) during SSC development, the black curve is the developmental trajectory created by the Monocle 3 package, and character 1 represents the starting point of the developmental trajectory; D: Expression levels of the top 10 differentially expressed genes (DEGs) during SSC development. The black curve is the mean level expression along with pseudotime; E: Violin plots show the expression levels of the top 10 DEGs in all testicular cells. Diffing.Spg: Differentiating spermatogonia; ES: Elongated spermatids; L: Leptotene spermatocytes; LCs: Leydig cells; Mø: Macrophages; P/D: Pachytene/diplotene spermatocytes; PTM/ECs: Peritubular myoid cells/endothelial cells; RS: Round spermatids; SCs/ECs: Sertoli cells/endothelial cells; Z: Zygotene spermatocytes.
Figure 3 Expression pattern of SPOC domain-containing protein 1 in normal adult testis.
A: Western blotting show SPOC domain-containing protein 1 (SPOCD1) levels in three obstructive azoospermia (OA) samples with normal spermatogenesis; B: Representative hematoxylin and eosin-stained image of OA testicular tissues; C: Immunohistochemistry images for cell distribution of SPOCD1 in OA samples with normal spermatogenesis; D: Double immunostaining shows co-expression of SPOCD1 with glial cell line-derived neurotrophic factor family receptor alpha-1 (GFRA1), KIT, and proliferating cell nuclear antigen (PCNA) in testes with normal spermatogenesis; E: The abundance of SPOCD1+ cells co-expressing GFRA1, KIT, and PCNA. Each circle represents one count result, and at least 20 cross-sections of seminiferous tubules were assessed for each sample. Scale bars in B and D: 50 μm.
Figure 4 Influence of SPOC domain-containing protein 1 knockdown on the proliferation of human spermatogonial stem cells.
A: Quantitative PCR results show SPOC domain-containing protein 1 (SPOCD1) mRNA levels in a human spermatogonial stem cell line after transfection with SPOCD1-small interfering RNA (siRNA) 1-, 2-, and 3; B and C: Western blotting shows the changes of SPOCD1 protein after transfection with SPOCD1-siRNA; D: The Cell Counting Kit-8 assay shows the proliferation of human SSCs transfected with negative control (NC)-siRNA and SPOCD1-siRNA 2; E and F: Protein levels of promyelocytic leukemia zinc finger (PLZF), cyclin D1 (CCND1), proliferating cell nuclear antigen (PCNA), and Thy-1 cell surface antigen (THY1) after transfection with NC-siRNA and SPOCD1-siRNA 2; G and H: The percentage of 5-ethynyl-2’-deoxyuridine (EdU)-positive cells after transfection with NC-siRNA and SPOCD1-siRNA 2. Scale bar in G: 20 μm. aP < 0.05; bP < 0.01.
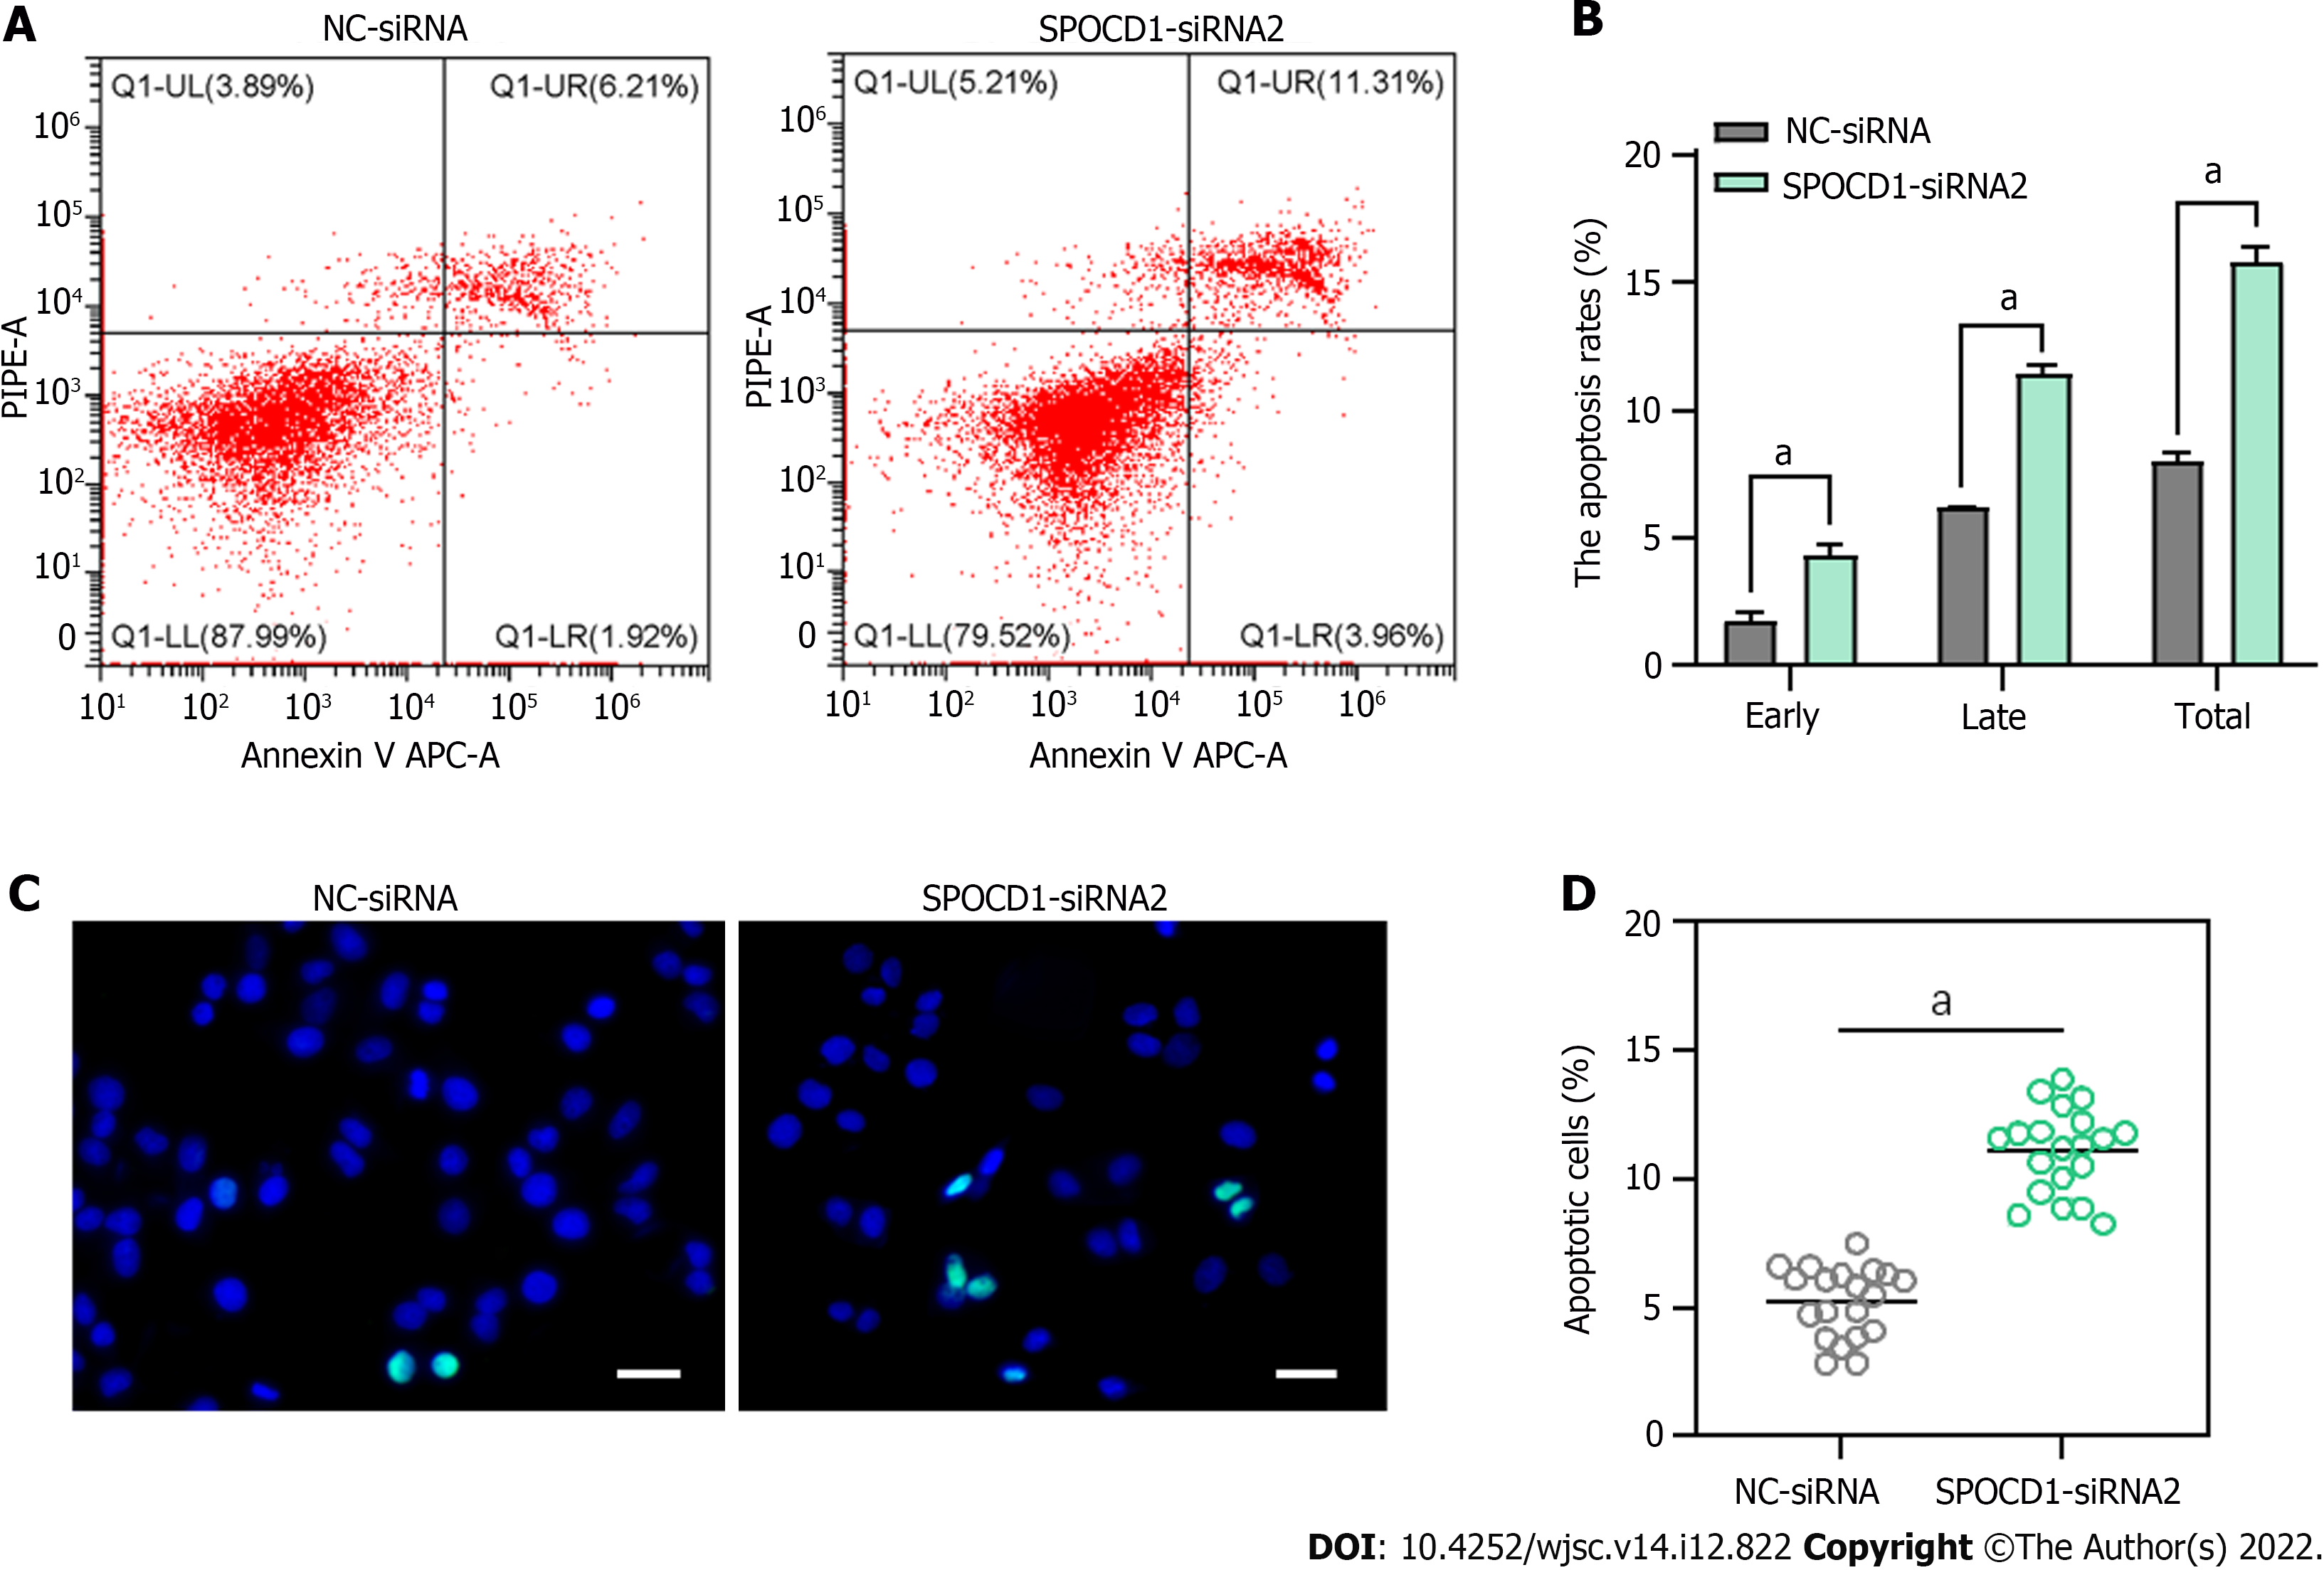
Figure 5 Effects of SPOC domain-containing protein 1 inhibition on apoptosis of human spermatogonial stem cells.
A and B: Flow cytometry and APC Annexin V analysis show proportions of early and late apoptotic cells in human spermatogonial stem cells (SSCs) transfected with negative control (NC)-small interfering RNA (siRNA) and SPOC domain-containing protein 1-siRNA 2; C and D: Terminal deoxynucleotidyl transferase dUTP nick end labeling (TUNEL) analysis shows proportions of TUNEL-positive cells in human SSCs transfected with NC-siRNA and forkhead box P4 (FOXP4)-siRNA 2. Scale bars in C: 20 μm. aP < 0.05.
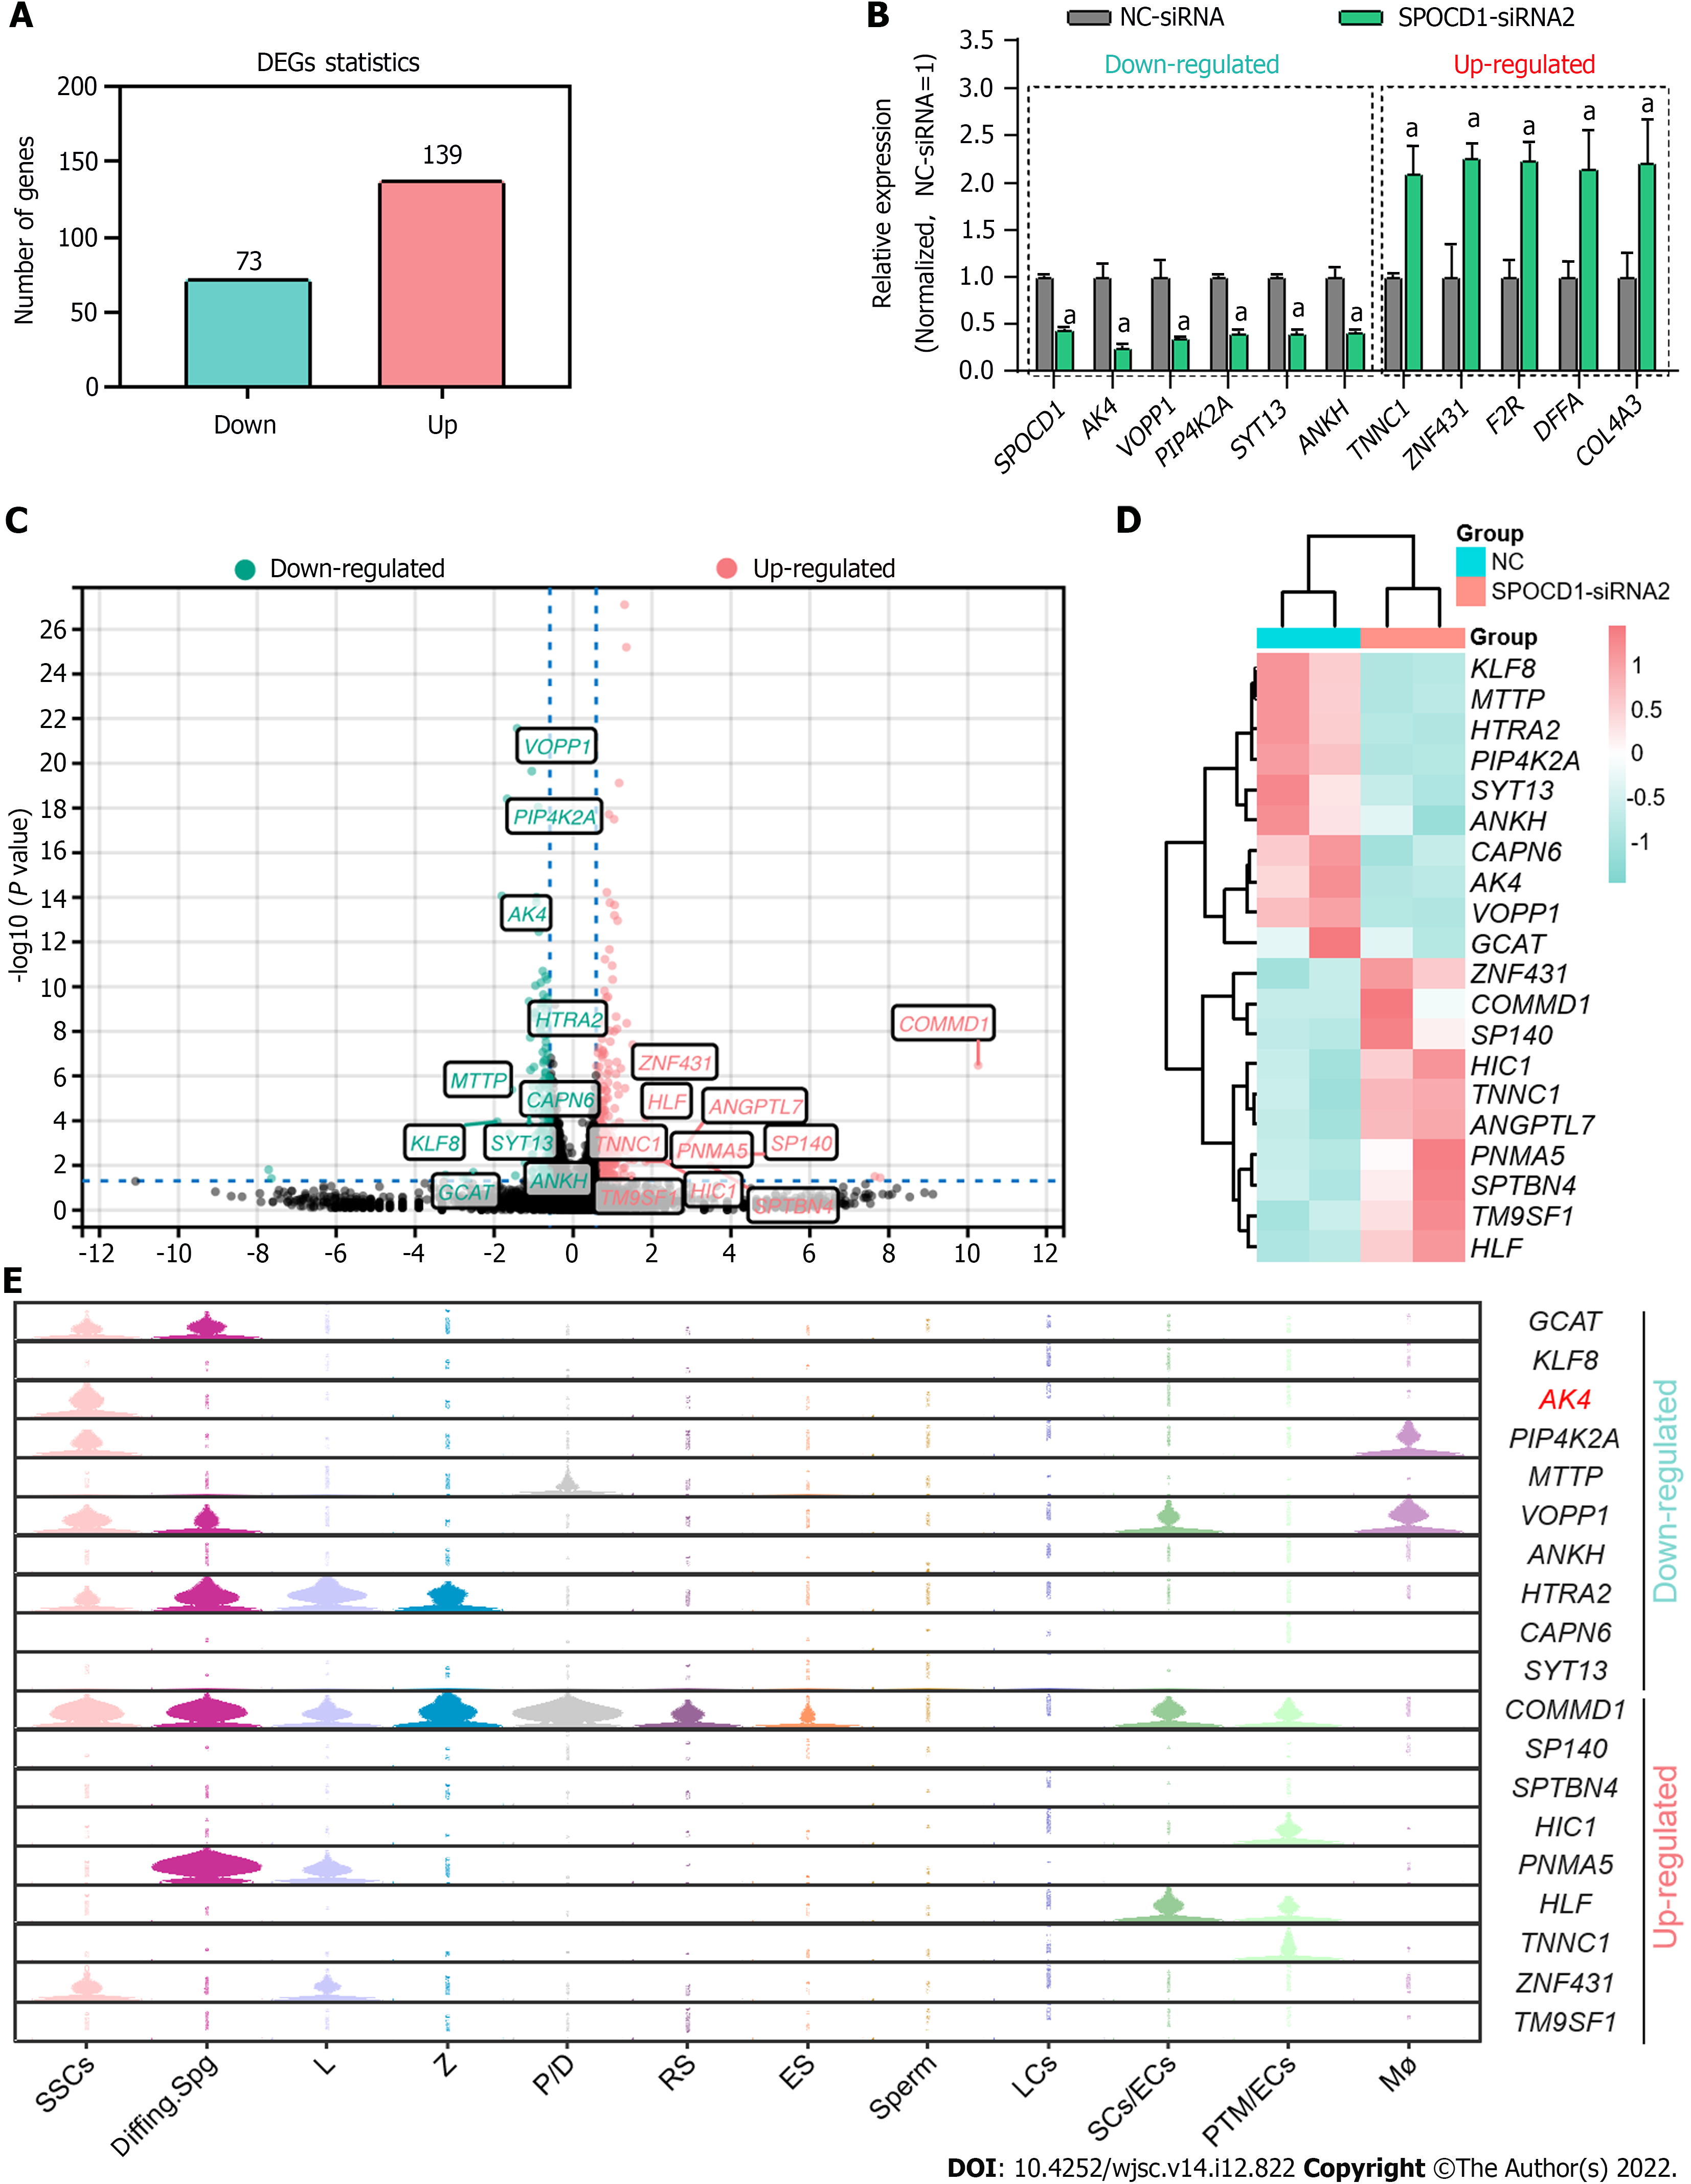
Figure 6 Identification of the target genes of SPOC domain-containing protein 1.
A: The number of genes was significantly affected by SPOC domain-containing protein 1 (SPOCD1) knockdown; B: Quantitative PCR validated the expression levels of SPOCD1 and 10 randomly selected genes significantly affected by SPOCD1; C: Volcano plot of differential gene expression between negative control (NC)-siRNA and SPOCD1-siRNA2 groups; D: Heatmap analysis of the top 20 differentially expressed genes (DEGs); E: Violin plots show the expression levels of the top 20 DEGs in all testicular cells. aP < 0.05.
Figure 7 SPOC domain-containing protein 1 promotes the proliferation of spermatogonial stem cells via adenylate kinase 4.
A and B: Western blotting shows the level of adenylate kinase 4 (AK4) after re-expression in SPOC domain-containing protein 1 (SPOCD1) knockdown spermatogonial stem cells (SSCs); C: Cell Counting Kit-8 was used to detect cell proliferation after AK4 was overexpressed in SPOCD1-knockdown SSCs; D and E: Cellular DNA synthesis was detected by 5-ethynyl-2’-deoxyuridine (EdU) analysis; F and G: Western blotting shows the protein levels of promyelocytic leukemia zinc finger (PLZF) and proliferating cell nuclear antigen (PCNA) after transfection with AK4 expression plasmid in SPOCD1 inhibited SSC; H and I: Cell apoptosis analysis after re-expression of AK4 using flow cytometry. Scale bar in D: 20 μm. aP < 0.05.
Figure 8 SPOC domain-containing protein 1 expression in the testes of obstructive azoospermia and non-obstructive azoospermia patients.
A and B: Proportions of glial cell line-derived neurotrophic factor family receptor alpha-1-positive spermatogonial stem cells (red) with SPOC domain-containing protein 1 (SPOCD1) expression (green) in obstructive azoospermia (OA) with normal spermatogenesis and other types of non-obstructive azoospermia (NOA) patients; C and D: Western blot analysis shows SPOCD1 protein levels in OA and NOA patients. In (A), each picture represents one testicular sample. Each group had two samples. HS: Hypospermatogenesis; Normal: Normal spermatogenesis; Spc MA: Spermatocyte maturation arrest; Spg MA: Spermatogonia maturation arrest. Scale bar in A: 50 μm. aP < 0.05.
- Citation: Zhou D, Zhu F, Huang ZH, Zhang H, Fan LQ, Fan JY. SPOC domain-containing protein 1 regulates the proliferation and apoptosis of human spermatogonial stem cells through adenylate kinase 4. World J Stem Cells 2022; 14(12): 822-838
- URL: https://www.wjgnet.com/1948-0210/full/v14/i12/822.htm
- DOI: https://dx.doi.org/10.4252/wjsc.v14.i12.822


