Copyright
©The Author(s) 2021.
World J Stem Cells. Jan 26, 2021; 13(1): 128-138
Published online Jan 26, 2021. doi: 10.4252/wjsc.v13.i1.128
Published online Jan 26, 2021. doi: 10.4252/wjsc.v13.i1.128
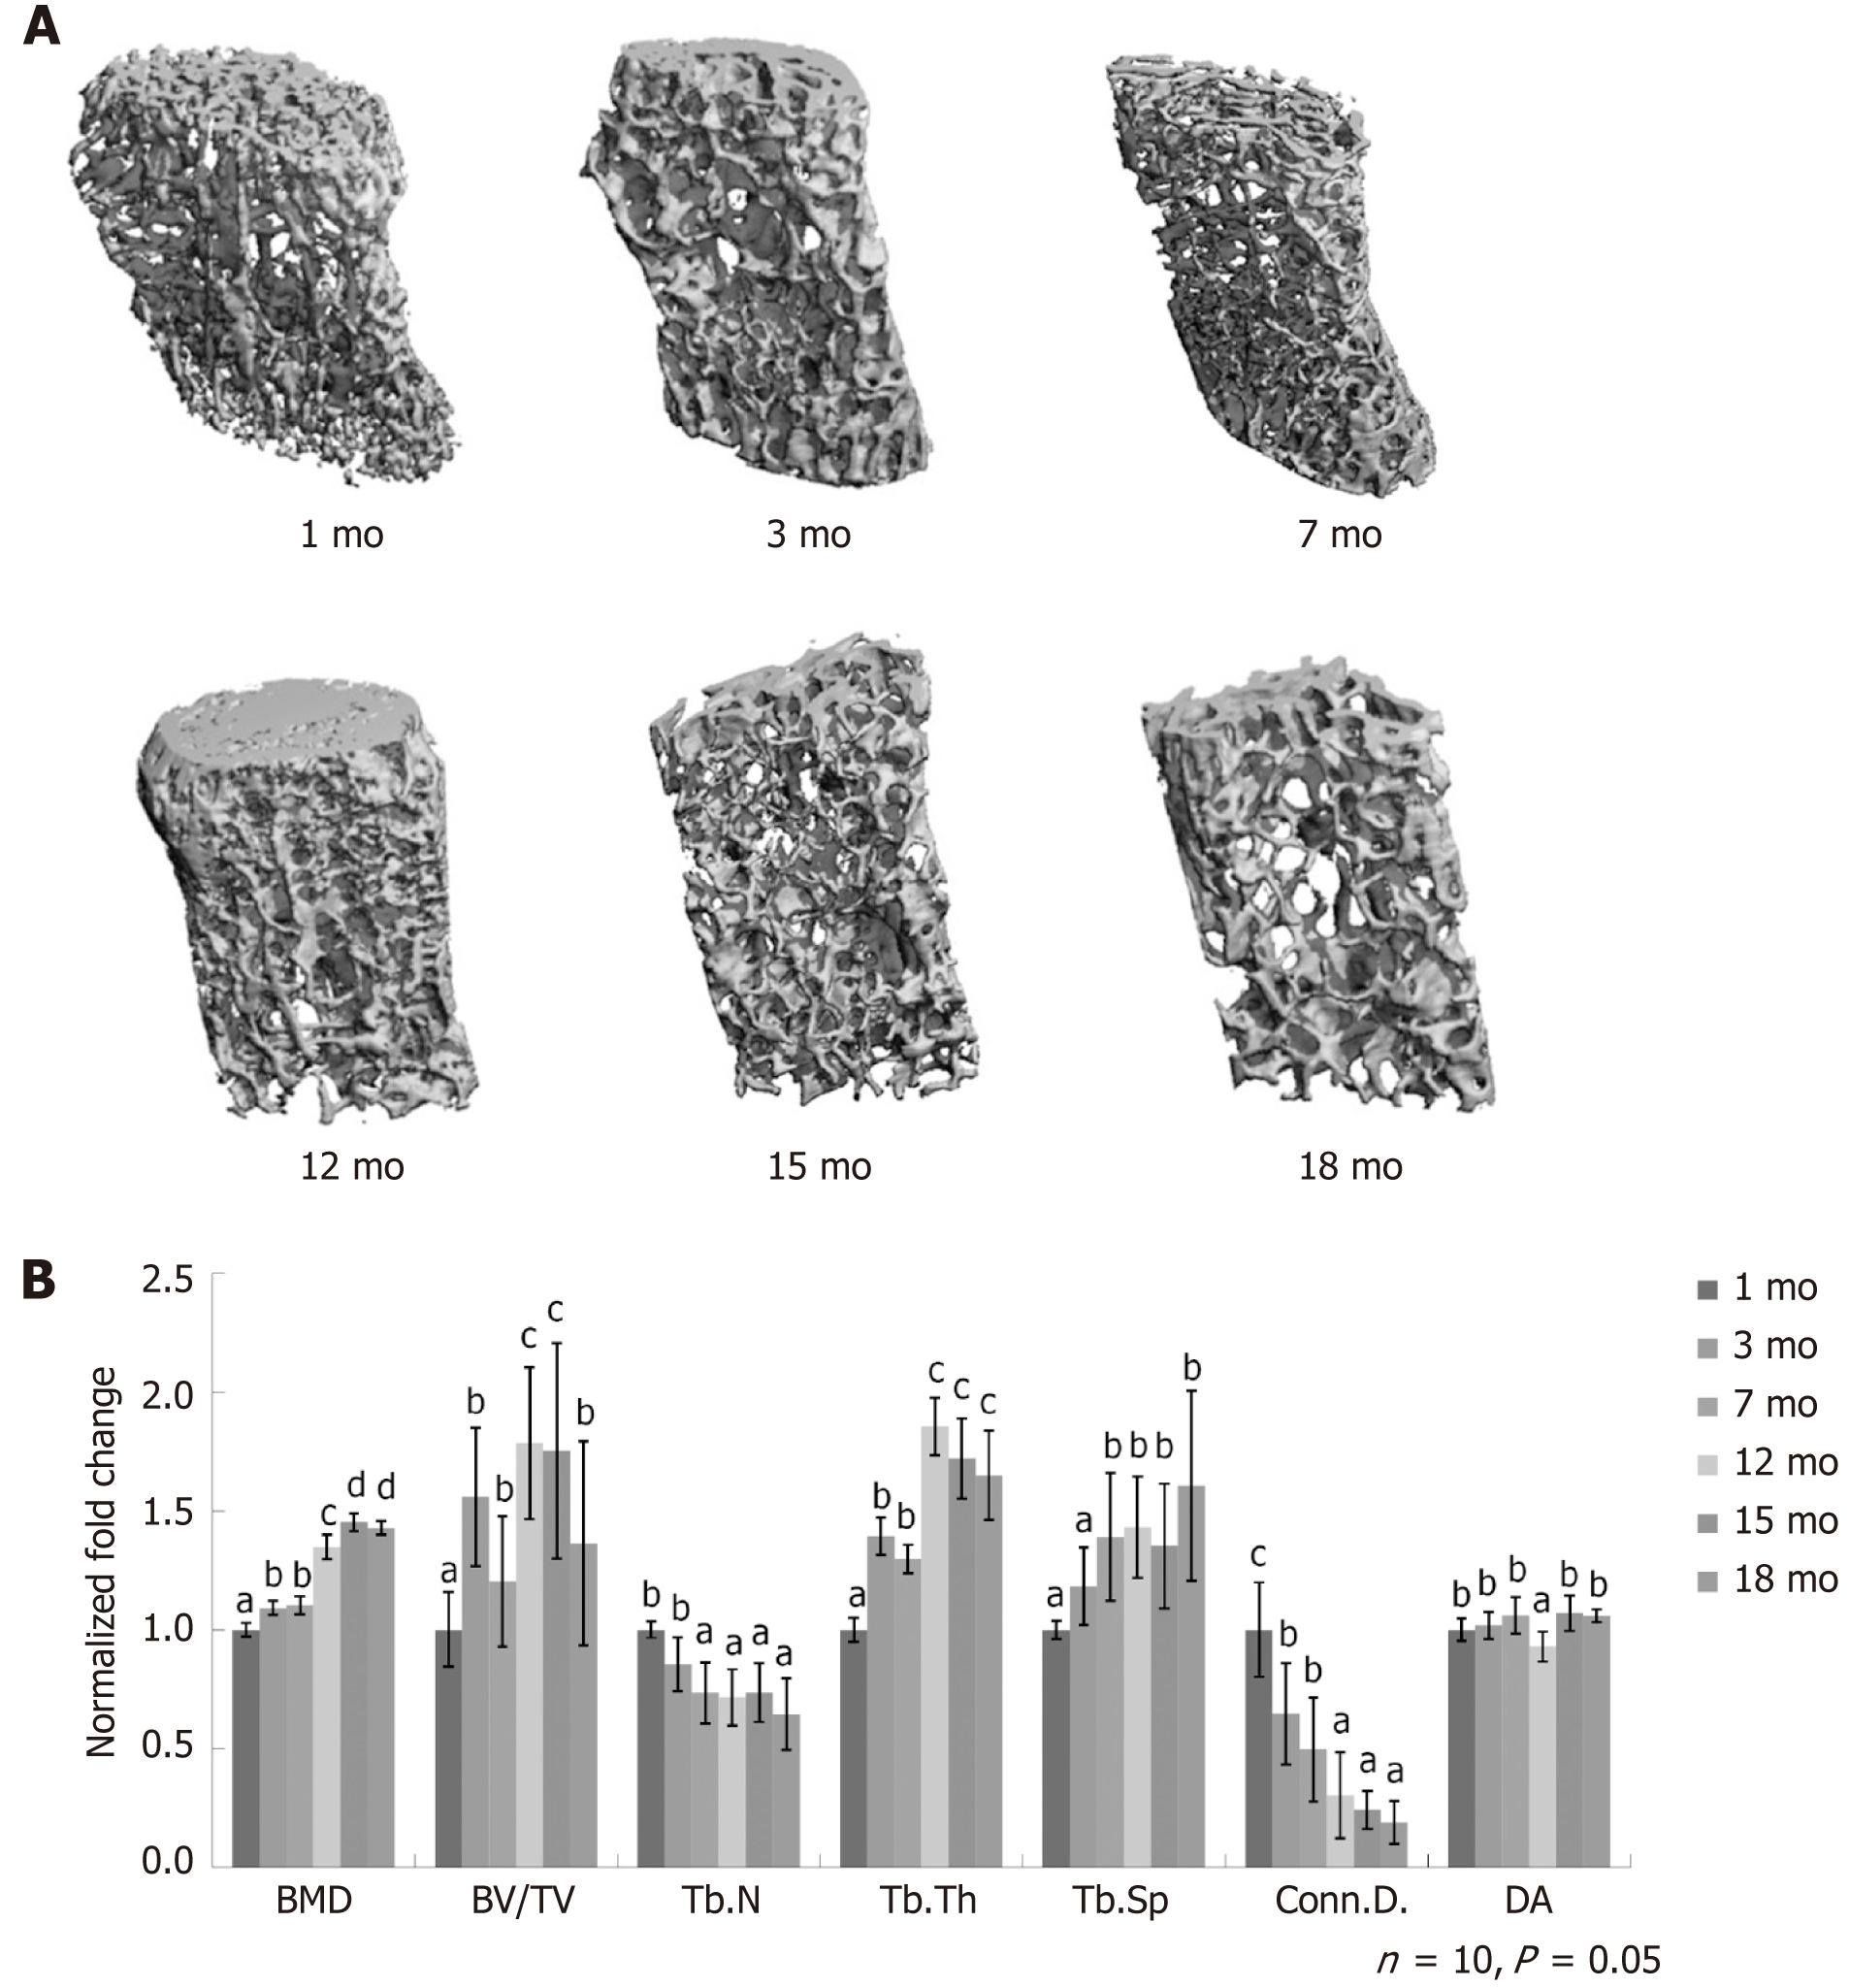
Figure 1 Quantitative measurement of skeletal features.
A: Micro-computed tomography images of L4 lumbar spine at 1 mo, 3 mo, 7 mo, 12 mo, 15 mo, and 18 mo; B: Quantitative measurement of the densitometry and structural parameters of cancellous bone, including the ratio of bone volume to tissue volume (BV/TV), the connectivity density of trabeculae (Conn.D.), the trabecular number (Tb.N), the trabecular thickness (Tb.Th), and the trabecular spaces (Tb.Sp). Bone mass density, Tb.Th, and Tb.Sp increased with age while Tb.N and Conn.D. decreased constantly. The BV/TV increased and reached the plateau at the age of 12 mo. The degree of anisotropy did not change over time between the window of 1 mo and 18 mo. BMD: Bone mass density; BV/TV: Bone volume to tissue volume; Tb.N: Trabecular number; Tb.Th: Trabecular thickness; Tb.Sp: Trabecular spaces; Conn.D.: Connectivity density of trabeculae; DA: Degree of anisotropy.
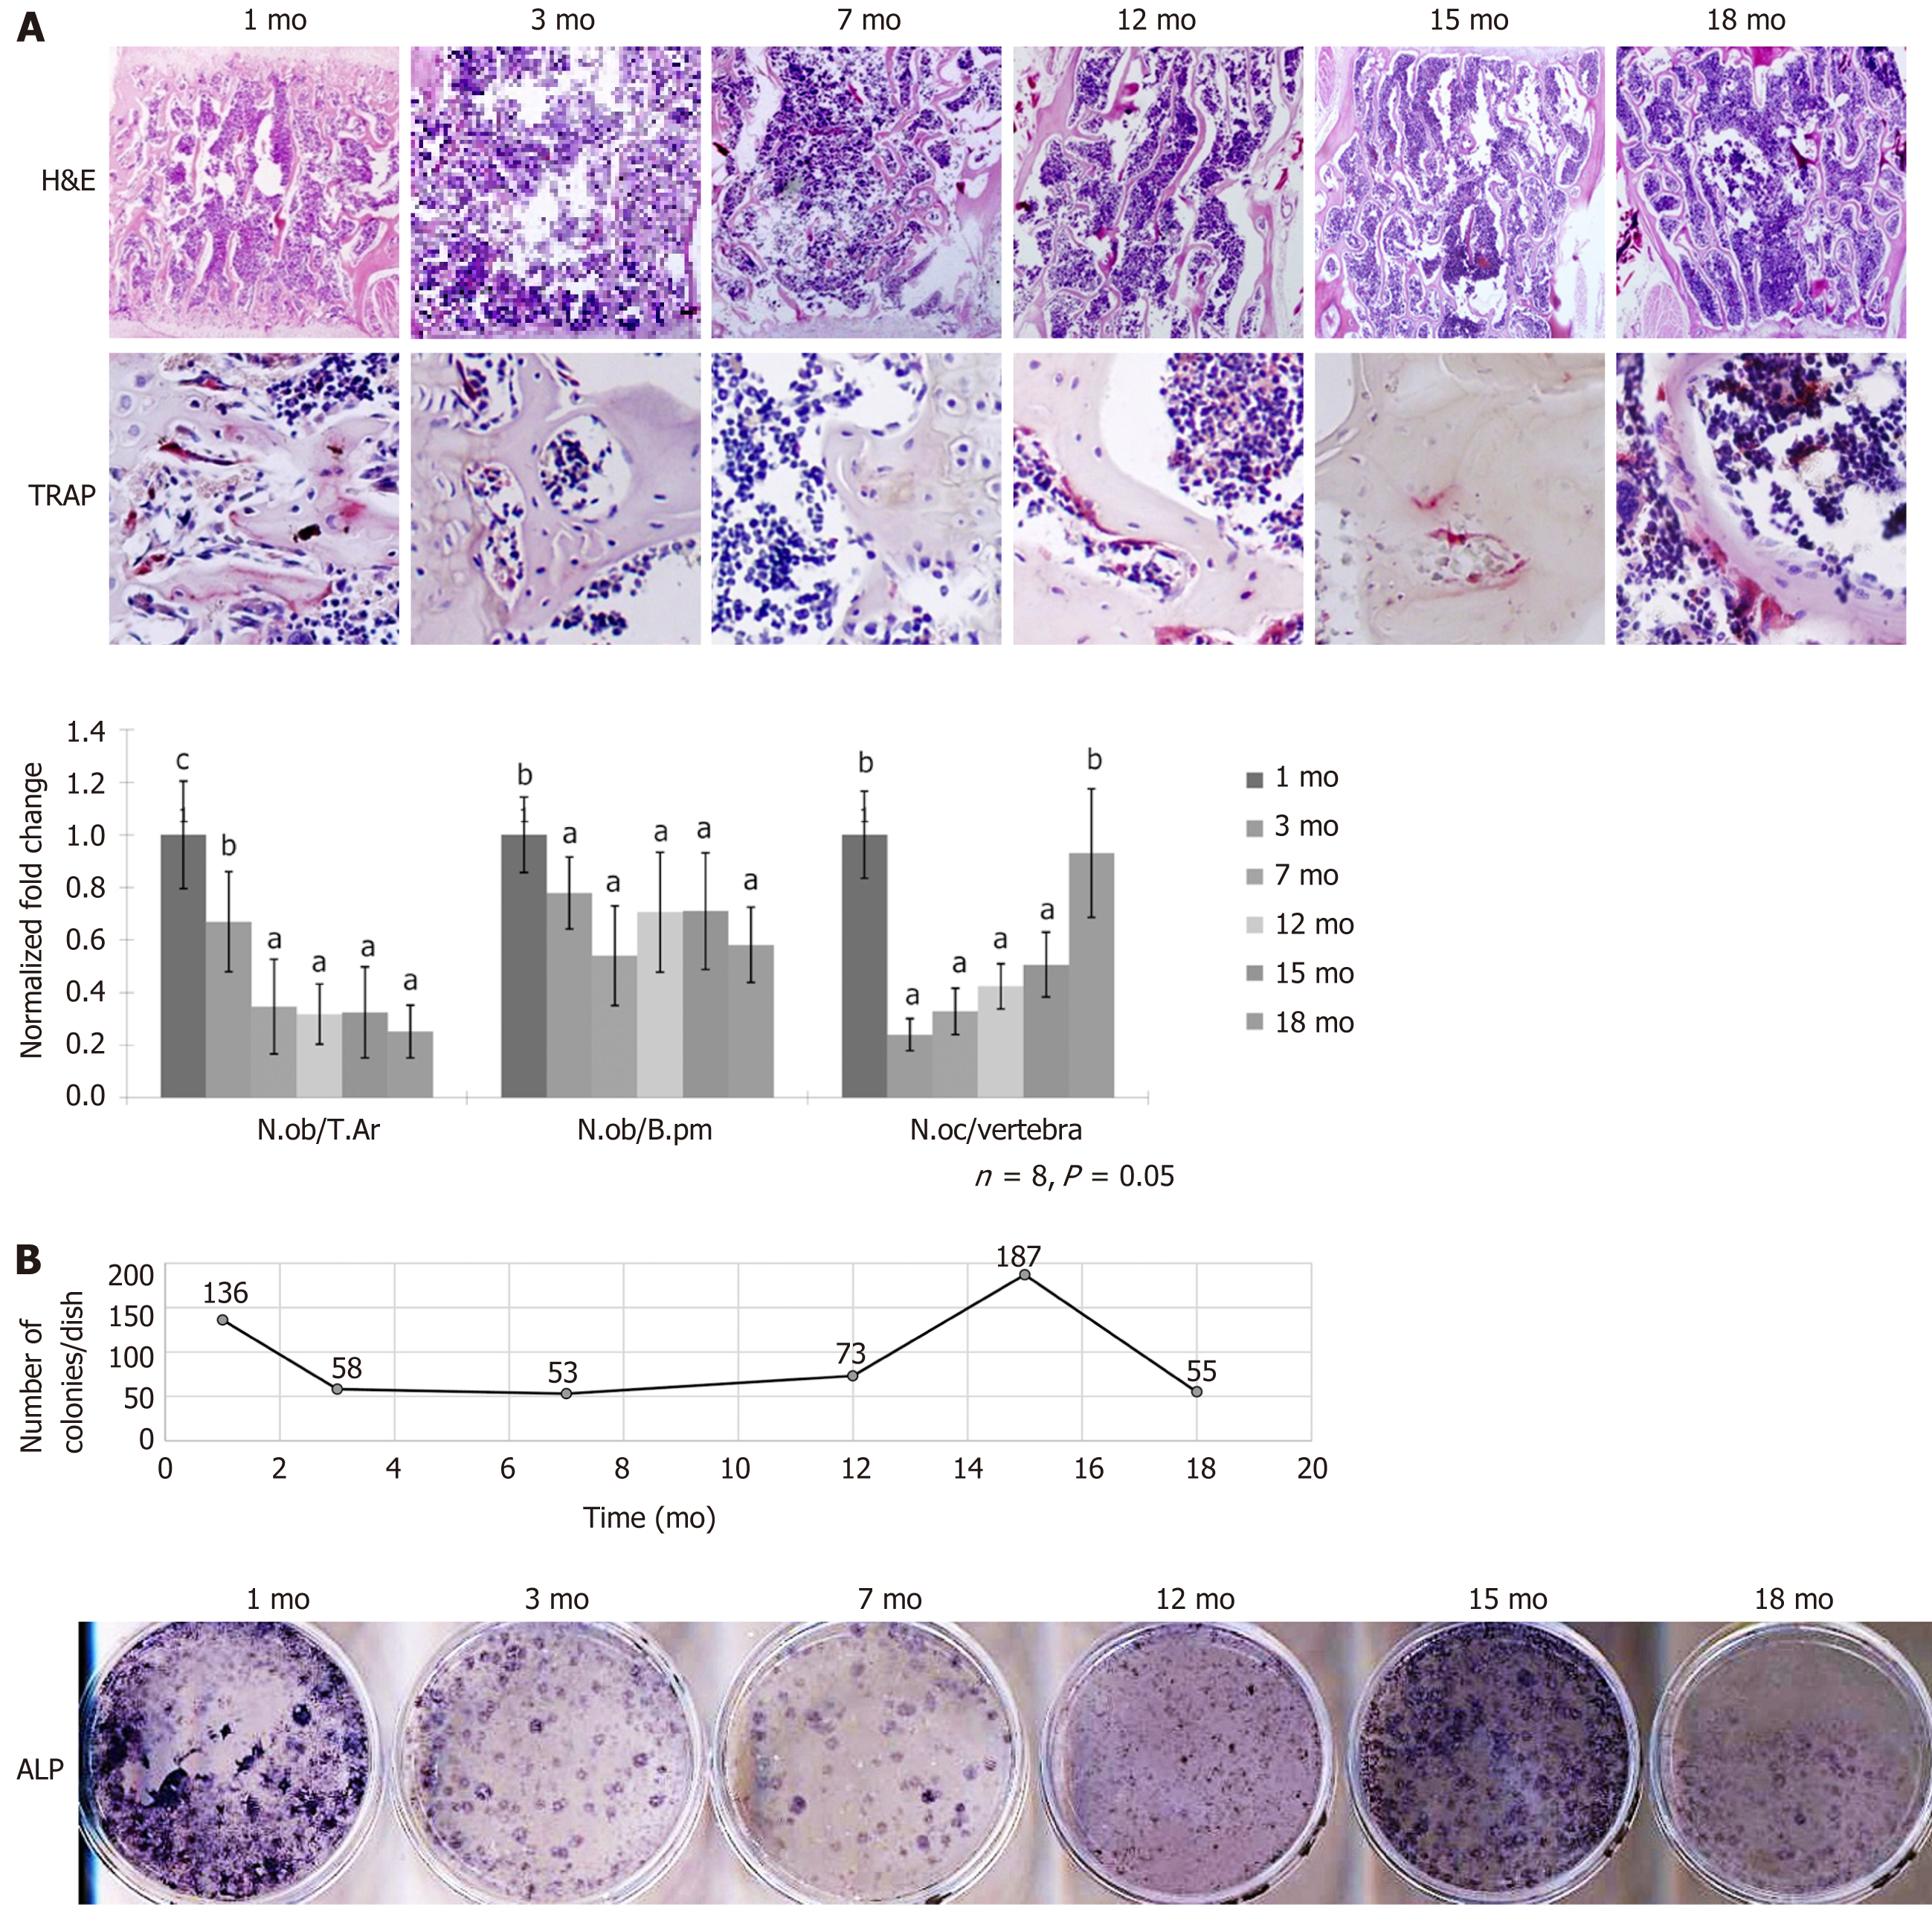
Figure 2 Histological assessment of bone properties and osteogenic bone marrow stromal cells during bone aging.
A: Mouse lumbar spine at different ages was sectioned and stained with hematoxylin and eosin for osteoblast detection, or underwent tartrate-resistant acid phosphatase staining for quantifying the number of osteoclasts. The quantitative analysis measured the osteoblast number per trabecular surface area or perimeter, and osteoclast number per vertebra; B: Self-renewal and differentiation capacity of bone marrow stromal cells assessed via colony-forming assay and alkaline phosphatase staining. Two peaks at 1 mo and 15 mo were detected, suggested the modeling and remodeling phase during development and aging. H&E: Hematoxylin and eosin; TRAP: Tartrate-resistant acid phosphatase; ALP: Alkaline phosphatase; N.ob: Number of osteoblasts; T.Ar: Trabecular bone area; B.pm: Bone perimeter; N.oc: Number of the osteoclast.
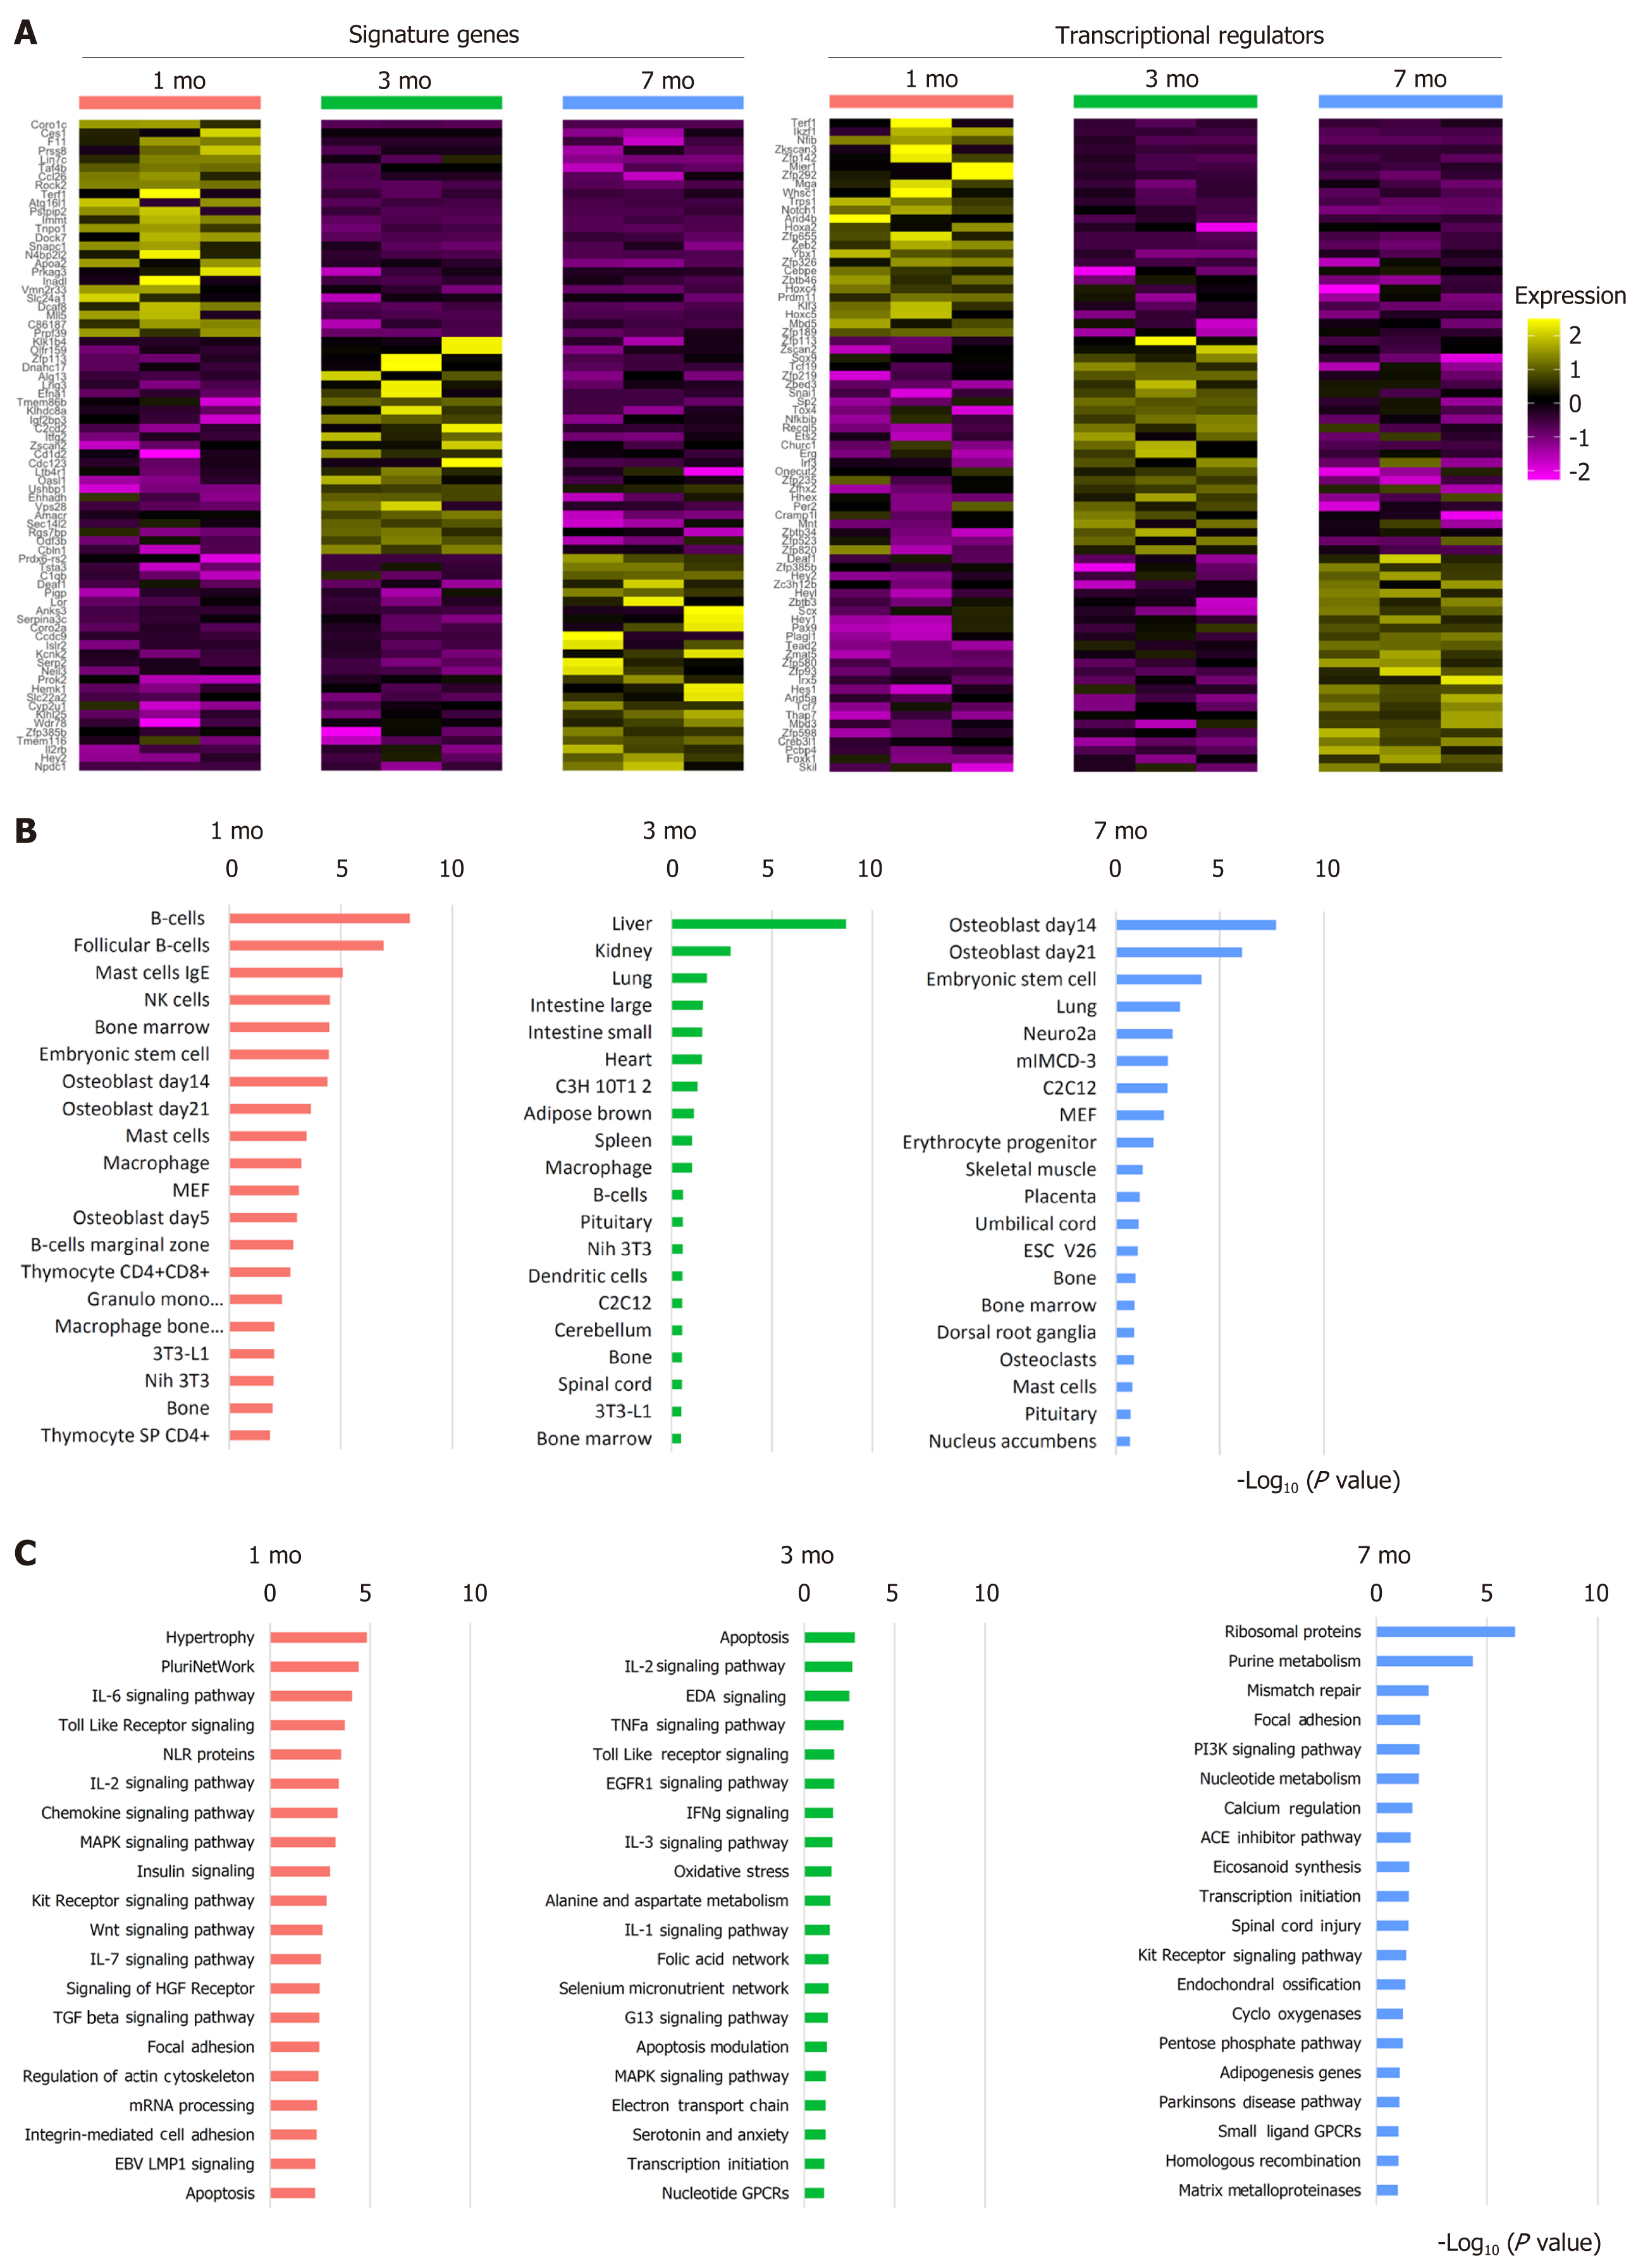
Figure 3 Transcriptomic profile of bone marrow stromal cells in young mice.
A: The heatmap demonstrated the signature genes and the transcription regulators differentially expressed at different ages that were computed from the microarray data; B: The gene set enrichment analysis taking mouse cell atlas as reference revealed the fate tendency of bone marrow stromal cells (BMSCs); C: The signaling pathway analysis uncovered the associated signaling pathways enriched at different ages in BMSCs.
- Citation: Cheng YH, Liu SF, Dong JC, Bian Q. Transcriptomic alterations underline aging of osteogenic bone marrow stromal cells. World J Stem Cells 2021; 13(1): 128-138
- URL: https://www.wjgnet.com/1948-0210/full/v13/i1/128.htm
- DOI: https://dx.doi.org/10.4252/wjsc.v13.i1.128


