Copyright
©The Author(s) 2020.
World J Stem Cells. Aug 26, 2020; 12(8): 706-720
Published online Aug 26, 2020. doi: 10.4252/wjsc.v12.i8.706
Published online Aug 26, 2020. doi: 10.4252/wjsc.v12.i8.706
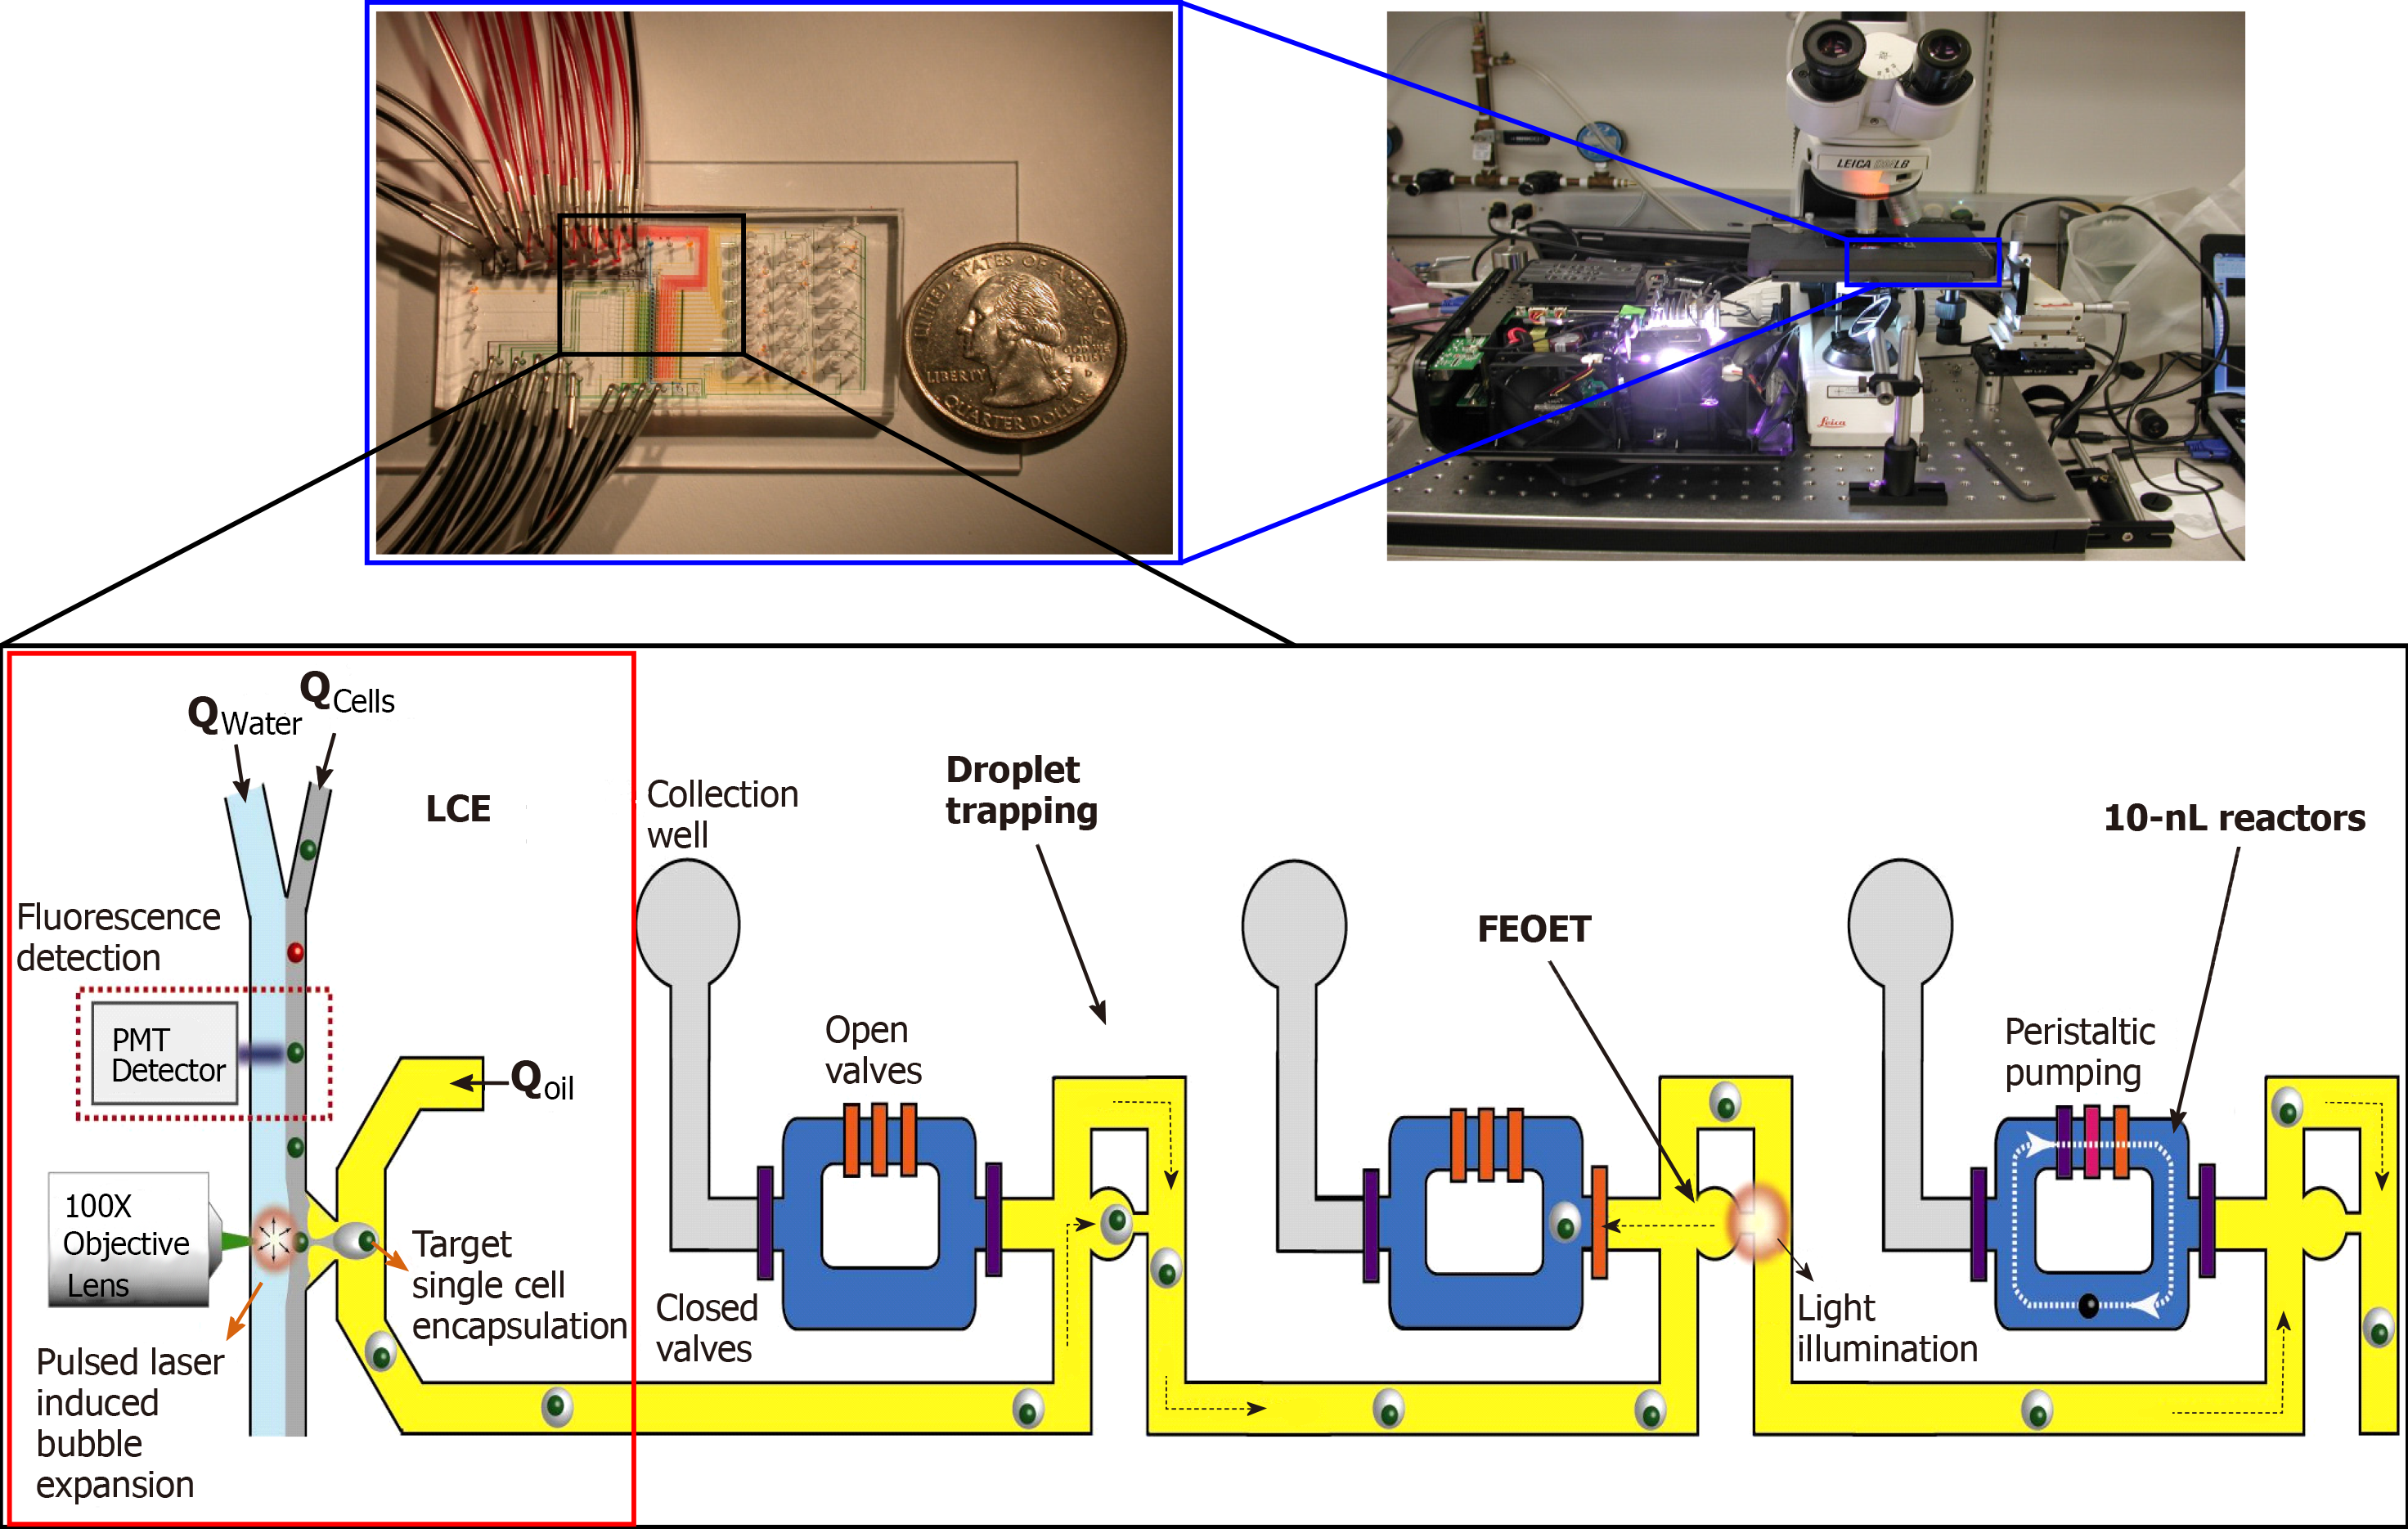
Figure 1 A prototype LSCAT device for single-cell transcriptome analysis.
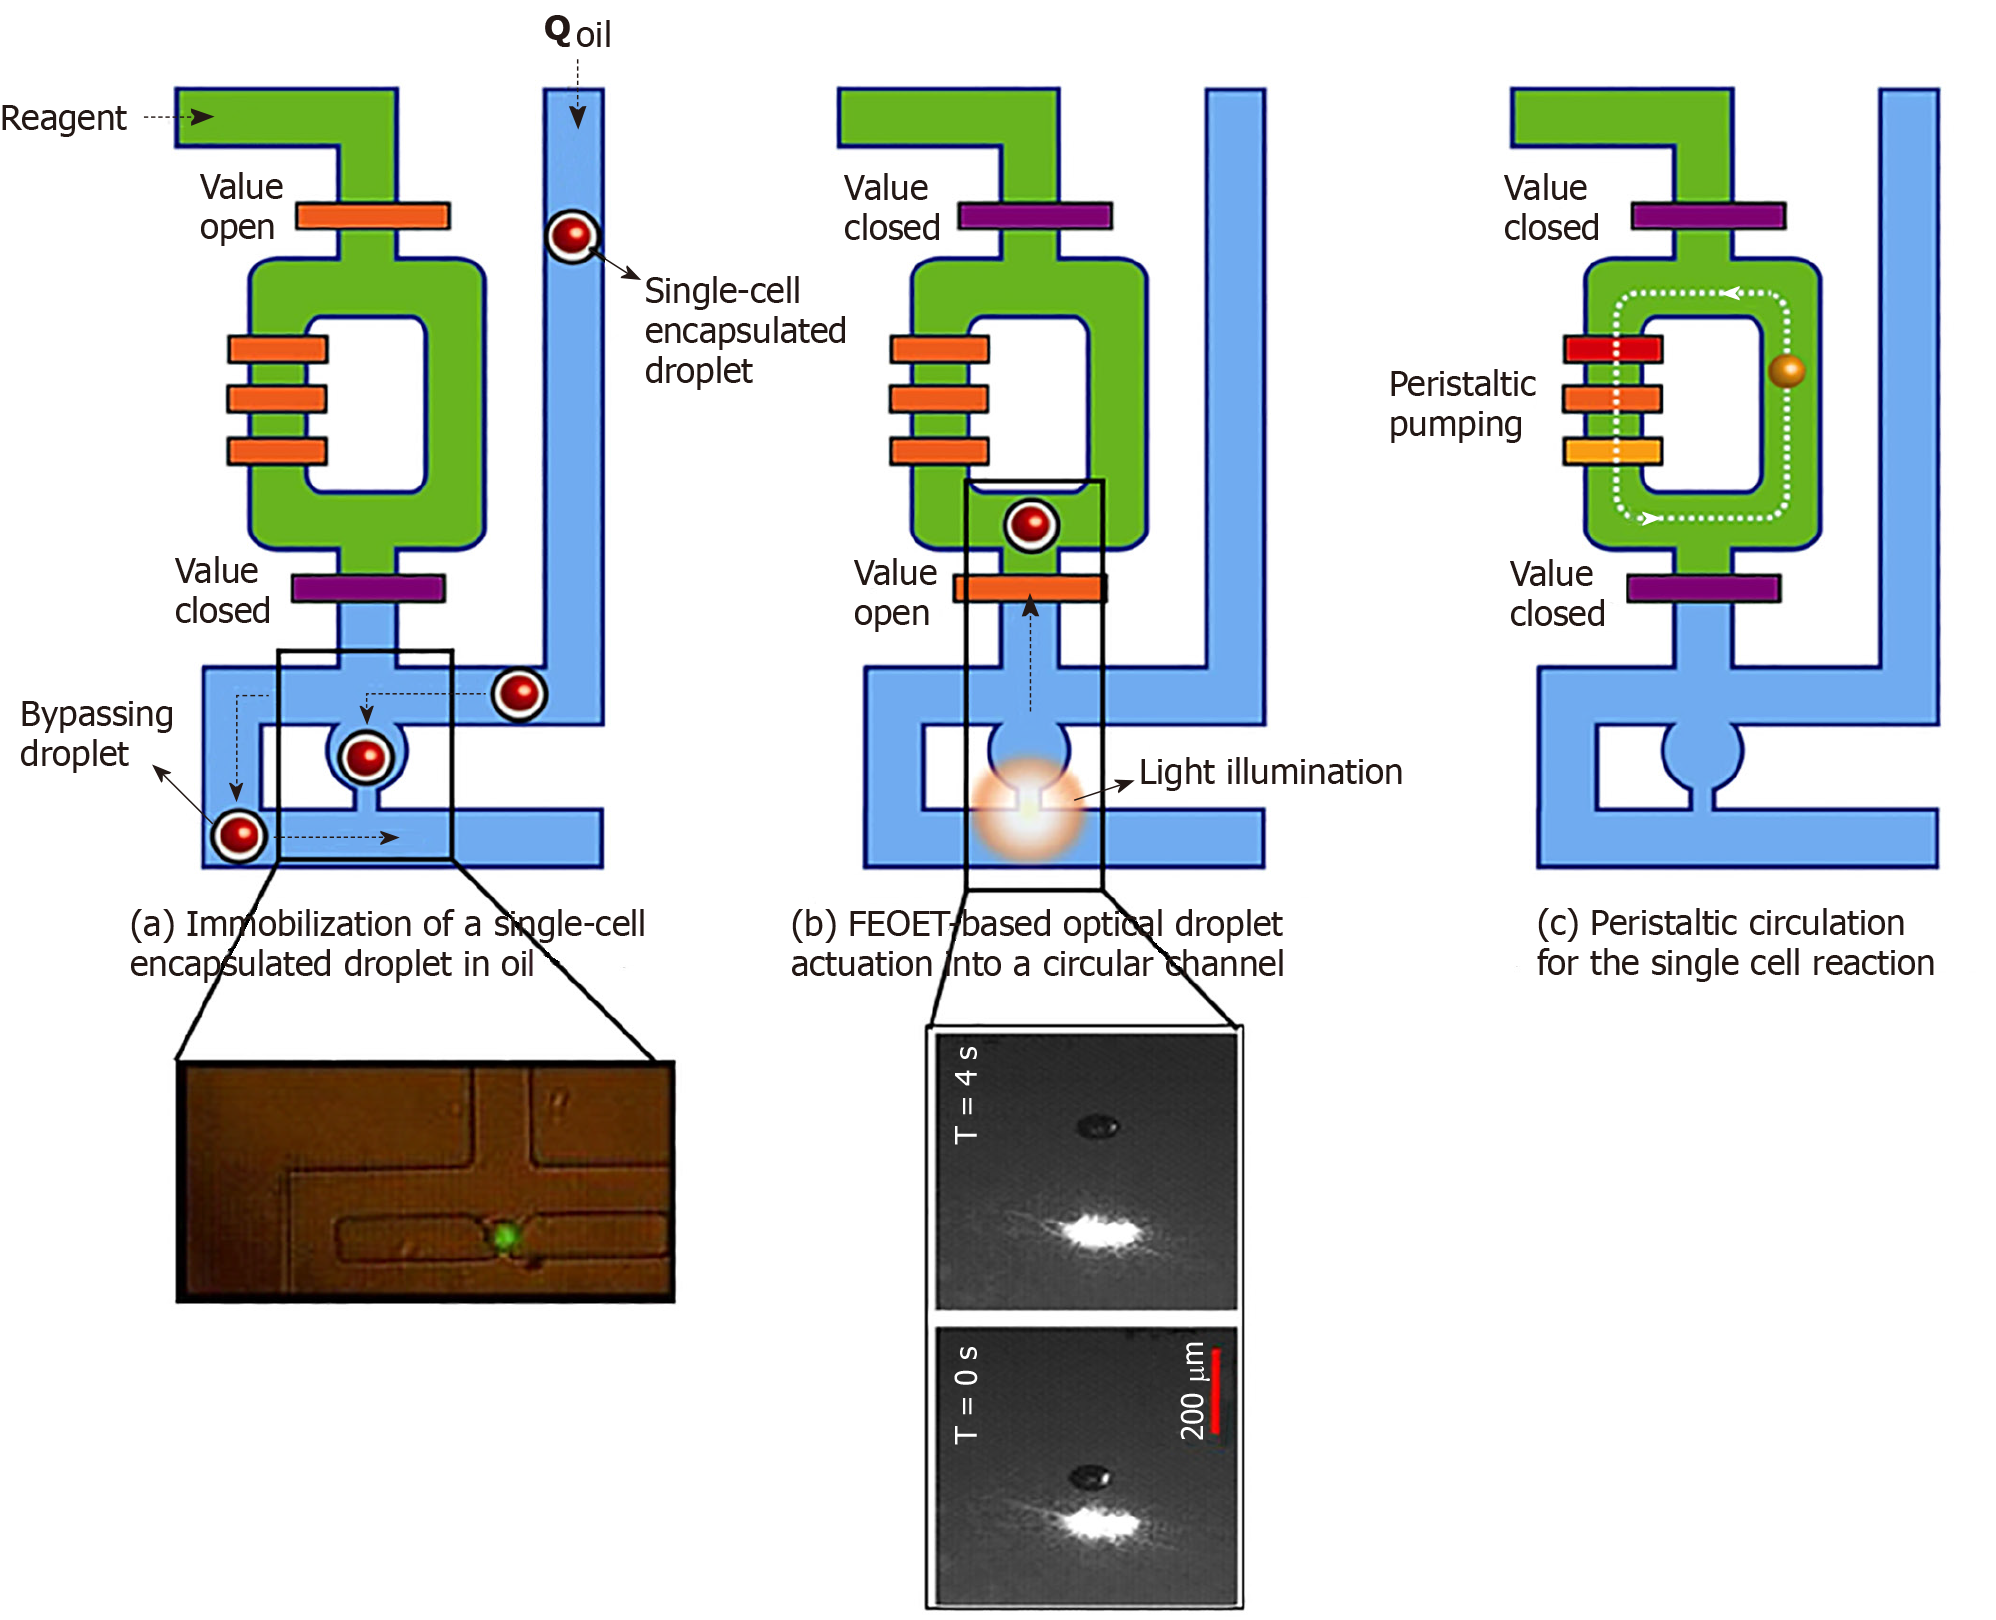
Figure 2 Processing of single-cell droplets.
A: A single-cell in an oil droplet travels to a trapping module of the 10-nl reactor (green, in inset). Other cells are forced to bypass to the next unit; B: FEOET push the droplet (with a cell) past the open valve (orange bar), which closes, locking the droplet into the 10-nl ring with RT/RT-PCR master mix (green); and C: The ring’s peristaltic pump breaks the droplet to mix the cell with master-mix. When the reaction is finished, oil (blue) pushes the product (cDNA) out of the ring in the form of a droplet (10-nL) for downstream molecular analysis (Refer to[17] for details).
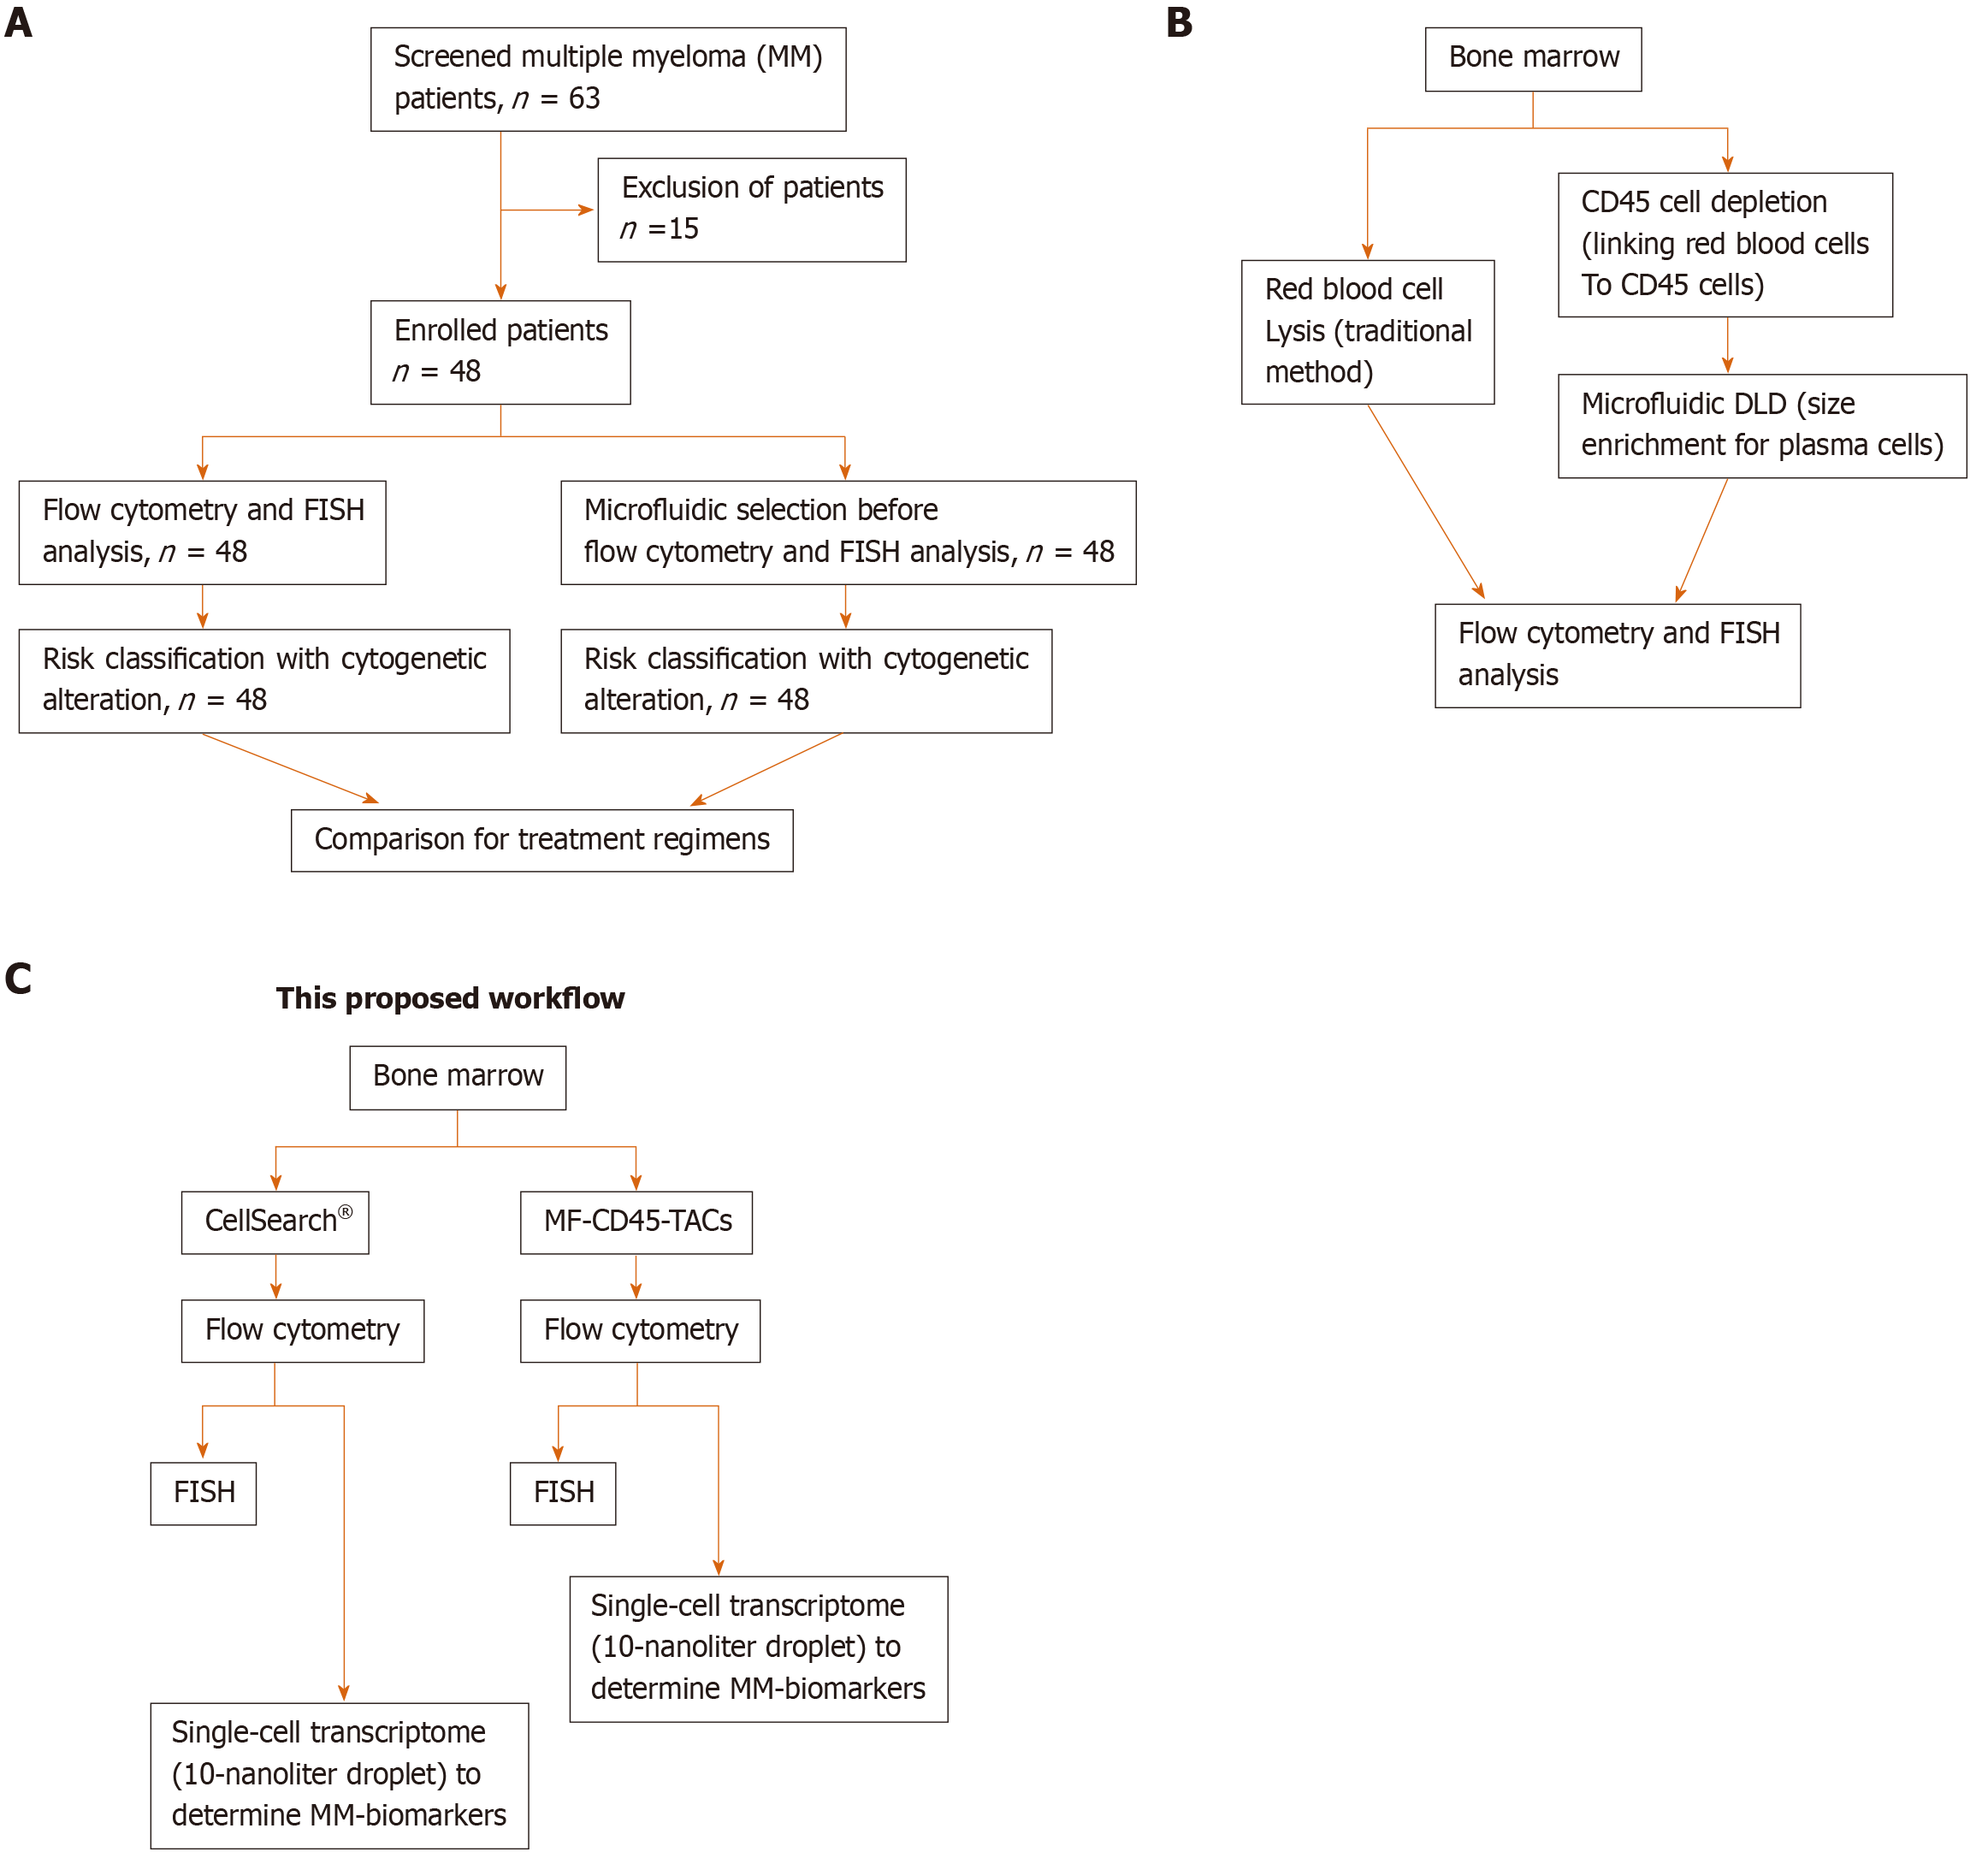
Figure 3 Schematic designs of the proposed workflow.
A: Consolidated Standards of Reporting Trials diagram. A total of 63 patients were screened for eligibility. Only 48 patients were newly diagnosed with multiple myeloma before receiving any treatment. These patients were enrolled, and their bone marrow obtained at diagnosis was divided into two aliquots: One aliquot underwent traditional flow cytometry and FISH analysis, and the other aliquot was subjected to microfluidic selection for enrichment of CD45-PCs, then subjected to flow cytometry and FISH analysis. Results from both methods were compared; B: Comparison of traditional method to microfluidic method (MF-CD45-TACs). MF-CD45-TACs significantly enrich plasma cells for flow cytometry and FISH assays and improve the accuracy of these assays; C: This proposed workflow (Note that we can use both bone marrow and circulating multiple myeloma cells[76]).
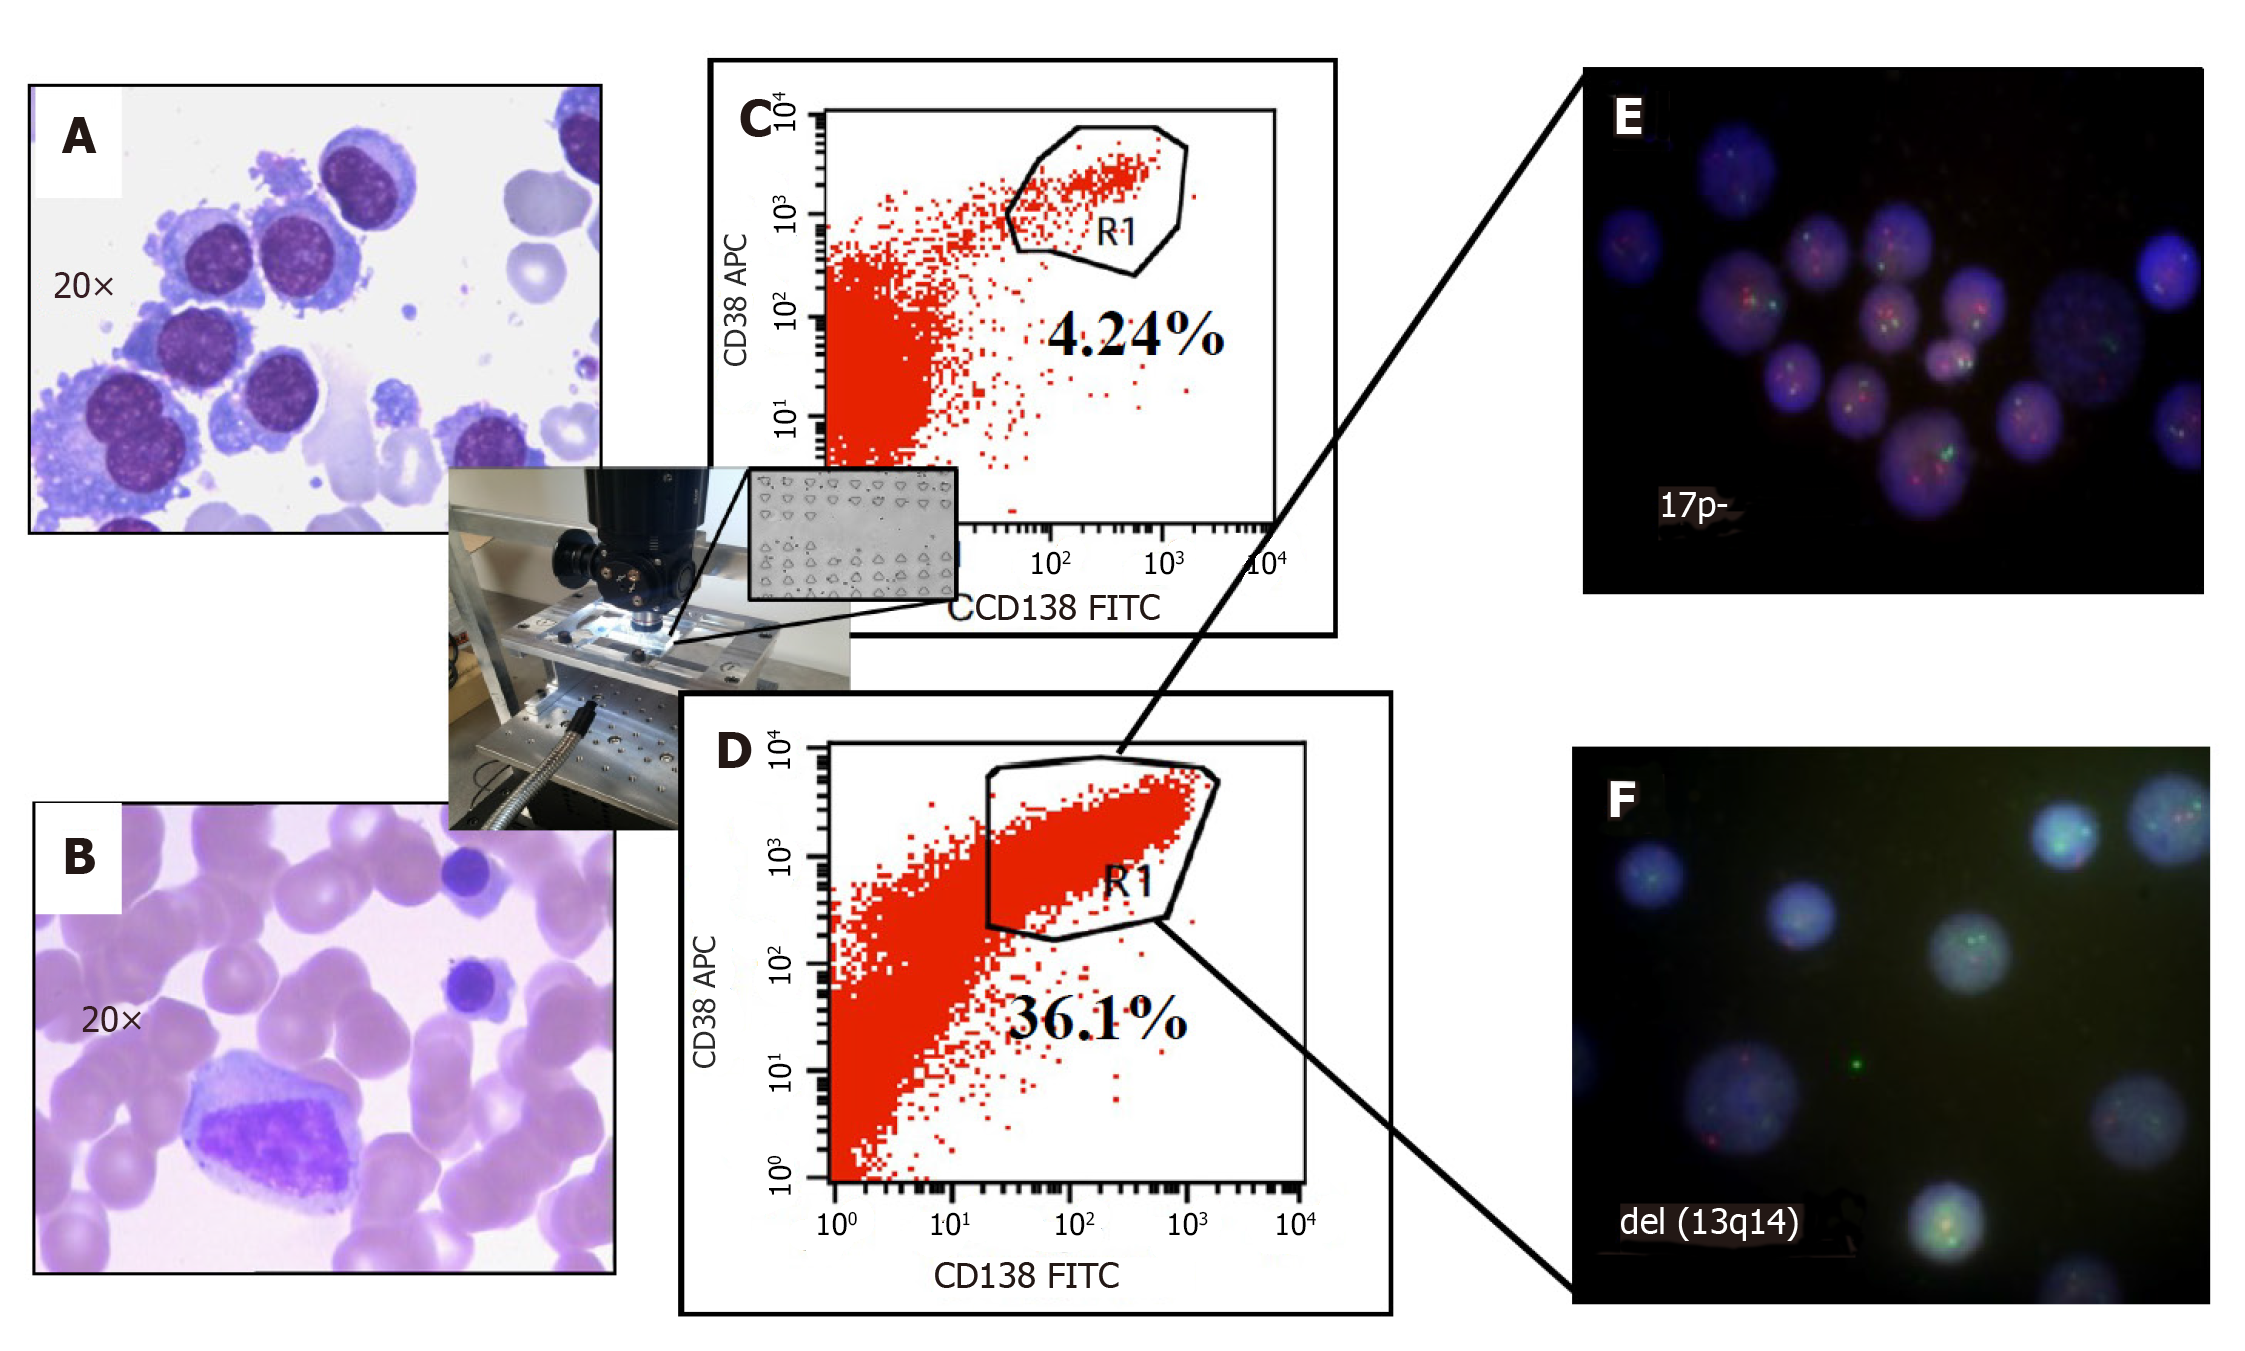
Figure 4 Improved clinical outcomes with microfluidic CD45 depletion (Patient 1).
A: Bone marrow smear at the time of initial diagnosis; B: Bone marrow smear after effective treatment (complete remission); C: Flow-cytometry without microfluidic enrichment. Plasma cells (CD38+/CD138+) is only 4.24% and no FISH cytogenetic abnormalities were found (low risk); D: After microfluidic enrichment (center inset) plasma cells (CD38+/CD138+) increased to 36.1%; E: FISH on enriched plasma cells show 17p- (Red: D13S319; Green: P53); F: FISH showed del(13q14) in enriched PC (Red: D13S319; Green: RB1). With enriched plasma cell for FISH, the patient was reclassified and treated as high-risk multiple myeloma which leads to complete remission (Refer to[17] for details).
Figure 5 Microfluidic risk-stratification improves clinical outcomes of multiple myeloma (Patient 2).
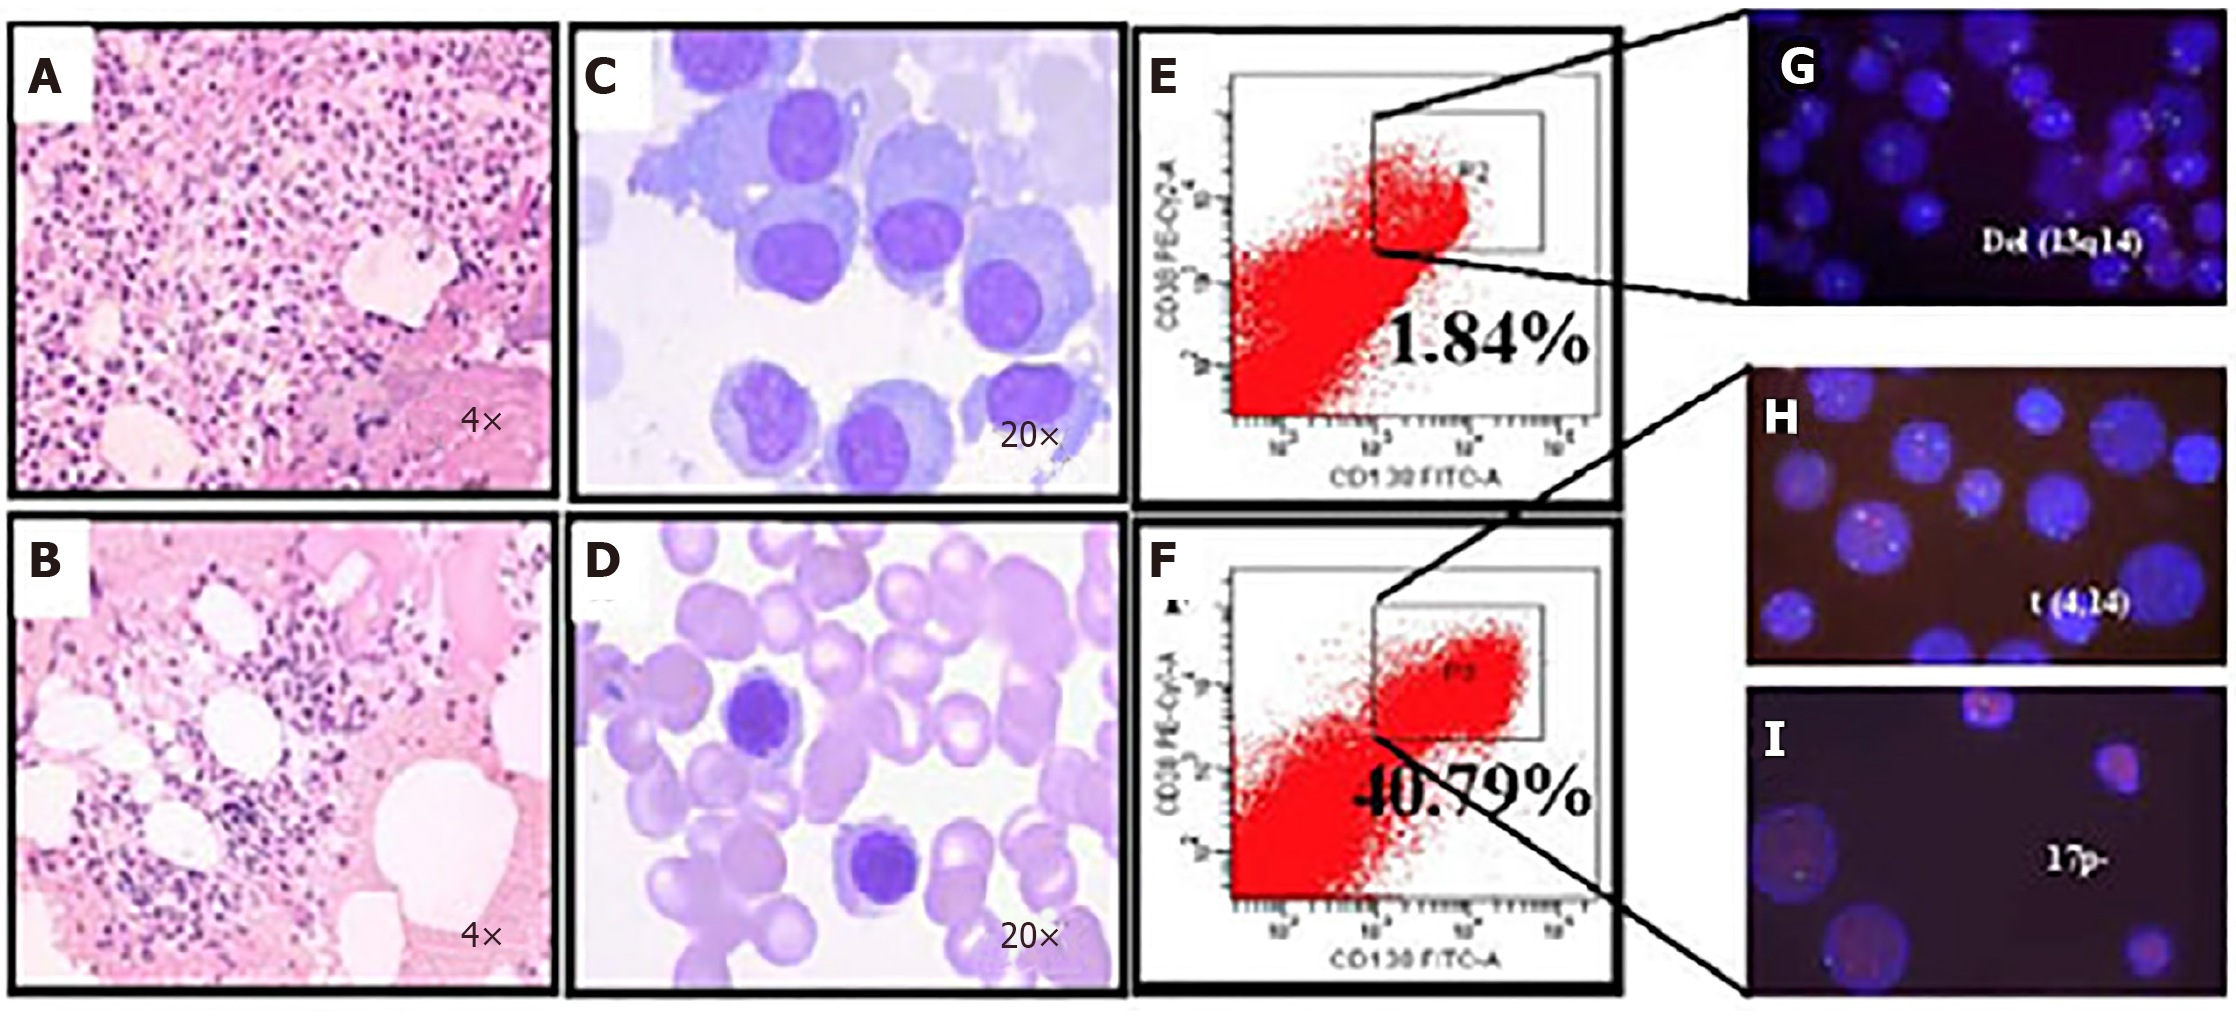
A: Bone marrow at diagnosis. Active granulocyte hyperplasia; B: Partial remission was achieved with revised risk-stratification; C: At diagnosis, bone marrow plasma cell (PC) abnormalities included clustered and scattered distribution of primitive and immature PCs, with large cell body, fine chromatin, visible nucleolus, and abundant cytoplasm; D: After treatment for high-risk multiple myeloma, PCs were rare and had normal morphology; no typical abnormal PCs were observed; E: At diagnosis without microfluidic enrichment, PCs (CD38+/CD138+) were only 1.84 %; F: After microfluidic enrichment, PCs (CD38+/CD138+) increased to 40.79%; G: Without microfluidic enrichment, FISH showed IgH rearrangement and del(13q14), leading to classification as intermediate risk (Red: D13S319; Green: P53); H and I: After microfluidic enrichment, in addition to del(13q14), FISH showed t (4,14) fusion (yellow dots) and 17p- (Red: D13S319; Green: P53), patient was reclassified and treated as high-risk, which led to efficacious treatment (Refer to[17] for details).
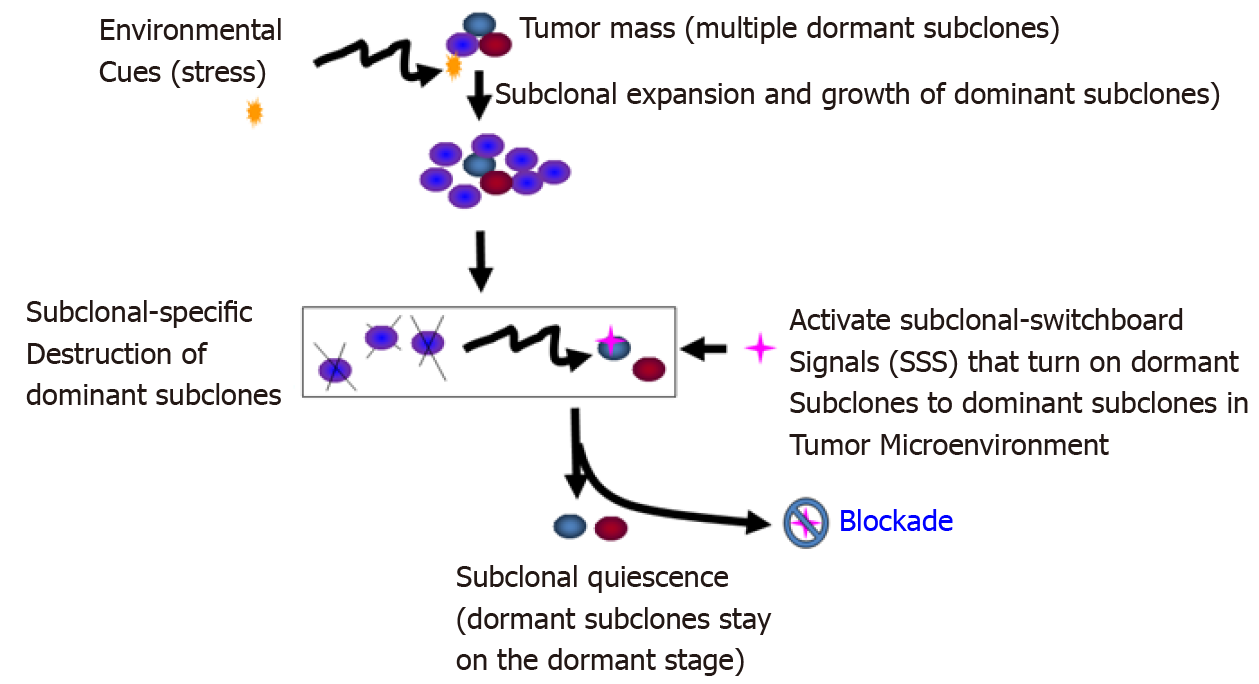
Figure 6 Blockade of the dominating subclonal switchboard signals in cancer stem cells as a new therapeutic strategy to suppress the dominating subclone shift to control cancer progression and post-treatment cancer recurrence.
Showed is the proposed new treatment paradigm that should target the subclonal-switchboard signals (SSS). Blocking the dominating subclonal SSS leads to subclonal quiescence, so keeping tumors alive but small and manageable (dormant/quiescent subclone). Note that SSS as mechanisms for leading to shifting dominating subclones as triggered by environmental cues (stress) for cancer progression and post-treatment. A cancer subclone may gain a mutation that, in the appropriate environment cue, leads to dominating subclonal activation due to positive selection. Showed lettering and lines/ arrows in the black color is the current concept of a treatment strategy for cancer- dominant subclonal cells (cancer stem cells) that may acquire a mutation in a suitable environment, triggering to dominating subclonal expansion and growth. When this dominating subclone is explicitly destroyed, it sends out dominating subclonal-SSS to a dormant/quiescent subclonal cell, which gets activated for dominating subclonal expansion and growth (adopted from[38]).
- Citation: Lee LX, Li SC. Hunting down the dominating subclone of cancer stem cells as a potential new therapeutic target in multiple myeloma: An artificial intelligence perspective. World J Stem Cells 2020; 12(8): 706-720
- URL: https://www.wjgnet.com/1948-0210/full/v12/i8/706.htm
- DOI: https://dx.doi.org/10.4252/wjsc.v12.i8.706


